. 2015 Oct 12;211(1):191-203.
doi: 10.1083/jcb.201503005.

Surface apposition and multiple cell contacts promote myoblast fusion in Drosophila flight muscles

Affiliations

Surface apposition and multiple cell contacts promote myoblast fusion in Drosophila flight muscles

Nagaraju Dhanyasi et al. J Cell Biol. .

Abstract

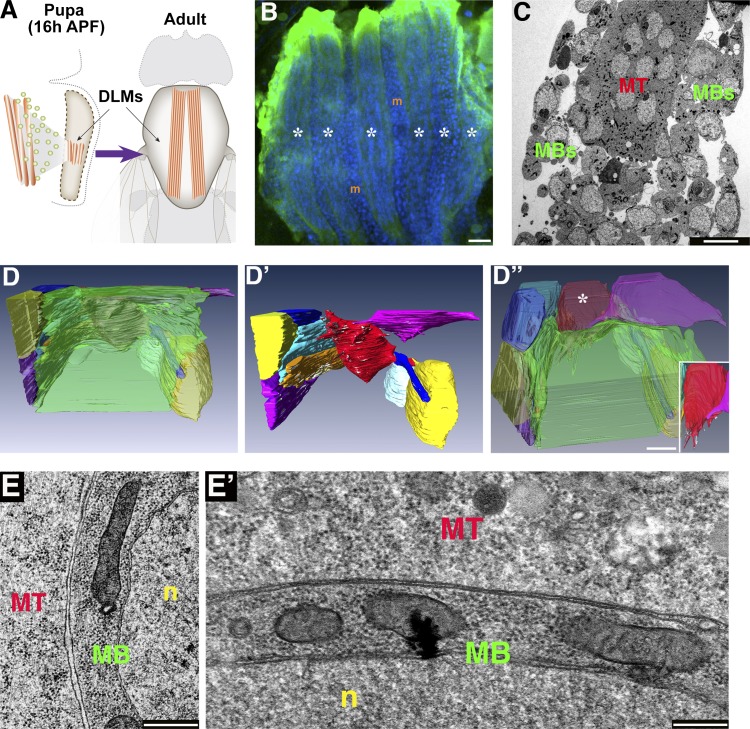
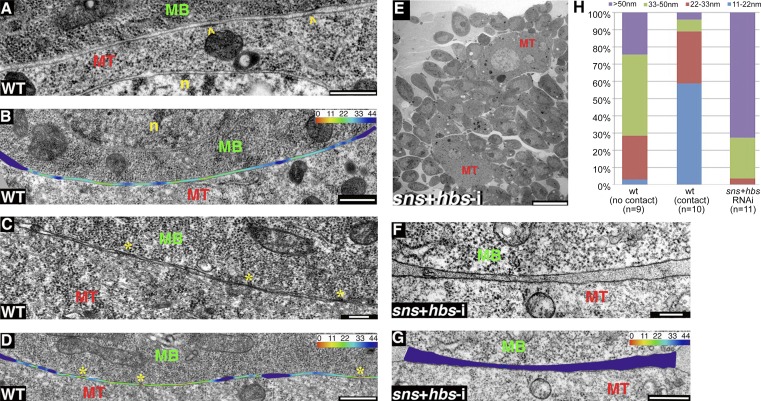
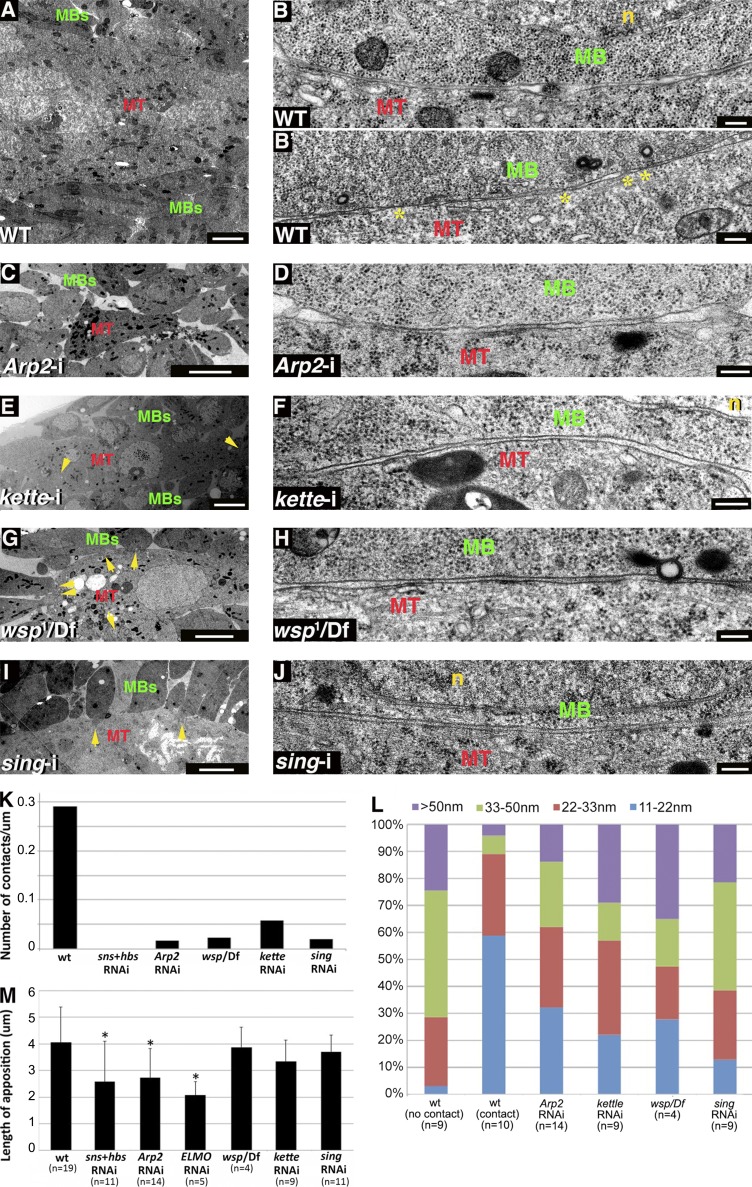
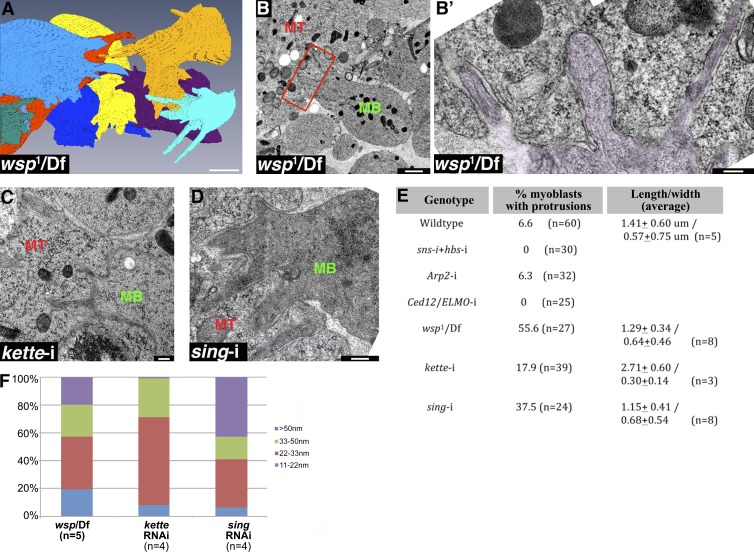
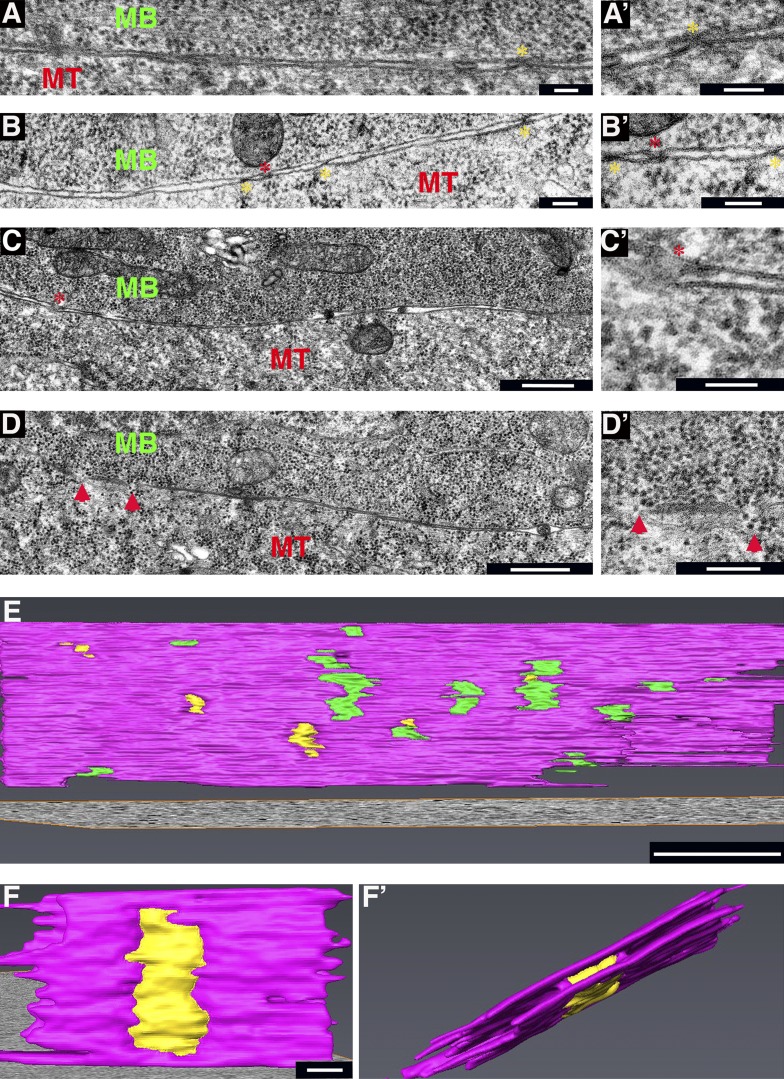
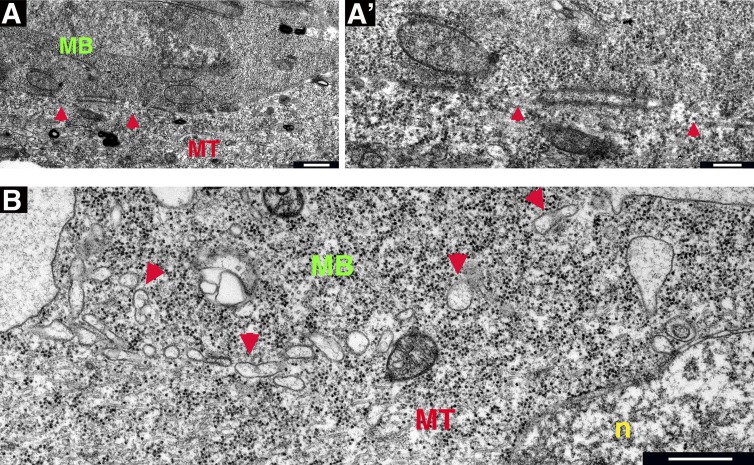
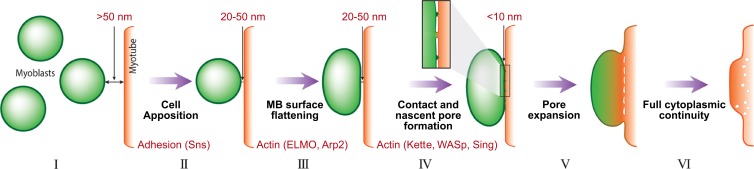
Fusion of individual myoblasts to form multinucleated myofibers constitutes a widely conserved program for growth of the somatic musculature. We have used electron microscopy methods to study this key form of cell-cell fusion during development of the indirect flight muscles (IFMs) of Drosophila melanogaster. We find that IFM myoblast-myotube fusion proceeds in a stepwise fashion and is governed by apparent cross talk between transmembrane and cytoskeletal elements. Our analysis suggests that cell adhesion is necessary for bringing myoblasts to within a minimal distance from the myotubes. The branched actin polymerization machinery acts subsequently to promote tight apposition between the surfaces of the two cell types and formation of multiple sites of cell-cell contact, giving rise to nascent fusion pores whose expansion establishes full cytoplasmic continuity. Given the conserved features of IFM myogenesis, this sequence of cell interactions and membrane events and the mechanistic significance of cell adhesion elements and the actin-based cytoskeleton are likely to represent general principles of the myoblast fusion process.


Figures

Figure 1.
Figure 1.
FIB/SEM visualization reveals an extensive flat interface between DLM myotubes and associated myoblasts. (A) Schematics of an early pupa (left) and an adult fly (right) illustrating the position and relative size of the IFMs. A swarm of wing disc–derived myoblasts (green) fuses with a set of three persistent larval muscles in each pupal hemithorax, which go on to split and mature into a set of six DLMs. (B) A set of six nascent DLMs (asterisks) at 20 h APF visualized using mef2-GAL4>UAS-mCD8-GFP (green). DAPI-stained nuclei (blue) fill the syncytial muscles and also mark the positions of the mononucleated myoblasts (m) surrounding the muscle fibers. (C) Low magnification TEM of DLMs at 20 h APF. Mononucleated myoblasts (MBs) surround a syncytial myotube (MT). (D–D”) Reconstruction of a FIB/SEM dataset (see Video 1) of a DLM myotube and associated myoblasts. D displays the semitransparent myotube (green) and neighboring myoblasts (individually colored), whereas D’ shows the same view of the myoblasts alone, where the flattened surfaces of the myoblasts are readily apparent. D” displays the same cells as in D, at the same magnification, but from a different (tilted) angle, revealing a single myoblast (red, marked by an asterisk, and shown on its own in the inset) extending protrusions toward the myotube. (E and E’) Low (E) and high (E’) magnification views of the interface between a DLM myotube (MT) and an associated myoblast (MB), prepared for TEM using the hybrid CF and HPF/FS protocol (see Materials and methods section TEM), which allows for high quality preservation of smooth cell membranes and a rich cytoplasm. n, nucleus. Bars: (B) 20 µm; (C and D”) 10 µm; and (E and E’) 500 nm.
Figure 2.
Figure 2.
DLM myotube–myoblast association and contact involves several distinct configurations. (A–D) WT DLMs. Views of myotube (MT)–myoblast (MB) interfaces before (A and B) and after (C and D) formation of contact sites (yellow asterisks). n, nucleus. Contact site formation appears to be associated with tighter apposition of the cells. B and D include a color-coded heat map of the distances between neighboring membranes (see Materials and methods section Cell surface distance analysis). Membrane-associated electron-dense plaques, reminiscent of a structure observed in Drosophila embryonic preparations (Doberstein et al., 1997), are occasionally observed (arrowheads in A, but their association with contact sites is not clear. (E–G) DLMs after simultaneous knockdown of the adhesion elements Sns and Hbs (mef2-GAL4>UAS-sns-i,UAS-hbs-i). (E) A low magnification view demonstrates the resulting fusion arrest phenotype with myoblasts congregating around thin myotubes (MT). (F and G) High magnification views reveal the relatively wide gap between myotubes and neighboring myoblasts, which do not flatten their apposed surface. (H) Bar graph showing the distribution of myotube–myoblast intermembrane distances (see Materials and methods section Cell surface distance analysis). n, number of cells analyzed in single TEM sections. A distance distribution profile in which most (50–70%) membrane separations are of intermediate value (22–50 nm; mean distance = 27.2 ± 15.5 nm) is observed in WT DLM preparations where the cells do not make contact (left bar). The profile is clearly biased toward smaller distances (0–22 nm; mean distance = 15.0 ± 4.7 nm) for WT cell pairs that are in contact with each other (middle bar) and toward larger distances (>50 nm; mean distance = 65.4 ± 33.0 nm) in adhesion-defective (sns + hbs RNAi) DLM preparations (right bar). Bars: (A, B, D, and G) 500 nm; (C and F) 200 nm; and (E) 10 µm.
Figure 3.
Figure 3.
Branched actin polymerization and Sing are necessary for tight apposition and contact between DLM myotubes and associated myoblasts. (A–B’) DLM preparations from WT pupae. A low magnification view (A) shows myoblasts (MBs) surrounding a multinucleated myotube (MT), and high magnification panels show myotube–myoblast interfaces before (B) and after (B’) establishment of contacts (asterisks). n, nucleus. (C–J) DLM preparations from knockdown and mutant pupae, including mef2-GAL4>UASArp2-i (C and D), mef2-GAL4>UASkette-i (E and F), wsp1/Df(3R)3450 (G and H), and mef2-GAL4>UASsing-i (I and J) pupae. Low magnification views (C, E, G, and I) reveal fusion arrest in all cases, with myoblasts congregating around a thin myotube containing few nuclei. Elongated myoblasts sending projections toward the myotube (arrows) are observed in kette knockdown (E), WASp mutant (G), and sing knockdown (I) pupae. High magnification views (D, F, H, and J) demonstrate incomplete apposition and lack of contacts between myoblast and myotube plasma membranes, similar to the WT panel (B). While kette knockdown (E), WASp mutant (H), and sing knockdown myoblasts (J) flatten their apposed surfaces, Arp2 (D) myoblasts fail to do so. (K) Bar graph showing the frequency of contact sites along apposed myotube–myoblast surfaces in different genetic backgrounds. The number of cell pairs examined and the total length of membrane surveyed for contact sites in the different genotypes were as follows. WT: 50 cell pairs, ∼200 µm; sns + hbs knockdown: 13 cell pairs, ∼20 µm; Arp2 knockdown: 18 cell pairs, ∼50 µm; WASp mutant: 21 cell pairs, ∼100 µm; kette knockdown: 14 cell pairs, ∼50 µm; and sing knockdown: 22 cell pairs, ∼100 µm. (L) Bar graph showing the distribution of myotube–myoblast intermembrane distances in different genetic backgrounds generated as in Fig. 2 H. n, number of cells analyzed in single TEM sections. WT bars are the same as in Fig. 2 H. Preparations in which the function of branched actin elements or Sing is compromised (four right bars) all display a distance distribution profile in which most (50–70%) membrane separations are of intermediate value (22–50 nm). A similar profile is characteristic of WT DLM preparations where the cells do not make contact (left bar), whereas establishment of contacts between WT cell pairs (second bar from left) is associated with a shift toward smaller distances (0–22 nm) and tight apposition. (M) Bar graph comparing the mean length of myoblast surface membrane apposed to a neighboring myotube in different genetic backgrounds. n, number of myoblast–myotube pairs analyzed. Standard deviation of the measurement range is shown. Asterisks mark bars that are distinct from the WT value in a statistically significant fashion (analysis of variance, F(6,56) = 3.79, P = 0.003). Longer appositions, matching a flattened appearance, are characteristic of both classes of WT myoblasts as well as WASp mutant (Dunnett’s test, P = 0.99), kette knockdown (P = 0.56), and sing knockdown myoblasts (P = 0.96) but are not achieved after knockdown of sns-hbs (P = 0.020), Arp2 (P = 0.011), or ELMO (P = 0.005). Bars: (A, E, G, and I) 2 µm; (B, B’, D, F, H, and J) 200 nm; (C) 5 µm.
Figure 4.
Figure 4.
Protrusive extensions are a shared feature of WASp mutant and sing knockdown myoblasts. (A) Reconstruction of a FIB/SEM dataset of DLM myotube-associated myoblasts from a WASp mutant pupa (see Video 2). A sizable portion of the mutant myoblasts display extensions, mostly oriented toward the myotube, which occupies the center of the panel and was left out of the image for clarity. (B and B') TEM section of WASp mutant DLMs, demonstrating typical myoblast (MB) fusion arrest phenotypes that include an abnormally elongated morphology and finger-shaped extensions (rectangle in B, magnified and false-colored purple in B’), which protrude into the neighboring myotube (MT). The myotube and myoblast surfaces maintain separation along the extensions, and no signs of contact between the cells are apparent. (C and D) TEM sections of kette (C) and sing knockdown DLMs, demonstrating the WASp mutant-like finger-shaped protrusions that myoblasts (MB) often extend toward the myotube (MT) in these mutant backgrounds. No signs of contact between the cells or of tight apposition are apparent along the extensions. (E) Quantification of the frequency and dimensions of surface protrusions in different genetic backgrounds. Although protrusions are a common feature of the myotube-associated myoblasts in WASp mutant, kette knockdown, and sing knockdown DLMs, they are rarely observed in WT, sns-hbs, Arp2, or Ced-12/ELMO knockdown DLMs. Protrusion dimensions are similar in the different backgrounds. Lengths are shorter than those computed from the FIB reconstructions, as sections do not capture the entire structure. (F) Bar graph showing the distribution of myotube–myoblast intermembrane distances along myoblast protrusions in different genetic backgrounds, generated as in Fig. 2 H. n, number of individual protrusions analyzed in single TEM sections. Surface-membrane separation profiles along the protrusions on WASp mutant, kette knockdown, and sing knockdown DLMs match those observed for the flat portions of the myoblast surface in these backgrounds (Fig. 3 L). Bars: (A) 2 µm; (B’, C, and D) 200 nm; (B) 1 µm.
Figure 5.
Figure 5.
Multiple contact sites and nascent fusion pores form between tightly apposed myotube and myoblast surfaces. (A–C’). Three examples of paired and tightly apposed myotube (MT)–myoblast (MB) surface membranes displaying points of contact. Primed panels represent high magnification views of regions in left panels. Yellow asterisks mark the X-shaped configuration, where both membranes remain intact, whereas red asterisks mark blurred interfaces bordered by membrane loops, presumably representing nascent fusion pores. (D and D’) Myotube–myoblast interface displaying small fusion pores (red arrowheads). (D’) Cytoplasmic continuity can be recognized by apparent flow of dark, round ribosomes through the pores. (E) Tomogram 3D reconstruction of a myotube–myoblast interface displaying multiple cell–cell contacts (green) and small pores (yellow). Membranes are colored pink. STEM was performed on 350–400-nm-thick sections. Also see Video 3. (F and F’). Tomogram 3D reconstruction of a single pore, viewed from two different angles. Also see Video 4. Bars: (A, A’, B, B’, and C’) 100 nm; (C and D) 500 nm; (D’ and E) 200 nm; (F and F’) 25 nm.
Figure 6.
Figure 6.
Fusion pore expansion leads to cytoplasmic continuity between fusing myoblasts and myotubes. (A and A’). Myotube (MT)–myoblast (MB) interface displaying expanded fusion pores (red arrowheads). A’ is a higher magnification view of a portion of A. Cytoplasmic continuity is clearly discernible, and paired membranes between pores form an expanded enclosure. (B) Myotube–myoblast pair at an advanced phase of fusion. The cytoplasm is uniform in appearance, and the cell–cell interface appears as a series of vesicle-like structures (red arrowheads). n, nucleus. Bars: (A and B) 500 nm; (A’) 200 nm.
Figure 7.
Figure 7.
Model for progress of IFM myoblast fusion. (I) Wing disc–derived myoblasts (green) migrate toward the nascent DLM myotubes (red) and congregate in their vicinity at a distance of 50 nm or more. (II) An initial phase of myoblast–myotube apposition is mediated by cell adhesion elements such as the myoblast cell surface protein Sns. Cell surfaces are positioned 20–50 nm from each other. (III) A branched actin–dependent cell shape change, also involving ELMO, flattens the myoblast surface. (IV) A second branched actin–based process, dependent on the activity of the NPFs WASp and SCAR/WAVE, as well as on the membrane protein Sing, brings the cells in close apposition (<10 nm). This tight association allows for the formation of multiple cell–cell contacts, which serve as sites for initiation of nascent fusion pores. (V and VI) The surface membranes merge and vesiculate as the pores expand, so that eventually full cytoplasmic continuity is obtained, and the myoblast is incorporated into the DLM myotube.

References

    1. Abmayr S.M., and Pavlath G.K.. 2012. Myoblast fusion: lessons from flies and mice. Development. 139:641–656. 10.1242/dev.068353 - DOI - PMC - PubMed
    1. Aguilar P.S., Baylies M.K., Fleissner A., Helming L., Inoue N., Podbilewicz B., Wang H., and Wong M.. 2013. Genetic basis of cell-cell fusion mechanisms. Trends Genet. 29:427–437. 10.1016/j.tig.2013.01.011 - DOI - PMC - PubMed
    1. Aoyama K., Takagi T., Hirase A., and Miyazawa A.. 2008. STEM tomography for thick biological specimens. Ultramicroscopy. 109:70–80. 10.1016/j.ultramic.2008.08.005 - DOI - PubMed
    1. Bennett A.E., Narayan K., Shi D., Hartnell L.M., Gousset K., He H., Lowekamp B.C., Yoo T.S., Bliss D., Freed E.O., and Subramaniam S.. 2009. Ion-abrasion scanning electron microscopy reveals surface-connected tubular conduits in HIV-infected macrophages. PLoS Pathog. 5:e1000591 10.1371/journal.ppat.1000591 - DOI - PMC - PubMed
    1. Ben-Yaacov S., Le Borgne R., Abramson I., Schweisguth F., and Schejter E.D.. 2001. Wasp, the Drosophila Wiskott-Aldrich syndrome gene homologue, is required for cell fate decisions mediated by Notch signaling. J. Cell Biol. 152:1–13. 10.1083/jcb.152.1.1 - DOI - PMC - PubMed

Publication types

LinkOut - more resources