. 2015 Oct 12;36(1):13-29.
doi: 10.1128/MCB.00641-15. Print 2016 Jan 1.

β-Catenin Upregulates the Constitutive and Virus-Induced Transcriptional Capacity of the Interferon Beta Promoter through T-Cell Factor Binding Sites

Affiliations

β-Catenin Upregulates the Constitutive and Virus-Induced Transcriptional Capacity of the Interferon Beta Promoter through T-Cell Factor Binding Sites

Vasco Marcato et al. Mol Cell Biol. .

Abstract

Rapid upregulation of interferon beta (IFN-β) expression following virus infection is essential to set up an efficient innate antiviral response. Biological roles related to the antiviral and immune response have also been associated with the constitutive production of IFN-β in naive cells. However, the mechanisms capable of modulating constitutive IFN-β expression in the absence of infection remain largely unknown. In this work, we demonstrate that inhibition of the kinase glycogen synthase kinase 3 (GSK-3) leads to the upregulation of the constitutive level of IFN-β expression in noninfected cells, provided that GSK-3 inhibition is correlated with the binding of β-catenin to the IFN-β promoter. Under these conditions, IFN-β expression occurred through the T-cell factor (TCF) binding sites present on the IFN-β promoter independently of interferon regulatory factor 3 (IRF3). Enhancement of the constitutive level of IFN-β per se was able to confer an efficient antiviral state to naive cells and acted in synergy with virus infection to stimulate virus-induced IFN-β expression. Further emphasizing the role of β-catenin in the innate antiviral response, we show here that highly pathogenic Rift Valley fever virus (RVFV) targets the Wnt/β-catenin pathway and the formation of active TCF/β-catenin complexes at the transcriptional and protein level in RVFV-infected cells and mice.


Figures

FIG 1
FIG 1
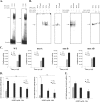
LiCl treatment enhances constitutive and virus-induced IFN-β expression. (A) Schematic representation of the general organization of the murine IFN-β promoter showing negative regulatory domain I (NRDI) and NRDII as well as the virus-responsive element (VRE). (B, C, and H) Immunolocalization of β-catenin in L929 cells. Cells were either not treated (NT), treated with 20 mM LiCl (LiCl) for 24 h, or infected with NDV that had been labeled with an anti-β-catenin antibody (a, d, g, and j) and a DNA intercalating agent to visualize the nucleus (ToPro3) (b, e, h, and k). Nuclei are outlined in the merged images, and the total green pixel intensity corresponding to β-catenin labeling in the nucleus was quantified (C). NI, noninfected. Bars = 10 μm. (D) The β-catenin in nuclear extracts from L929 cells that were either not treated or treated with 20 mM LiCl for 24 h was analyzed by Western blotting. (E, F, G, and I) IFN-β mRNA (E and I) and Oas1b or IRF7 mRNA (F) in noninfected L929 cells that were either not treated or LiCl treated (E to G) and at different times postinfection in L929 cells mock or NDV infected and either not treated or pretreated with LiCl (I) were analyzed by RT-qPCR. In panels E to G, the corresponding fold levels of induction with respect to the levels of induction for nontreated cells were calculated; in panel I, the corresponding fold levels of induction with respect to the levels of induction for noninfected and nontreated cells were calculated. Data are for 33 (minimum) to 71 (maximum) nuclei that were counted (C), 42 biological replicates from 13 independent experiments (E), 18 biological replicates from 6 independent experiments (F), and 6 biological replicates (I). P values, determined by the Student test, were less than 0.001 (***), 0.01 (**), and 0.05 (*). The results in all panels correspond to those for one confocal section.
FIG 2
FIG 2
LiCl enhancement of IFN-β expression is mediated by β-catenin. (A to D) AML12 cells were either not treated (NT) or treated with 20 mM LiCl (LiCl) for 24 h and either noninfected (A to C) or NDV infected (D). (A and B) Cells were labeled with an anti-β-catenin antibody (a and d) and a DNA intercalating agent to visualize the nucleus (ToPro3) (b and e). Nuclei are outlined in the merged images (c and f) (A), and the total green pixel intensity corresponding to β-catenin labeling in the nucleus was quantified (B). Bar = 10 μm. (C and D) IFN-β mRNA in noninfected (C) and NDV-infected (6 h p.i.) (D) cells that were either not treated or pretreated with LiCl was analyzed by RT-qPCR. The corresponding fold levels of induction with respect to the levels of induction for nontreated (C) or noninfected and nontreated (D) cells were calculated. (E to G) L929 cells were either mock transfected (mock) or transfected with β-catenin-specific siRNA (siβcat) or control siRNA (siCtrl) for 72 h. β-Catenin (β-cat) mRNA (E) and protein (F) levels were analyzed by RT-qPCR and Western blotting (WB), respectively. (G) After transfection of siRNA, cells were either not treated or treated with 20 mM LiCl for 24 h before being infected with NDV. IFN-β mRNA was analyzed by RT-qPCR. (E and G) The corresponding fold levels of induction with respect to the levels of induction for mock-transfected, nontreated, and NDV-infected cells (n = 3) were calculated. P values, determined by the Student test, were less than 0.001 (***) and 0.01 (**) or were nonsignificant (NS). All images correspond to one confocal section.
FIG 3
FIG 3
Interaction of β-catenin with the IFN-β promoter region containing a TCF binding site is necessary for LiCl enhancement of IFN-β promoter activity. (A) Schematic representation of the WT330 and WT110 murine IFN-β promoters fused to the CAT reporter gene and integrated into the genomes of the L929 WT330 and L929 WT110 cell lines, respectively. (B to D) β-Catenin binding to the WT330 and WT110 promoters and the corresponding CAT activities in L929 cells with the WT330 and WT110 promoters that were either not treated (NT) or treated with 20 mM LiCl (LiCl) were analyzed. (B) Genomic DNA was collected at 24 h after LiCl treatment and immunoprecipitated with anti β-catenin (α-β-cat) or anti-NSs (α-NSs; negative control) antibodies. Increasing amounts (in microliters) of immunoprecipitated DNA (IP) as well as nonimmunoprecipitated genomic DNA (Input) were amplified by semiquantitative PCR using primers specific for the WT330 and WT110 integrated promoters. (C) Cells were collected after LiCl treatment, and their CAT activities were quantified. The corresponding fold levels of induction with respect to the levels of induction for nontreated cells (n = 12 cells for cells with the WT330 promoter and n = 6 cells for cells with the WT110 promoter) were calculated. (D) After LiCl treatment, the cells were further mock or NDV infected and collected at different times postinfection, and the corresponding CAT activities were quantified. The corresponding fold levels of induction with respect to the levels of induction for noninfected nontreated cells (n = 4) were calculated. (E and F) CAT activities of L929 cells that were either not treated or treated with 50 μM SB216763 (E) or 30 μm inhibitor IX (F) for 24 h. Cells were further mock or NDV infected and collected at 8 h postinfection, and the corresponding CAT activities were quantified. The corresponding fold levels of induction with respect to the levels of induction for noninfected nontreated cells were calculated.
FIG 4
FIG 4
TCF binding sites mediate LiCl-dependent activation of the IFN-β promoter. (A and B) Equal amounts of nuclear extracts (N.E) prepared from L929 cells that were either not treated (−LiCl) or treated with 20 mM LiCl (+LiCl) for 24 h were incubated with the radioactively labeled probes corresponding to wild-type TCFa (TCFA) and TCFb (TCFB) or the mutated TCFa (TCFmutA) and TCFb (TCFmutB) sites. When indicated, nuclear extracts were incubated with 500 ng of poly(dI-dC) or anti-β-catenin antibodies before adding the probes. (C) L929 cells transfected with plasmids containing the luciferase reporter gene under the control of either the wild-type (WT) IFN-β promoter or the IFN-β promoter mutated at the TCFa site (mutA), the TCFb site (mutB), or the TCFa and TCFb sites (mutAB) were either not treated (NT) or pretreated with LiCl (LiCl) before infection with NDV. Cells were collected at 7 h p.i., and the luminescence was quantified (n = 3 experiments). (D and E) L929 cells were either not treated or treated with 20 mM LiCl for 24 h or 48 h in the presence or absence of iCRT3 before being infected with NDV. IFN-β (D) or cyclin D1 (E) mRNA was analyzed by RT-qPCR, and the corresponding fold levels of induction with respect to the levels of induction for nontreated NDV-infected (D) or noninfected (E) cells were calculated. (D) Data are means ± SDs from 3 experiments. P values, determined by the Student test, were less than 0.01 (**) or 0.05 (*) or were nonsignificant (NS).
FIG 5
FIG 5
LiCl treatment confers an antiviral state. Monolayers of L929 cells that were either not treated (NT) or pretreated with 20 mM LiCl for 24 h (LiCl) were infected with VSV. (A) The cytopathic effect induced by increasing MOIs of VSV was assayed by crystal violet dye staining 24 h after infection. (B) Photographs of typical culture fields. (C and D) Cells were fixed 8 h after infection (MOI = 1) and labeled with an antibody directed against the N protein of VSV (gray) and ToPro3 (blue); merged images of the corresponding culture fields are displayed (C). The percentage of infected cells, determined by the presence of N protein encoded by the VSV genome (fluorescence displayed in gray), was determined from a total of 7,876 nontreated and 9,024 LiCl-treated cells (D). The data in panel D are means ± SDs from 4 experiments.
FIG 6
FIG 6
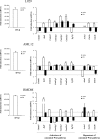
Infection with RVFV affects the Wnt/β-catenin pathway at the transcriptional level. The expression of genes associated with the Wnt/β-catenin pathway, previously identified to interact with the NSs protein of RVFV (listed in Table 2), was measured in three different cell types corresponding to fibroblasts (L929 cells), hepatocytes (AML12 cells), and BMDM either mock infected or infected with strain ZH or ΔNSs. RNAs purified from mock- or virus-infected cells (8 h p.i.) were analyzed by RT-qPCR with primers specific for each gene of interest. The change in the level of gene expression in strain ZH- and ΔNSs-infected cells with respect to that in mock-infected cells was calculated. Horizontal lines, cutoff values for upregulation (+1.5-fold) and downregulation (−1.5-fold). The effect of virus infection upon the expression of genes coding for WNT ligands as well as for antagonists of Wnt signaling (Apcdd1, Dkk1, and Kremen2) could not be tested since the corresponding mRNA remained undetectable in the three cell types analyzed here. Data are means ± SDs from ≥3 experiments for each cell line.
FIG 7
FIG 7
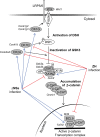
Nonpathogenic and pathogenic strains of RVFV have opposite effects on the Wnt/β-catenin pathway. Genes that participate in the Wnt/β-catenin pathway and whose promoter regions were identified to significantly interact with the RVFV NSs protein during chromatin immunoprecipitation-on-chip experiments, listed in Table 2, are shown in gray. Genes whose levels of expression were affected after infection with either the nonpathogenic ΔNSs strain or the pathogenic ZH strain of RVFV with respect to their levels of expression by mock-infected cells are indicated by blue (upregulated) and red (downregulated) arrows.
FIG 8
FIG 8
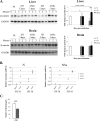
Physiological relevance of β-catenin protein level during RVFV infection. (A and B) β-Catenin protein and viral N and NSs RNA levels in the livers and brains of noninfected (NI) mice or at days 3 and 5 p.i. in the livers and brains of mice infected with strain ZH or ΔNSs were evaluated. (A) The β-catenin protein level was analyzed by Western blotting and estimated densitometrically by comparison with the band intensity of GAPDH (glyceraldehyde-3-phosphate dehydrogenase); values were averaged from independent samples per time point for 3 mice (for samples from noninfected mice), 6 mice (for samples obtained at 3 days p.i. from mice infected with strain ZH and samples obtained at 3 and 5 days p.i. from mice infected with strain ΔNSs), and 4 mice (for samples obtained at 5 days p.i. for mice infected with strain ZH). The fold induction was calculated by comparison of the β-catenin level in samples from infected mice versus that in samples from noninfected mice. (B) The relative levels of viral N and NSs mRNA were estimated by comparison with the levels of expression of three reference genes (Ppib, Hprt1, and Utp6c). 3d and 5d, days 3 and 5, respectively. (C) Number of lytic plaques formed in monolayers of L929 cells that were either not treated (white bar) or pretreated with 20 mM LiCl for 24 h (filled bar) and infected with RVFV ZH548. Cells were fixed and stained with crystal violet at 3 days p.i. (n = 4). P values, determined by the Student test, were less than 0.001 (***), 0.01 (**), and 0.05 (*). The results in all panels correspond to those for one confocal section.

Similar articles

Cited by

References

    1. Stark GR, Kerr IM, Williams BR, Silverman RH, Schreiber RD. 1998. How cells respond to interferons. Annu Rev Biochem 67:227–264. doi:10.1146/annurev.biochem.67.1.227. - DOI - PubMed
    1. Stetson DB, Medzhitov R. 2006. Type I interferons in host defense. Immunity 25:373–381. doi:10.1016/j.immuni.2006.08.007. - DOI - PubMed
    1. Jensen S, Thomsen AR. 2012. Sensing of RNA viruses: a review of innate immune receptors involved in recognizing RNA virus invasion. J Virol 86:2900–2910. doi:10.1128/JVI.05738-11. - DOI - PMC - PubMed
    1. Randall RE, Goodbourn S. 2008. Interferons and viruses: an interplay between induction, signalling, antiviral responses and virus countermeasures. J Gen Virol 89:1–47. doi:10.1099/vir.0.83391-0. - DOI - PubMed
    1. Deonarain R, Alcamí A, Alexiou M, Dallman MJ, Gewert DR, Porter AC. 2000. Impaired antiviral response and alpha/beta interferon induction in mice lacking beta interferon. J Virol 74:3404–3409. doi:10.1128/JVI.74.7.3404-3409.2000. - DOI - PMC - PubMed

Publication types