

Years of potential life lost for brain and CNS tumors relative to other cancers in adults in the United States, 2010
- PMID: 26459813
- PMCID: PMC4677421
- DOI: 10.1093/neuonc/nov249
Years of potential life lost for brain and CNS tumors relative to other cancers in adults in the United States, 2010
Abstract
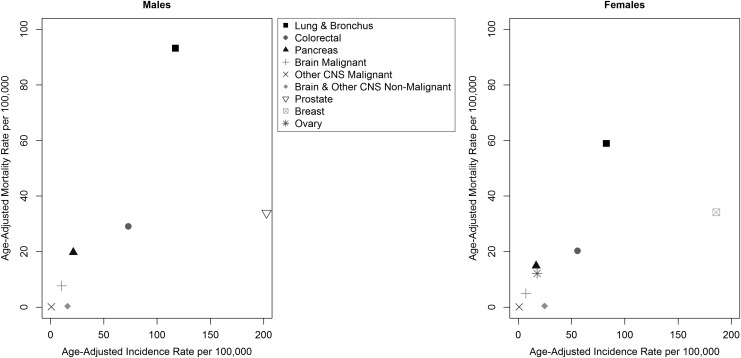
Background: Years of potential life lost (YPLL) complement incidence and survival rates by measuring how much a patient's life is likely to be shortened by his or her cancer. In this study, we examine the impact of death due to brain and other central nervous system (CNS) tumors compared to other common cancers in adults by investigating the YPLL of adults in the United States.
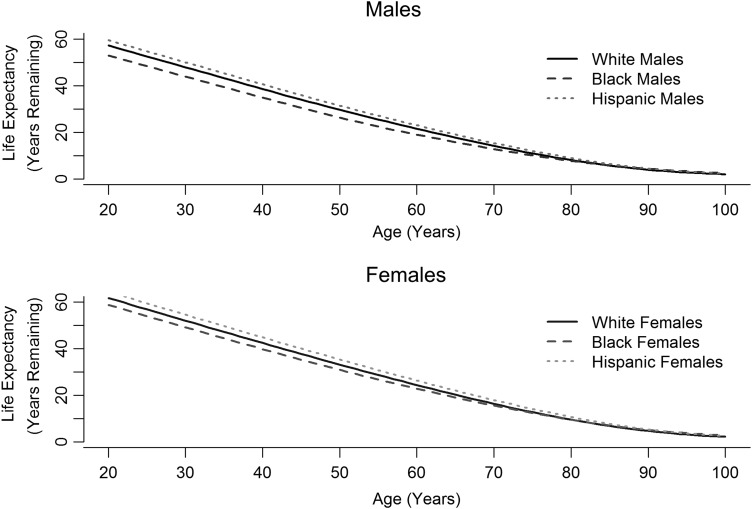
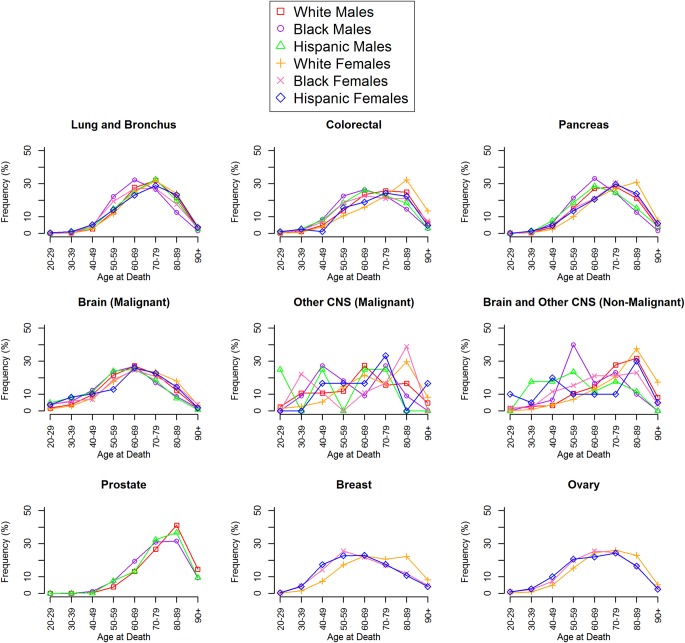
Methods: Mortality and life table data were obtained from the Centers for Disease Control and Prevention's National Center for Health Statistics Vital Statistics Data for 2010. The study population included individuals aged 20 years or older at death who died from one of the selected cancers. YPLL was calculated by taking an individual's age at death and finding the corresponding expected remaining years of life using life table data.
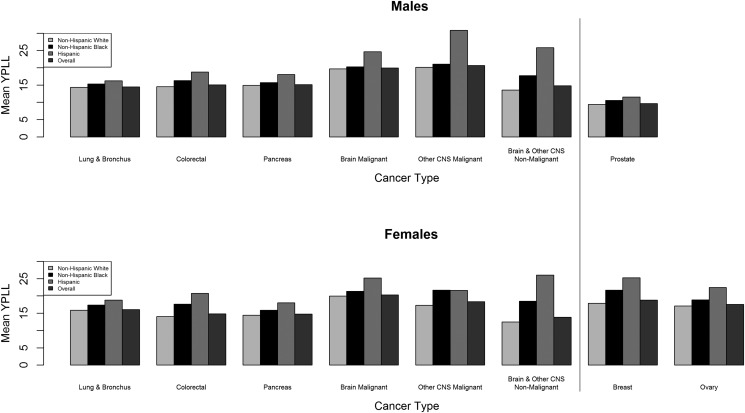
Results: The cancers with the greatest mean YPLL were other malignant CNS tumors (20.65), malignant brain tumors (19.93), and pancreatic cancer (15.13) for males and malignant brain tumors (20.31), breast cancer (18.78), and other malignant CNS tumors (18.36) for females. For both sexes, non-Hispanic whites had the lowest YPLL, followed by non-Hispanic blacks, and Hispanics.
Conclusion: Malignant brain and other CNS tumors have the greatest mean YPLL, thereby reflecting their short survival time post diagnosis. These findings will hopefully motivate more research into mitigating the impact of these debilitating tumors.
Keywords: CBTRUS; NCHS; central nervous system tumors; years of potential life lost.
© The Author(s) 2015. Published by Oxford University Press on behalf of the Society for Neuro-Oncology. All rights reserved. For permissions, please e-mail: journals.permissions@oup.com.
Figures
Comment in
-
Quantifying the burden of primary central nervous system malignancy.Neuro Oncol. 2016 Jan;18(1):5-6. doi: 10.1093/neuonc/nov287. Epub 2015 Nov 20. Neuro Oncol. 2016. PMID: 26590383 Free PMC article. No abstract available.
References
-
- Siegel R, Miller K, Jemal A. Cancer statistics, 2015. Ca Cancer J Clin. 2015;65(1):5–29. - PubMed
-
- Heron M. Deaths: leading causes for 2010. Natl Vital Stat Rep. 2013;62(6):1–96. - PubMed
-
- Gardner JW, Sanborn JS. Years of potential life lost (YPLL)—what does it measure? Epidemiology. 1990;1(4):322–329. - PubMed
Publication types
MeSH terms
Grants and funding
LinkOut - more resources
Full Text Sources
Other Literature Sources
Medical
