

Integrated ordination of miRNA and mRNA expression profiles
- PMID: 26459852
- PMCID: PMC4603994
- DOI: 10.1186/s12864-015-1971-9
Integrated ordination of miRNA and mRNA expression profiles
Abstract
Background: Several studies have investigated miRNA and mRNA co-expression to identify regulatory networks at the transcriptional level. A typical finding of these studies is the presence of both negative and positive miRNA-mRNA correlations. Negative correlations are consistent with the expected, faster degradation of target mRNAs, whereas positive correlations denote the existence of feed-forward regulations mediated by transcription factors. Both mechanisms have been characterized at the molecular level, although comprehensive methods to represent miRNA-mRNA correlations are lacking. At present, genome-wide studies are able to assess the expression of more than 1000 mature miRNAs and more than 35,000 well-characterized human genes. Even if studies are generally restricted to a small subset of genes differentially expressed in specific diseases or experimental conditions, the number of potential correlations remains very high, and needs robust multivariate methods to be conveniently summarized by a small set of data.
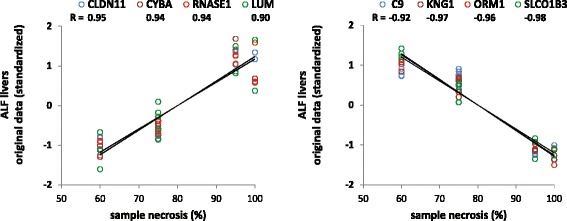
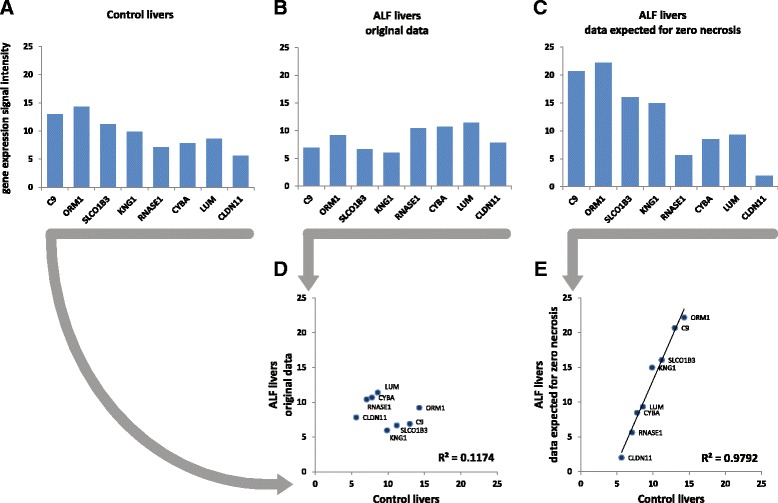
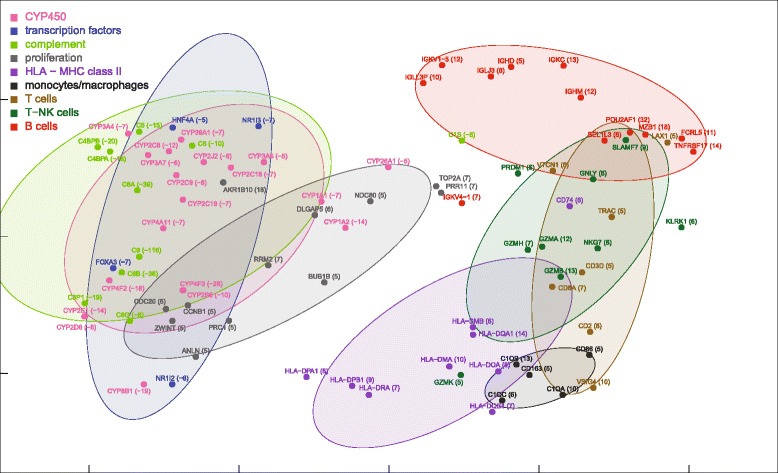
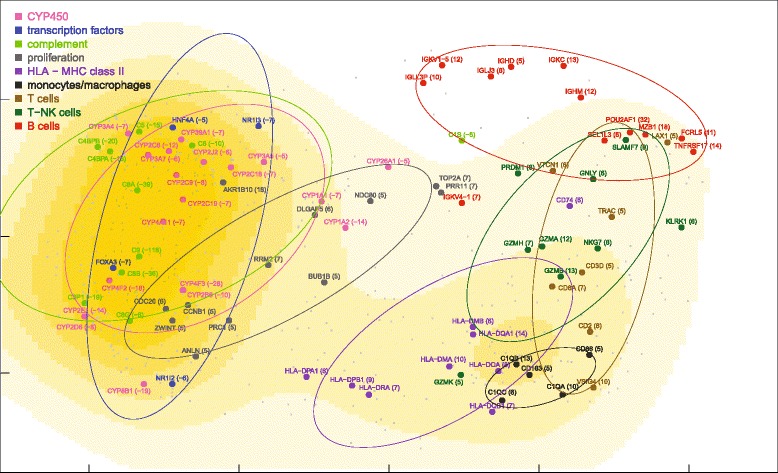
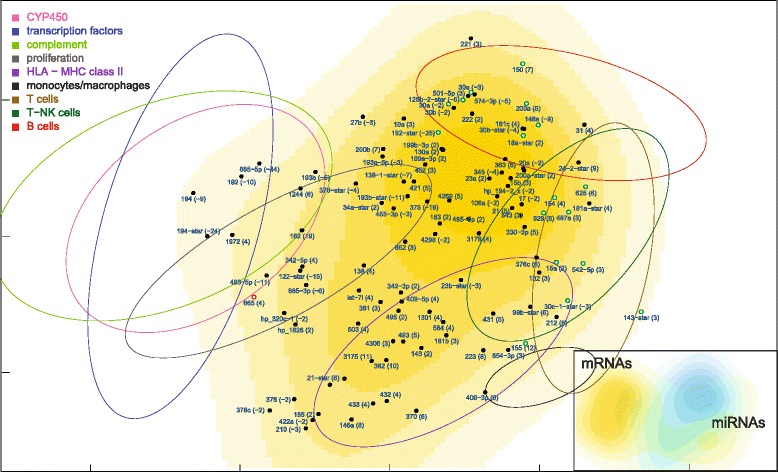
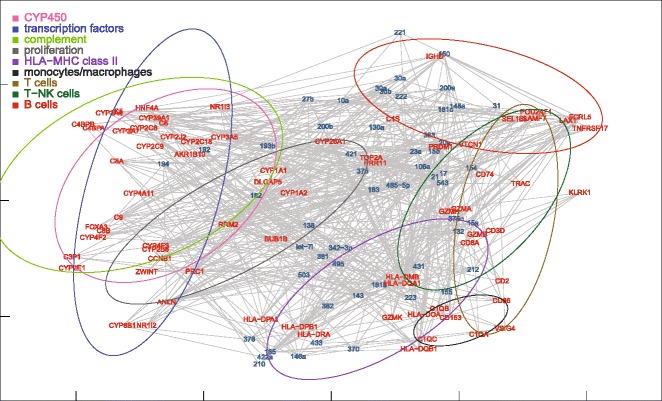
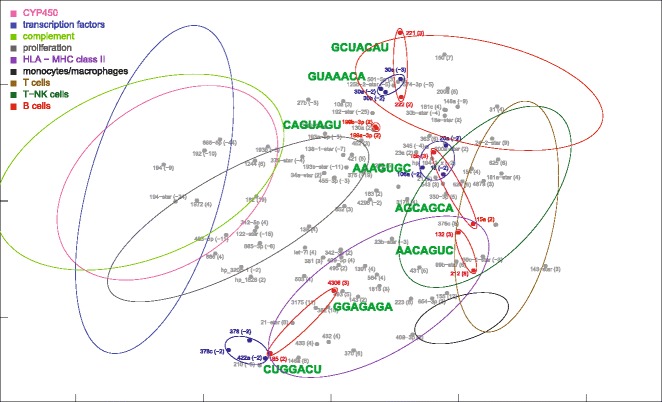
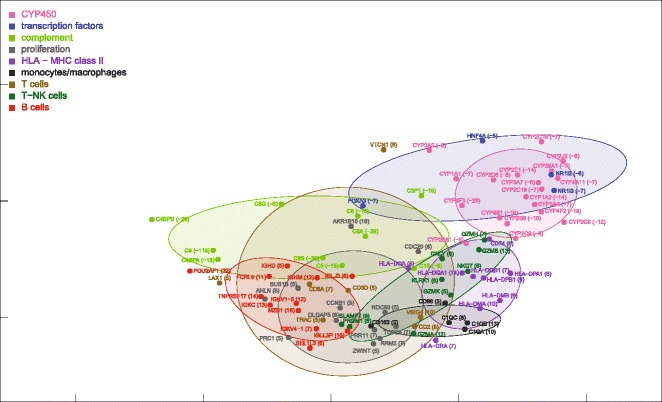
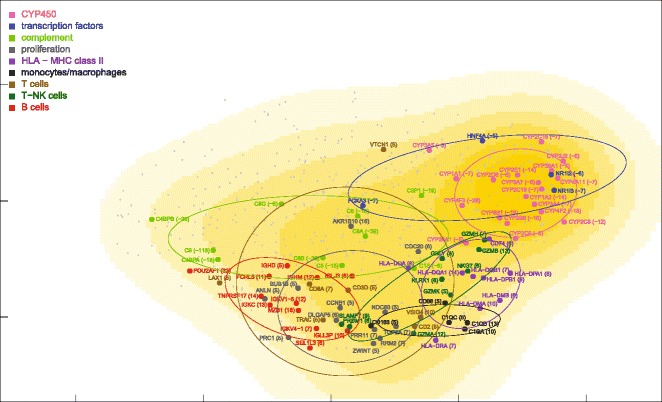
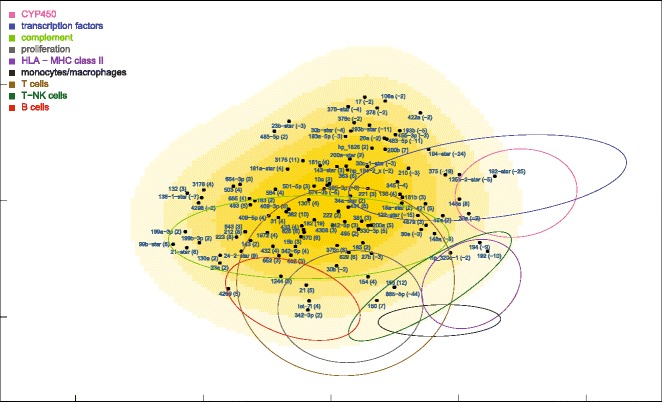
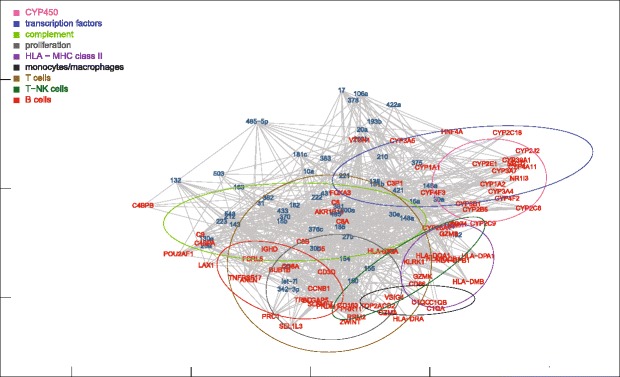
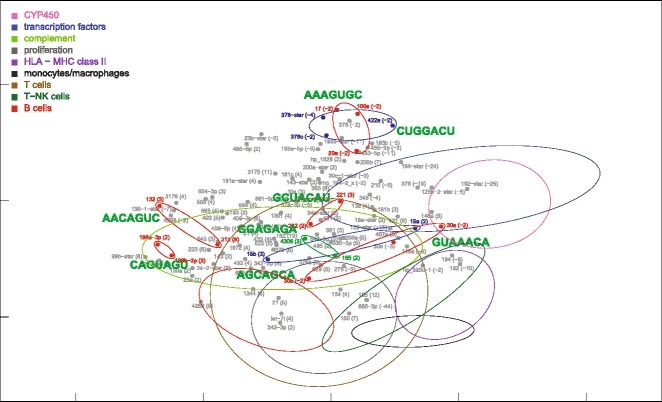
Results: Nonparametric Kendall correlations were calculated between miRNAs and mRNAs differentially expressed in livers of patients with acute liver failure (ALF) using normal livers as controls. Spurious correlations due to the histopathological composition of samples were removed by partial correlations. Correlations were then transformed into distances and processed by multidimensional scaling (MDS) to map the miRNA and mRNA relationships. These showed: (a) a prominent displacement of miRNA and mRNA clusters in ALF livers, as compared to control livers, indicative of gene expression dysregulation; (b) a clustering of mRNAs consistent with their functional annotations [CYP450, transcription factors, complement, proliferation, HLA class II, monocytes/macrophages, T cells, T-NK cells and B cells], as well as a clustering of miRNAs with the same seed sequence; and (c) a tendency of miRNAs and mRNAs to populate distinct regions of the MDS plot. MDS also allowed to visualize the network of miRNA-mRNA target pairs.
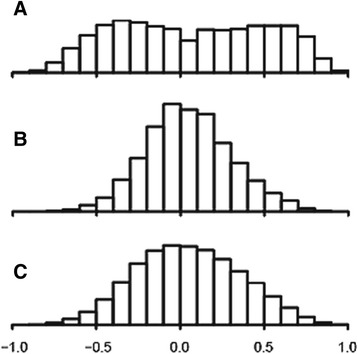
Conclusions: Different features of miRNA and mRNA relationships can be represented as thematic maps within the framework of MDS obtained from pairwise correlations. The symmetric distribution of positive and negative correlations between miRNA and mRNA expression suggests that miRNAs are involved in a complex bidirectional molecular network, including, but not limited to, the inhibitory regulation of miRNA targets.
Figures
Similar articles
-
Integrated analyses to reconstruct microRNA-mediated regulatory networks in mouse liver using high-throughput profiling.BMC Genomics. 2015;16 Suppl 2(Suppl 2):S12. doi: 10.1186/1471-2164-16-S2-S12. Epub 2015 Jan 21. BMC Genomics. 2015. PMID: 25707768 Free PMC article.
-
The RNA expression signature of the HepG2 cell line as determined by the integrated analysis of miRNA and mRNA expression profiles.Gene. 2014 Sep 10;548(1):91-100. doi: 10.1016/j.gene.2014.07.016. Epub 2014 Jul 9. Gene. 2014. PMID: 25014136
-
Computational identification of hepatitis C virus associated microRNA-mRNA regulatory modules in human livers.BMC Genomics. 2009 Aug 11;10:373. doi: 10.1186/1471-2164-10-373. BMC Genomics. 2009. PMID: 19671175 Free PMC article.
-
Machine Learning Techniques in Exploring MicroRNA Gene Discovery, Targets, and Functions.Methods Mol Biol. 2017;1617:211-224. doi: 10.1007/978-1-4939-7046-9_16. Methods Mol Biol. 2017. PMID: 28540688 Review.
-
miARma-Seq, a comprehensive pipeline for the simultaneous study and integration of miRNA and mRNA expression data.Methods. 2019 Jan 1;152:31-40. doi: 10.1016/j.ymeth.2018.09.002. Epub 2018 Sep 22. Methods. 2019. PMID: 30253202 Review.
Cited by
-
Nitric oxide-related gene and microRNA expression in peripheral blood in pregnancy vary by self-reported race.Epigenetics. 2022 Jun-Jul;17(7):731-745. doi: 10.1080/15592294.2021.1957576. Epub 2021 Jul 24. Epigenetics. 2022. PMID: 34308756 Free PMC article.
-
Identification and Analysis of BCAS4/hsa-miR-185-5p/SHISA7 Competing Endogenous RNA Axis in Late-Onset Alzheimer's Disease Using Bioinformatic and Experimental Approaches.Front Aging Neurosci. 2022 Feb 21;14:812169. doi: 10.3389/fnagi.2022.812169. eCollection 2022. Front Aging Neurosci. 2022. PMID: 35264942 Free PMC article.
-
Downregulation of miR-185 is a common pathogenic event in 22q11.2 deletion syndrome-related and idiopathic schizophrenia.Metab Brain Dis. 2022 Apr;37(4):1175-1184. doi: 10.1007/s11011-022-00918-5. Epub 2022 Jan 25. Metab Brain Dis. 2022. PMID: 35075501
-
Dysregulation of Muscle-Specific MicroRNAs as Common Pathogenic Feature Associated with Muscle Atrophy in ALS, SMA and SBMA: Evidence from Animal Models and Human Patients.Int J Mol Sci. 2021 May 26;22(11):5673. doi: 10.3390/ijms22115673. Int J Mol Sci. 2021. PMID: 34073630 Free PMC article.
-
Dysregulated Expression of Arterial MicroRNAs and Their Target Gene Networks in Temporal Arteries of Treatment-Naïve Patients with Giant Cell Arteritis.Int J Mol Sci. 2021 Jun 17;22(12):6520. doi: 10.3390/ijms22126520. Int J Mol Sci. 2021. PMID: 34204585 Free PMC article.
References
Publication types
MeSH terms
Substances
Grants and funding
LinkOut - more resources
Full Text Sources
Other Literature Sources
Molecular Biology Databases
Research Materials
Miscellaneous
