

Association between Glaucoma and At-fault Motor Vehicle Collision Involvement among Older Drivers: A Population-based Study
- PMID: 26459997
- PMCID: PMC4695303
- DOI: 10.1016/j.ophtha.2015.08.043
Association between Glaucoma and At-fault Motor Vehicle Collision Involvement among Older Drivers: A Population-based Study
Abstract
Objective: To examine the association between glaucoma and motor vehicle collision (MVC) involvement among older drivers, including the role of visual field impairment that may underlie any association found.
Design: A retrospective, population-based study.
Participants: A sample of 2000 licensed drivers aged ≥70 years who reside in north central Alabama.
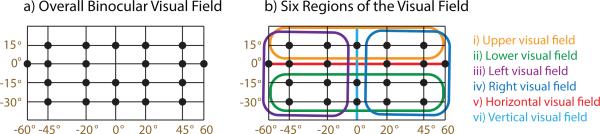
Methods: At-fault MVC involvement over the 5 years before enrollment was obtained from state records. Three aspects of visual function were measured: habitual binocular distance visual acuity, binocular contrast sensitivity (CS), and the binocular driving visual field constructed from combining the monocular visual fields of each eye. Poisson regression was used to calculate crude and adjusted rate ratios (RRs) and 95% confidence intervals (CIs).
Main outcomes measures: At-fault MVC involvement over the 5 years before enrollment.
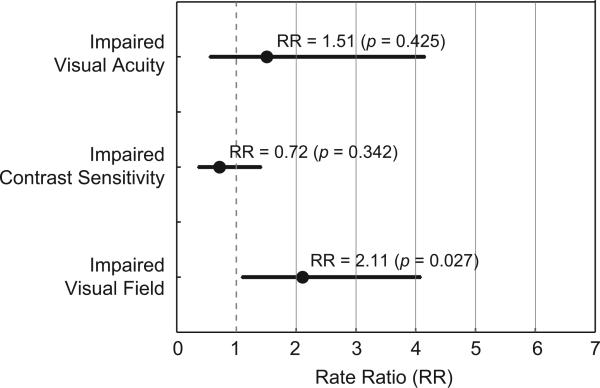
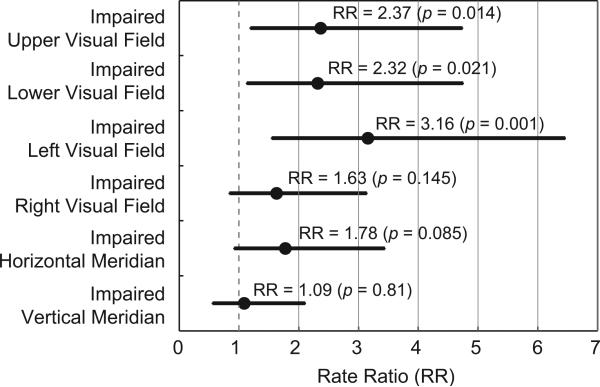
Results: Drivers with glaucoma (n = 206) had a 1.65 times higher MVC rate (95% CI, 1.20-2.28; P = 0.002) compared with those without glaucoma after adjusting for age, and mental status. Among those with glaucoma, drivers with severe visual field loss had higher MVC rates (RR, 2.11; 95% CI, 1.09-4.09; P = 0.027), whereas no association was found among those with impaired visual acuity and CS. When the visual field was subdivided into 6 regions (upper, lower, left, and right visual fields; horizontal and vertical meridians), we found that impairment in the left, upper, or lower visual field was associated with higher MVC rates, and an impaired left visual field showed the highest RR (3.16; P = 0.001) compared with other regions. However, no association was found in deficits in the right side or along the horizontal or vertical meridian.
Conclusions: A population-based study suggests that older drivers with glaucoma are more likely to have a history of at-fault MVC involvement than those without glaucoma. Impairment in the driving visual field in drivers with glaucoma seems to have an independent association with at-fault MVC involvement, whereas visual acuity and CS impairments do not.
Copyright © 2016 American Academy of Ophthalmology. Published by Elsevier Inc. All rights reserved.
Figures
References
-
- Jette AM, Branch LG. A ten-year follow-up of driving patterns among community-dwelling elderly. Hum Factors. 1992;34:25–31. - PubMed
-
- Naumann RB, Dellinger AM, Anderson ML, Bonomi AE, Rivara FP, Thompson RS. Preferred modes of travel among older adults: what factors affect the choice to walk instead of drive? J Safety Res. 2009;40:395–398. - PubMed
-
- Transportation USDo . Improving Transportation for a Maturing Society. Department of Transportation; Washington, DC: 1997.
-
- Charman W. Vision and driving: a literature review and commentary. Ophthalmic Physiol Opt. 1997;17:371–391. - PubMed
Publication types
MeSH terms
Grants and funding
LinkOut - more resources
Full Text Sources
Other Literature Sources
Medical
