. 2015 Oct 27;112(43):13312-7.
doi: 10.1073/pnas.1517724112. Epub 2015 Oct 12.

The HLA-G cycle provides for both NK tolerance and immunity at the maternal-fetal interface

Affiliations

The HLA-G cycle provides for both NK tolerance and immunity at the maternal-fetal interface

Tamara Tilburgs et al. Proc Natl Acad Sci U S A. .

Abstract

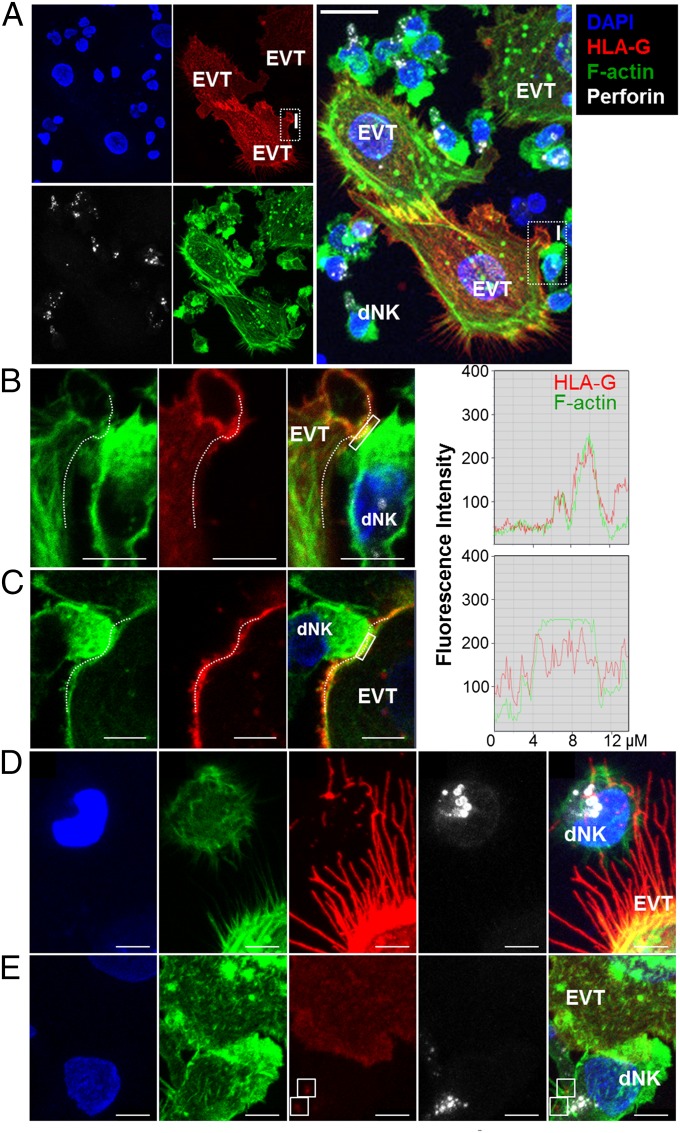
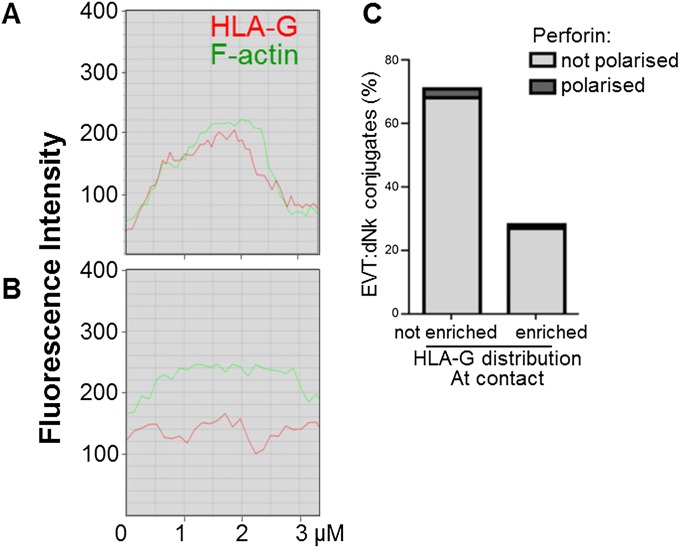
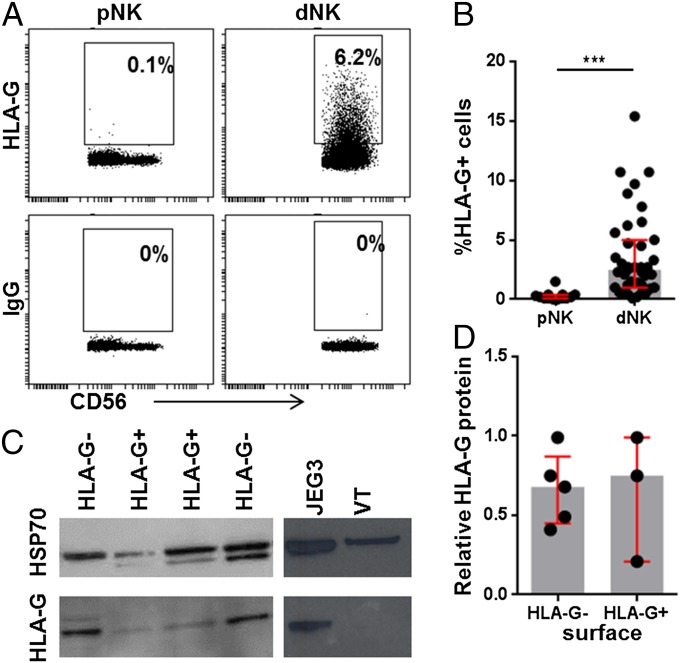
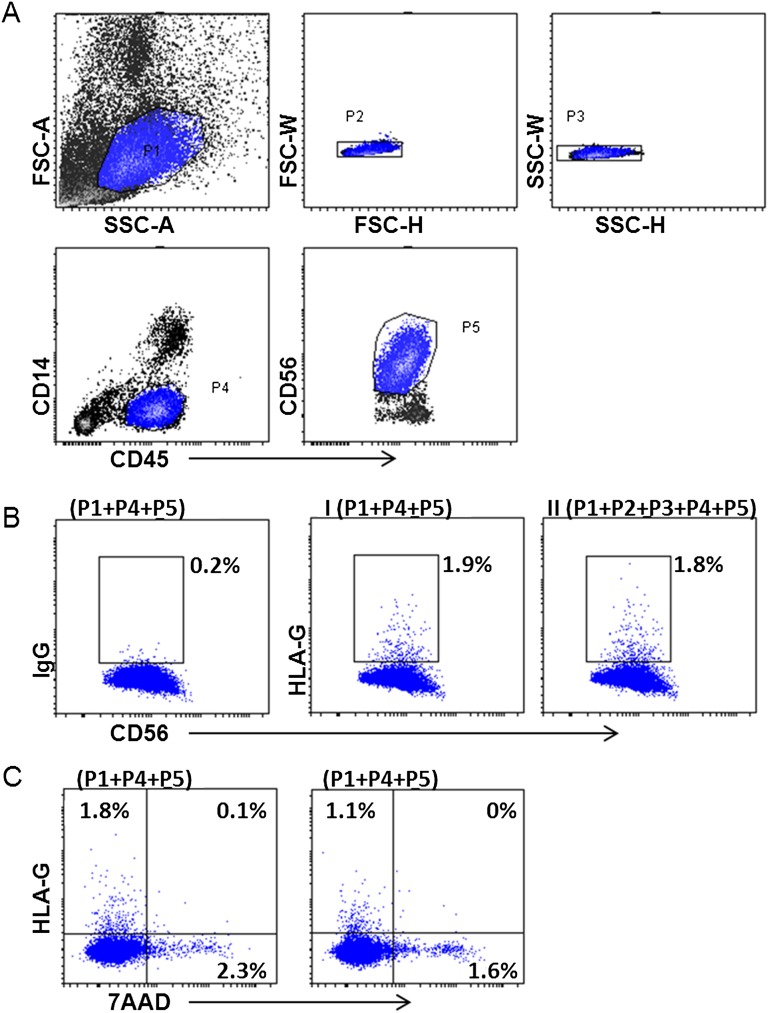
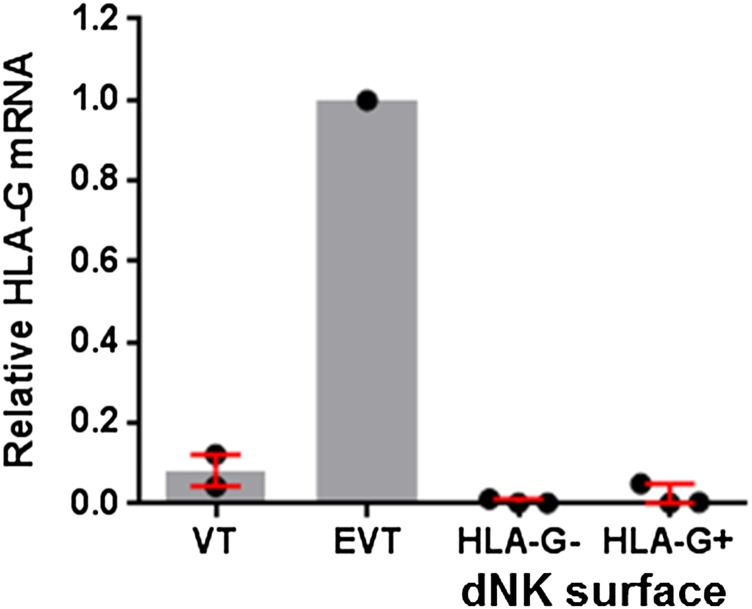
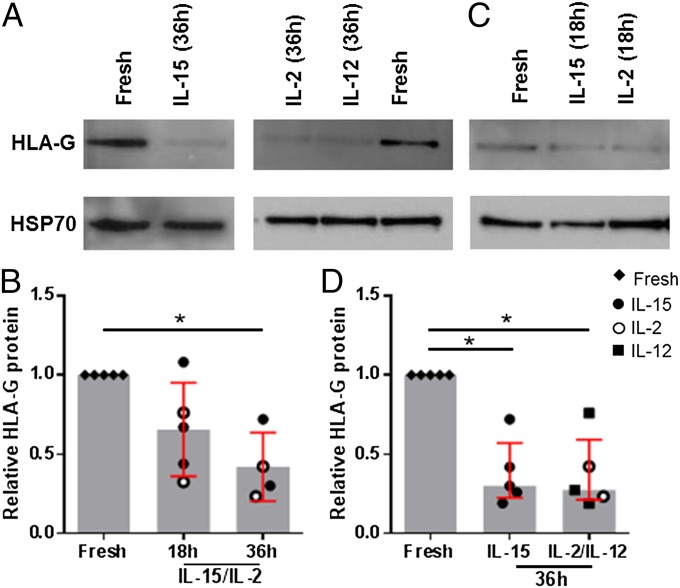
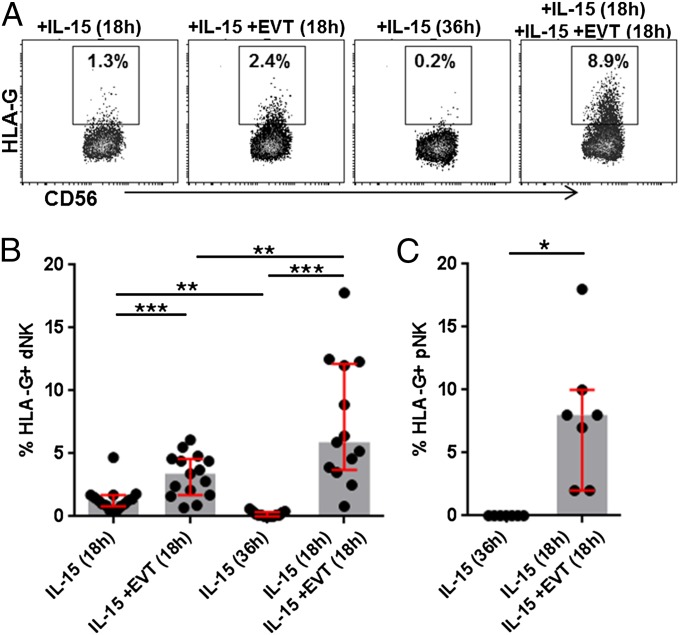
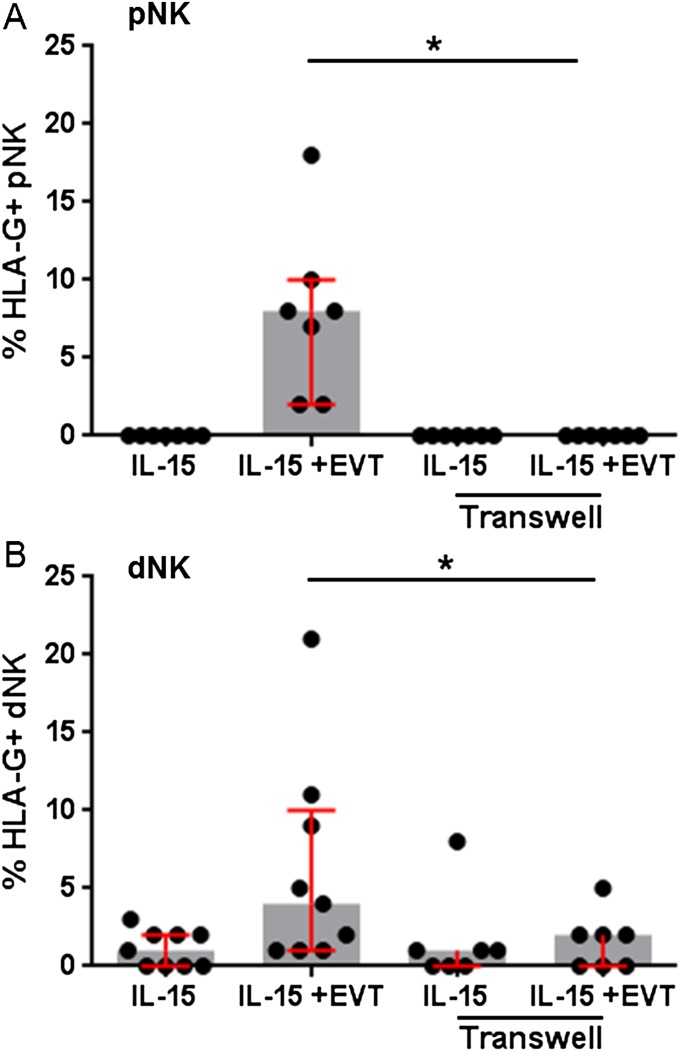
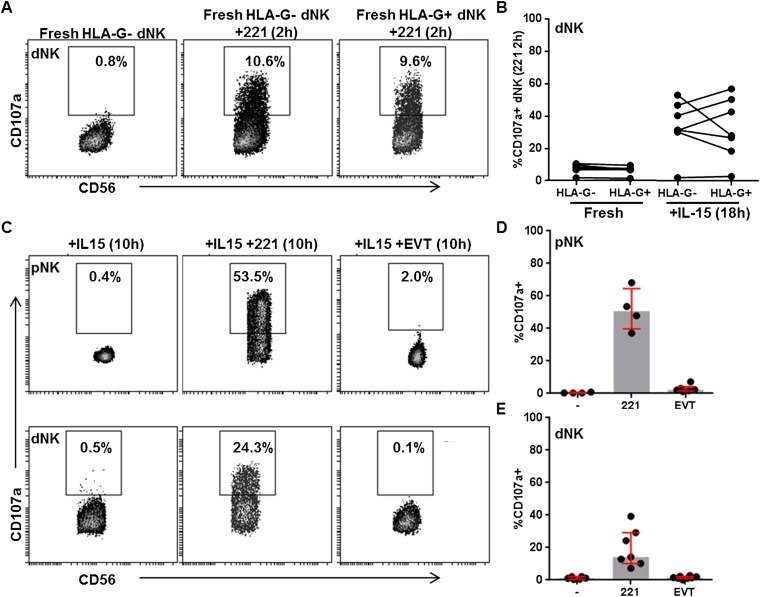
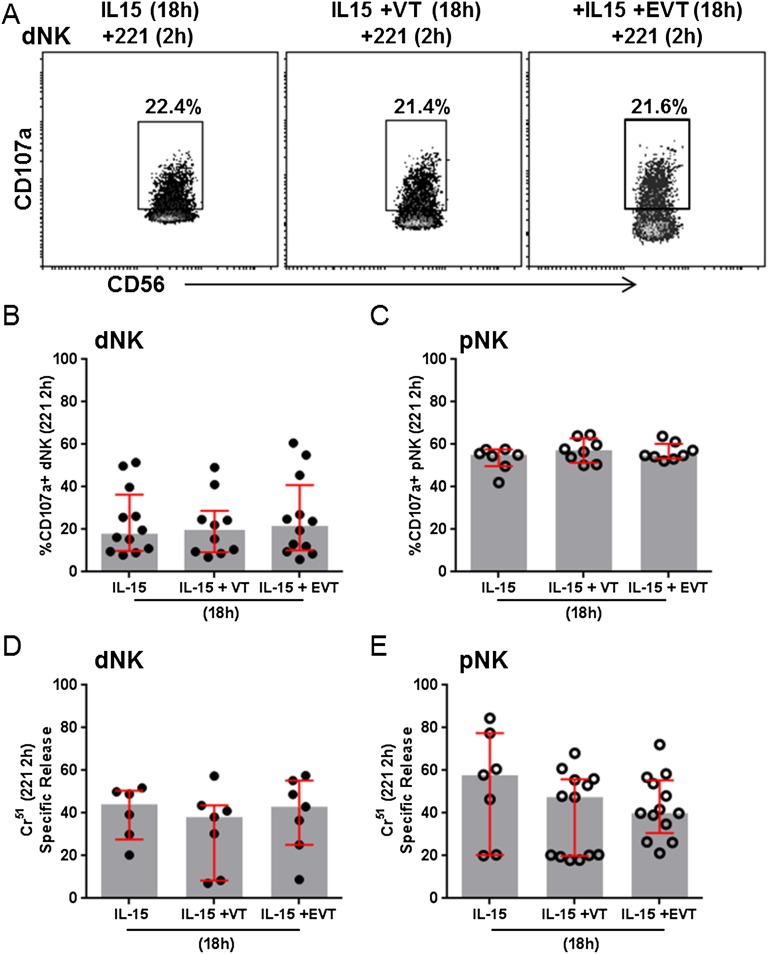
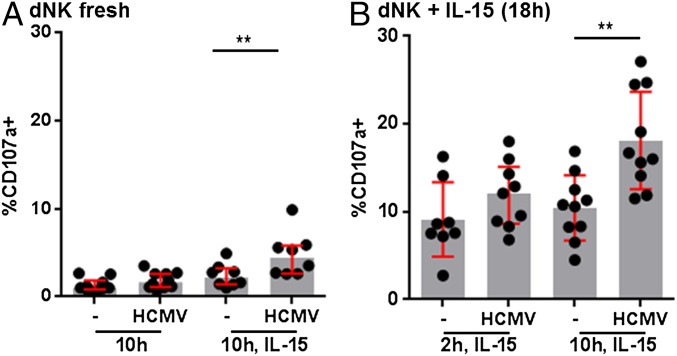
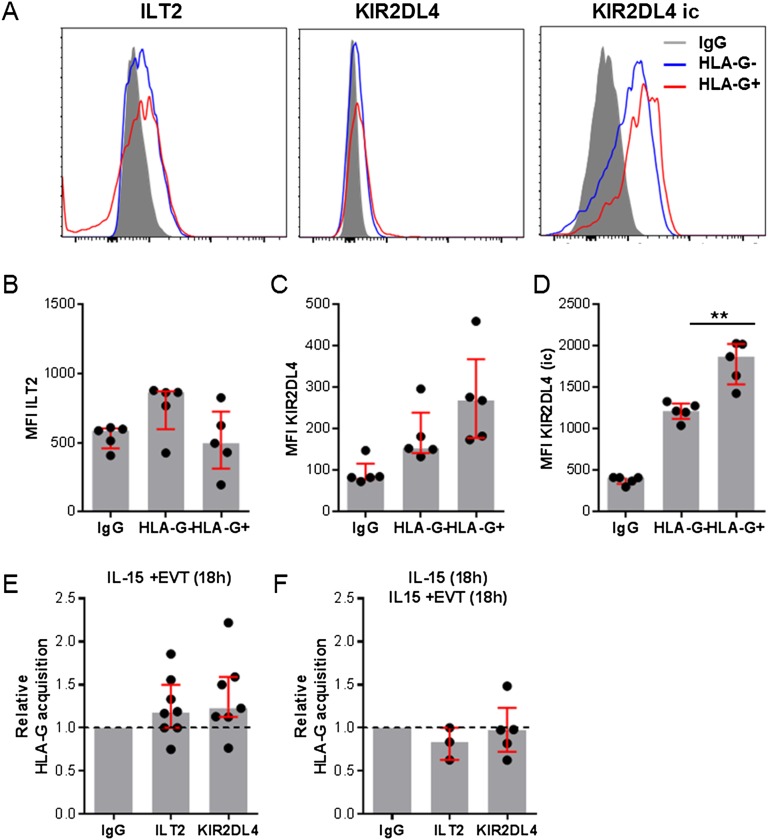
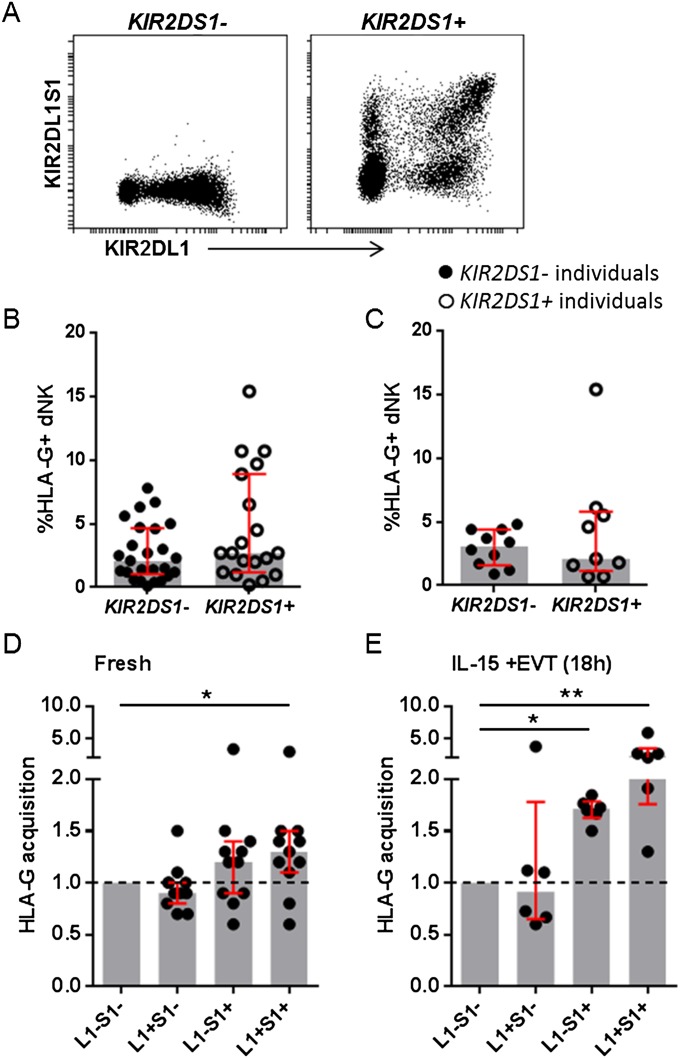
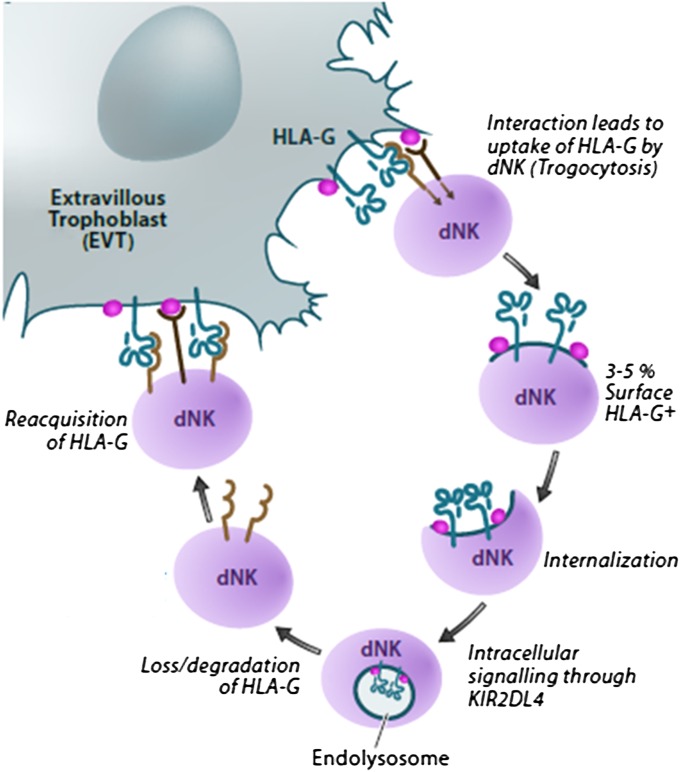
The interaction of noncytotoxic decidual natural killer cells (dNK) and extravillous trophoblasts (EVT) at the maternal-fetal interface was studied. Confocal microscopy revealed that many dNK interact with a single large EVT. Filamentous projections from EVT enriched in HLA-G were shown to contact dNK, and may represent the initial stage of synapse formation. As isolated, 2.5% of dNK contained surface HLA-G. However, surface HLA-G-negative dNK contained internalized HLA-G. Activation of dNK resulted in the disappearance of internalized HLA-G in parallel with restoration of cytotoxicity. Surface HLA-G was reacquired by incubation with EVT. This HLA-G cycle of trogocytosis, endocytosis, degradation, and finally reacquisition provides a transient and localized acquisition of new functional properties by dNK upon interaction with EVT. Interruption of the cycle by activation of dNK by cytokines and/or viral products serves to ensure the NK control of virus infection at the interface, and is illustrated here by the response of dNK to human cytomegalo virus (HCMV)-infected decidual stromal cells. Thus, the HLA-G cycle in dNK can provide both for NK tolerance and antiviral immunity.

Keywords: HCMV; cytotoxicity; decidua; human; pregnancy.


Conflict of interest statement

The authors declare no conflict of interest.

Figures

Fig. 1.
Fig. 1.
Immune synapse formation between dNK and EVT. EVT and sample-matched dNK were coincubated for 2 h. The cocultures were stained for HLA-G (red) and then fixed, permeabilized, and stained with filamentous-actin (F-actin) (green), DAPI (blue), and perforin (white). (A) Images of three HLA-G–expressing EVT and many perforin-containing dNK. (Left) Single colors. (Right) Merged image of all four colors. (Scale bar, 20 µm.) The dotted box indicates a dNK–EVT interaction imaged at higher magnification in B. (B and C) dNK and EVT contacts in which HLA-G is (B) enriched and (C) not enriched at the contacts between EVT and dNK. (Scale bars, 5 µm.) Graphs depict HLA-G (red) and F-actin (green) intensity on the dotted profile lines following the EVT membrane. The fluorescence intensity within the white boxes are depicted in Fig. S1. (D) Images showing HLA-G–coated filopodia extending from EVT to dNK. Panels show single colors as well as a merged image. (Scale bars, 5 µm.) (E) Images showing HLA-G staining on dNK. The HLA-G staining on dNK is not continuous with the EVT. Panels show single colors as well as a merged image. White boxes indicate trogocytosed HLA-G (red) on dNK. (Scale bars, 5 µm.)
Fig. S1.
Fig. S1.
Immune synapse formation between dNK and EVT. (A and B) Graphs depict HLA-G (red) and F-actin (green) intensity within the white rectangles shown in Fig. 1 B and C that indicates the dNK–EVT contacts in which HLA-G is (A) enriched and (B) not enriched at the contacts between EVT and dNK. (C) The graph depicts the percentage of dNK cells conjugated to EVT in which perforin was polarized to the synapse. dNK–EVT conjugates where HLA-G was enriched or not are depicted separately. A total of 89 dNK–EVT conjugates was analyzed.
Fig. 2.
Fig. 2.
HLA-G is present on dNK both as surface HLA-G and as internalized HLA-G. (A and B) FACS plots (A) and percentage (B) of surface HLA-G+ CD45+CD56+CD14−CD3− pNK and dNK analyzed directly ex vivo. (C) Western blot images of fresh dNK sorted into surface HLA-G+ and HLA-G− populations. Bands for HLA-G (39-kDa) and HSP70 (70-kDa) proteins are depicted. Negative and positive controls include HLA-G− VT and HLA-G+ EVT. (D) Quantification of HLA-G relative to HSP70 expression within surface HLA-G− and surface HLA-G+ dNK. Bars depict median percentages and lines depict interquartile range. ***P < 0.005.
Fig. S2.
Fig. S2.
FACS gating strategy for HLA-G+ dNK. Fresh dNK were stained for CD45, CD14, CD56, and HLA-G and analyzed on an LSR II flow cytometer. (A) dNK were gated for live cells based on FSC/SSC (P1), duplicates were avoided (P2 and P3), and CD45+CD14− (P4) and CD45+CD56+ (P5) were selected. (B) HLA-G was analyzed on CD56+ cells compared with isotype control. No difference in the percentage of HLA-G+ dNK was observed when duplicates were avoided (II) or not (I). 7AAD was used to determine the viability of HLA-G+ dNK. (C) FACS plots for 7AAD and HLA-G of two representative samples. All HLA-G+ dNK were negative for 7AAD staining. This demonstrates that HLA-G+ cells are viable cells and do not represent NK cells conjugated to other HLA-G+ decidual cells.
Fig. S3.
Fig. S3.
Surface HLA-G− and HLA-G+ dNK do not contain HLA-G mRNA. Total mRNA was prepared from fresh surface HLA-G− and surface HLA-G+ dNK. HLA-G mRNA was quantified by qRT-PCR and normalized using GAPDH expression. Data are presented as fold change relative to HLA-G+ EVT. HLA-G− VT were used as a negative control. Bars depict median percentages and lines depict interquartile range.
Fig. 3.
Fig. 3.
Degradation of HLA-G on dNK by cytokine stimulation. (A and B) Western blot images (A) and quantification (B) of HLA-G relative to HSP70 protein of fresh dNK (◆) and dNK cultured with IL-15 (●) or IL-2 (○) for 36 h. (C and D) Western blot images (C) and quantification (D) of HLA-G relative to HSP70 protein of fresh dNK (◆) and dNK cultured with IL-15 (●), IL-2 (○), or IL-12 (▪) for 36 h. Bars depict median percentages and lines depict interquartile range. *P < 0.05.
Fig. 4.
Fig. 4.
dNK and pNK reacquire HLA-G from EVT. (A) Representative FACS plots of CD56 and HLA-G expression on dNK cultured with IL-15 or with IL-15 and EVT for 18 or 36 h. (B and C) Graphs depict percentages of (B) HLA-G+ dNK and (C) HLA-G+ pNK after culture with or without EVT. Bars depict median percentages and lines depict interquartile range. *P < 0.05, **P < 0.01, ***P < 0.005.
Fig. S4.
Fig. S4.
Acquisition of HLA-G by pNK and dNK from EVT is cell contact-dependent. pNK (A) and dNK (B) were cultured with IL-15 or in the presence of IL-15 and EVT. pNK and dNK were either directly added to the EVT cultures or added to the culture but separated with a Transwell membrane. After coculture, NK cells were harvested and analyzed for expression of HLA-G. Only the pNK and dNK that were in direct contact with EVT acquired HLA-G. pNK and dNK that were separated from the EVT with a Transwell membrane did not acquire HLA-G. These data confirm a cell contact-dependent acquisition of HLA-G. Lines indicate median percentages and interquartile range. *P < 0.05.
Fig. S5.
Fig. S5.
HLA-G reacquisition does not change the cytolytic capacity of dNK and pNK. (A) Representative FACS plots of CD107a and CD56 expression on freshly isolated HLA-G− or HLA-G+ dNK after incubation with or without 221 cells for 2 h. (B) Graphs depict the percentage of CD107a+ within fresh dNK and IL-15–activated dNK FACS-sorted into surface HLA-G− and surface HLA-G+ cells before incubation with 221 cells. (C) Representative FACS plots of CD107a and CD56 expression on pNK (Upper) and dNK (Lower) incubated with IL-15, with IL-15 and 221 cells, or with IL-15 and EVT for 10 h. (D and E) Graphs depict the percentage of CD107a+ (D) pNK and (E) dNK incubated under the same conditions.
Fig. S6.
Fig. S6.
HLA-G reacquisition by IL-15–activated dNK does not diminish cytolytic capacity. (A) Representative FACS plots of CD56 and CD107a expression on dNK cultured with IL-15, with IL-15 and VT, or with IL-15 and EVT for 18 h. dNK were harvested and incubated with 221 cells and anti-CD107a for 2 h. (B and C) Graphs depict percentages of (B) CD107a+ dNK and (C) CD107a+ pNK incubated under the same conditions. (D and E) Similarly, (D) dNK and (E) pNK were cocultured with or without VT and EVT for 18 h in the presence of IL-15. Cytotoxicity was measured after harvesting NK cells and incubation with 51Cr-labeled 221 cells for 4 h (effector:target ratio of 3:1). 51Cr release is depicted as specific release. Bars depict median percentages and lines depict interquartile range.
Fig. 5.
Fig. 5.
IL-15–activated dNK specifically degranulate in response to HCMV-infected DSC. (A) The graph depicts the percentage of CD107a+ dNK in response to DSC and HCMV-infected DSC in the presence or absence of IL-15. Cells were coincubated for 10 h. (B) Similar graph of IL-15–preactivated dNK (18 h) cocultured for 2 or 10 h with DSC and HCMV-infected DSC.
Fig. S7.
Fig. S7.
Fresh HLA-G+ dNK express increased levels of intracellular KIR2DL4, but acquisition of HLA-G by dNK is independent of KIR2DL4. (AD) Representative FACS histograms (A) and mean fluorescence intensity (MFI) of surface ILT2 (B), surface KIR2DL4 (C), and intracellular (ic) KIR2DL4 expression (D) in fresh HLA-G− and HLA-G+ dNK compared with isotype controls. (E and F) Relative acquisition of HLA-G by fresh (E) and IL-15–preactivated (F) dNK cultured with EVT in the presence of blocking antibodies for ILT2 and KIR2DL4 or isotype controls. Relative HLA-G acquisition was calculated as the percentage of HLA-G+ dNK normalized to untreated or isotype-treated parallel control cultures. Bars indicate median and interquartile range. **P < 0.01. Dashed lines indicate a relative acquisition of 1.
Fig. S8.
Fig. S8.
Acquisition of HLA-G by dNK is increased on KIR2DS1+ dNK. (A) FACS analysis identifies two NK subsets (L1− and L1+) in KIR2DS1− and four NK subsets (L1−S1−, L1+S1−, L1−S1+, and L1+S1+) in KIR2DS1+ individuals. (B and C) Percentage of HLA-G+ dNK in KIR2DS1− and KIR2DS1+ women analyzed directly ex vivo. (B) Data for all women. (C) Only samples with an HLA-C2+ fetus. Data do not show differences between HLA-G acquisition in KIR2DS1− and KIR2DS1+ women. (D and E) HLA-G acquisition of L1−S1−, L1+S1−, L1−S1+, and L1+S1+ dNK in KIR2DS1+ women was analyzed directly ex vivo (D) and after coculture (E) with EVT. The percentage of HLA-G+ dNK within each subset is depicted relative to the percentage of the HLA-G+ L1−S1− subset of each individual. Bars depict median and lines depict interquartile range. *P < 0.05, **P < 0.01. Dashed lines indicate a relative acquisition of 1. HLA-C typing was performed by the American Red Cross tissue typing facility in Dedham, MA.
Fig. 6.
Fig. 6.
HLA-G cycle. Trogocytosis, endocytosis, degradation, and finally reacquisition provide a transient and localized acquisition of new functional properties by dNK upon interaction with EVT.

Similar articles

Cited by

References

    1. Ellis SA, Sargent IL, Redman CW, McMichael AJ. Evidence for a novel HLA antigen found on human extravillous trophoblast and a choriocarcinoma cell line. Immunology. 1986;59(4):595–601. - PMC - PubMed
    1. Geraghty DE, Koller BH, Orr HT. A human major histocompatibility complex class I gene that encodes a protein with a shortened cytoplasmic segment. Proc Natl Acad Sci USA. 1987;84(24):9145–9149. - PMC - PubMed
    1. Kovats S, et al. A class I antigen, HLA-G, expressed in human trophoblasts. Science. 1990;248(4952):220–223. - PubMed
    1. Pazmany L, et al. Protection from natural killer cell-mediated lysis by HLA-G expression on target cells. Science. 1996;274(5288):792–795. - PubMed
    1. Poehlmann TG, et al. Inhibition of term decidual NK cell cytotoxicity by soluble HLA-G1. Am J Reprod Immunol. 2006;56(5-6):275–285. - PubMed

Publication types