. 2015 Nov 3;112(44):E5972-9.
doi: 10.1073/pnas.1518165112. Epub 2015 Oct 12.

Functional group-specific traits drive phytoplankton dynamics in the oligotrophic ocean

Affiliations

Functional group-specific traits drive phytoplankton dynamics in the oligotrophic ocean

Harriet Alexander et al. Proc Natl Acad Sci U S A. .

Abstract

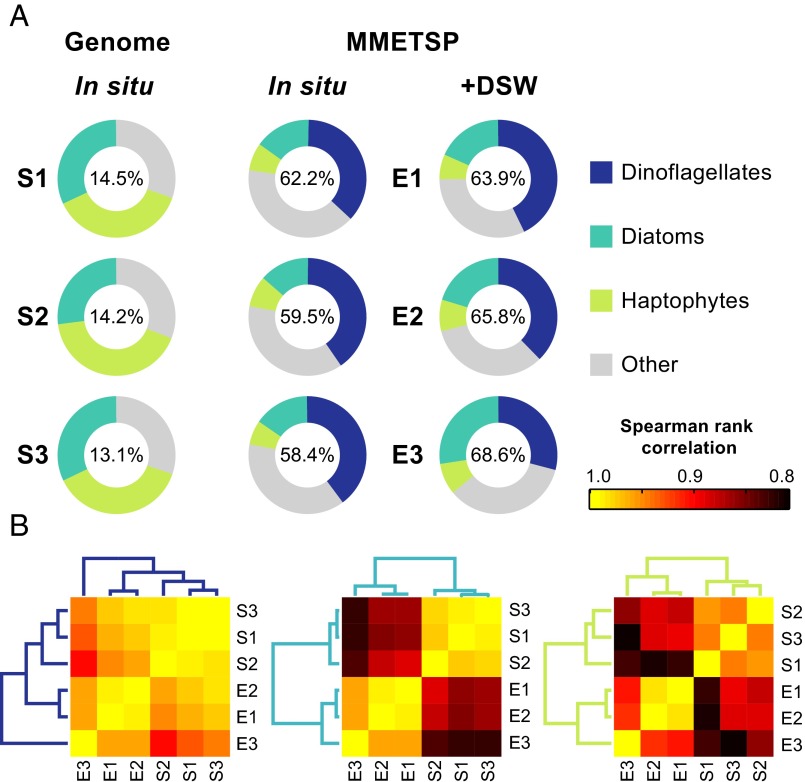
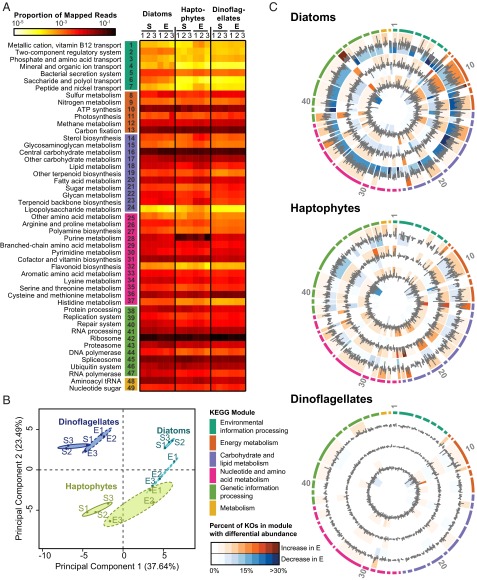
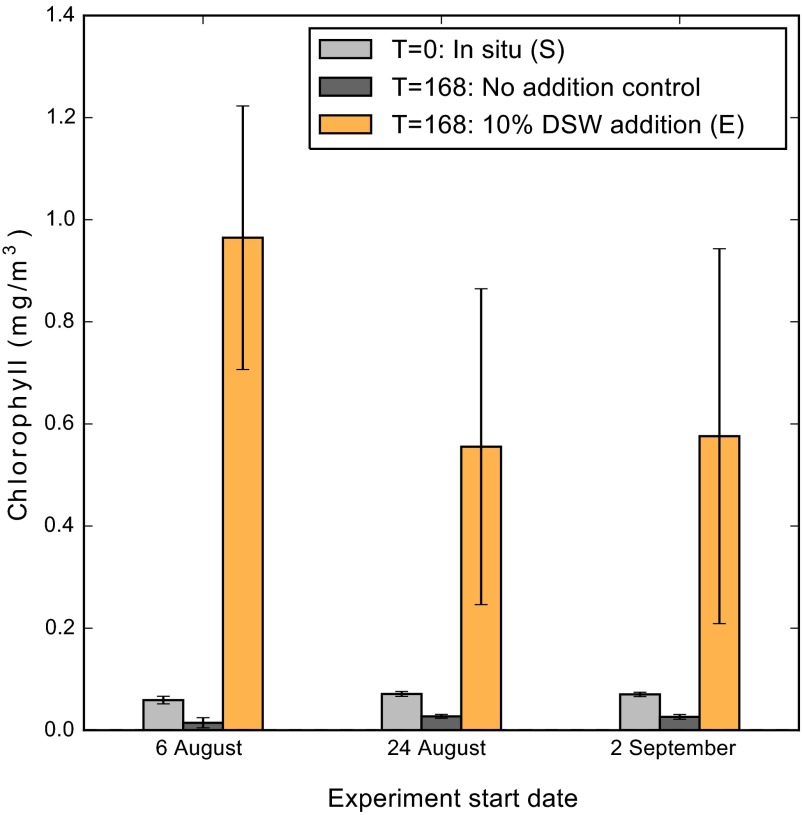
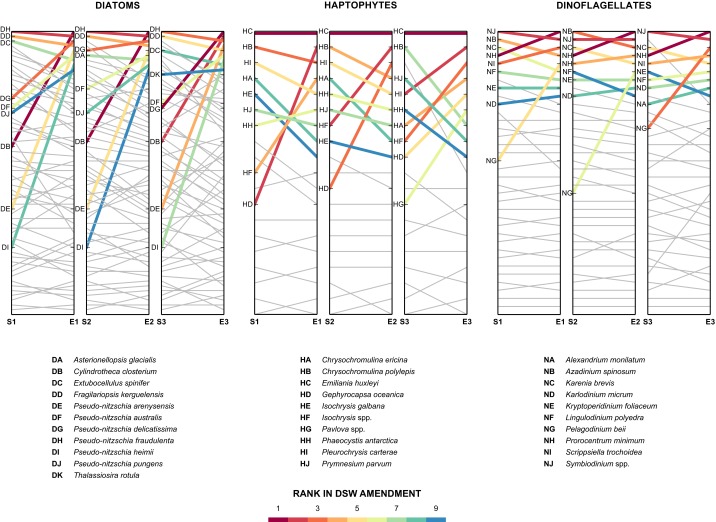
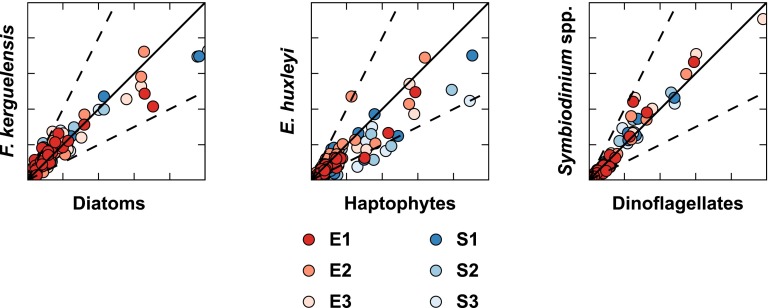
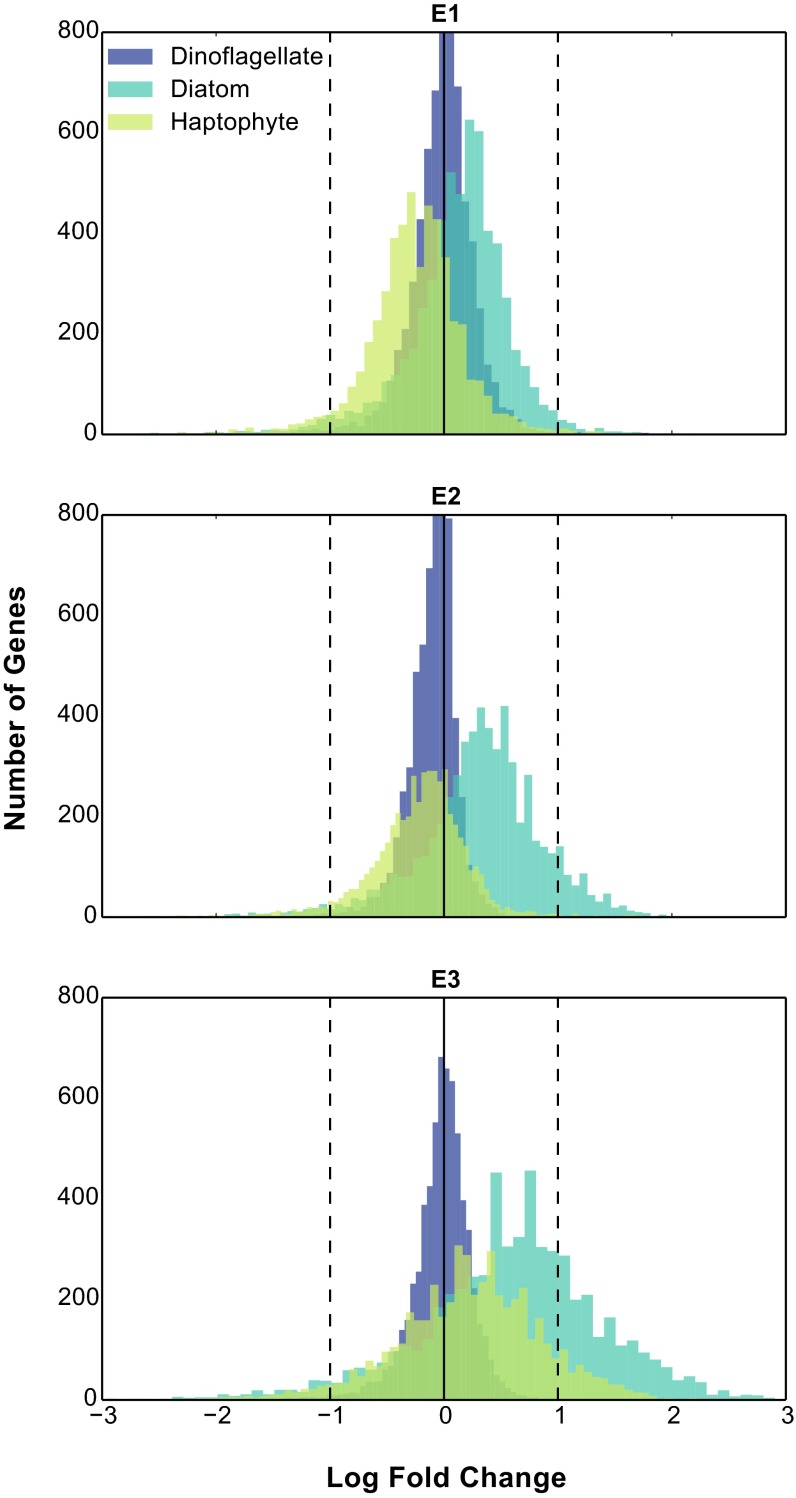
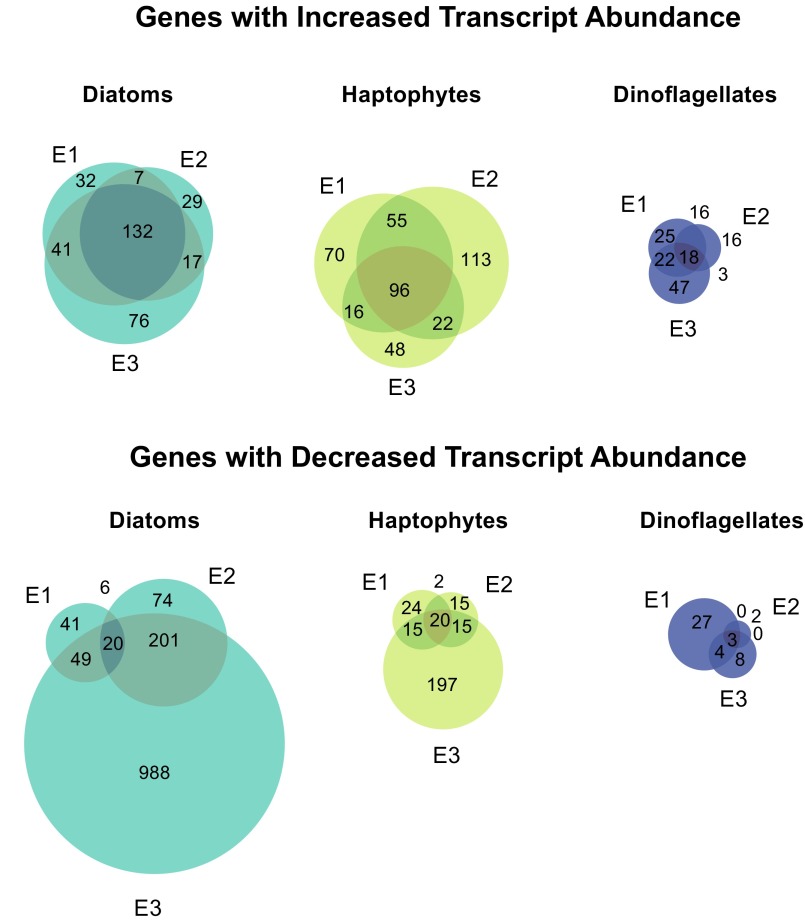
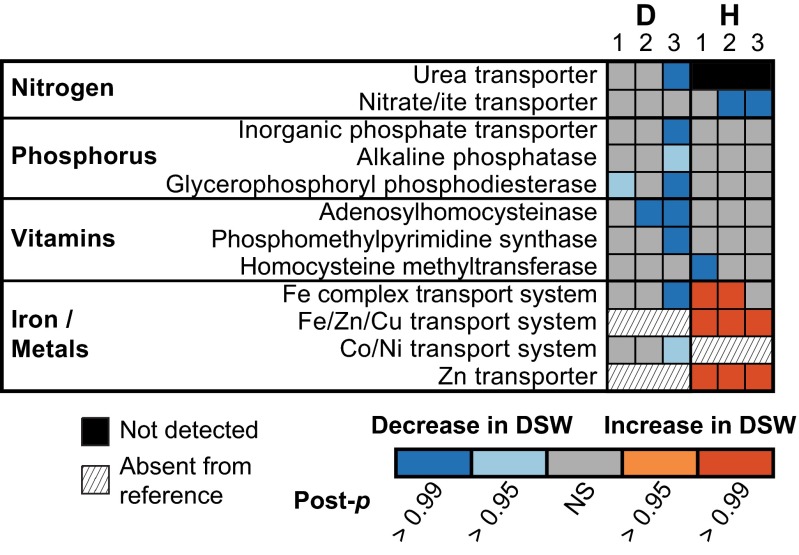
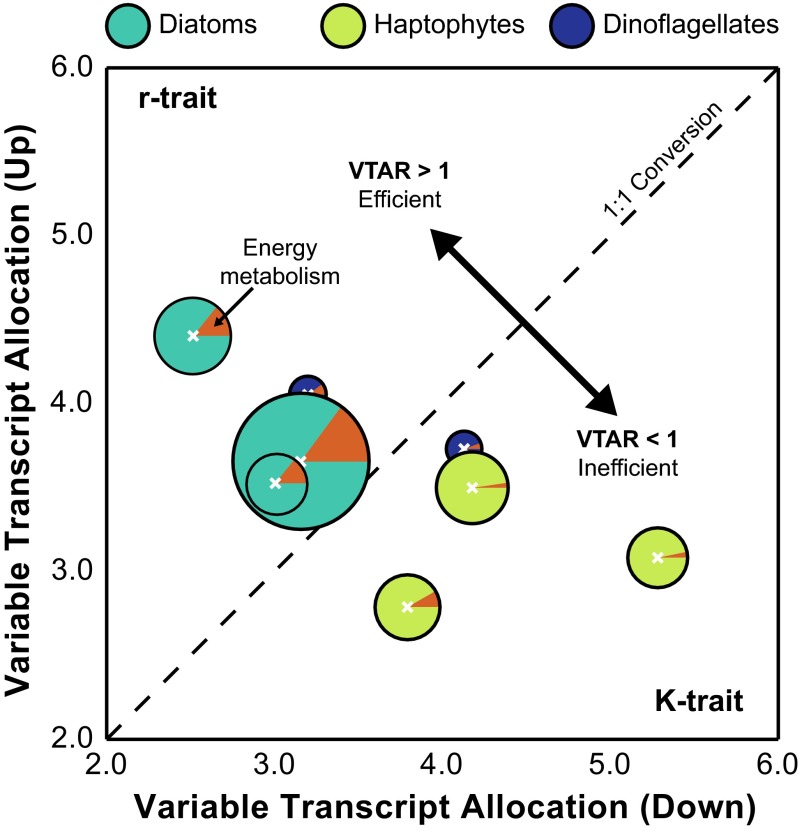
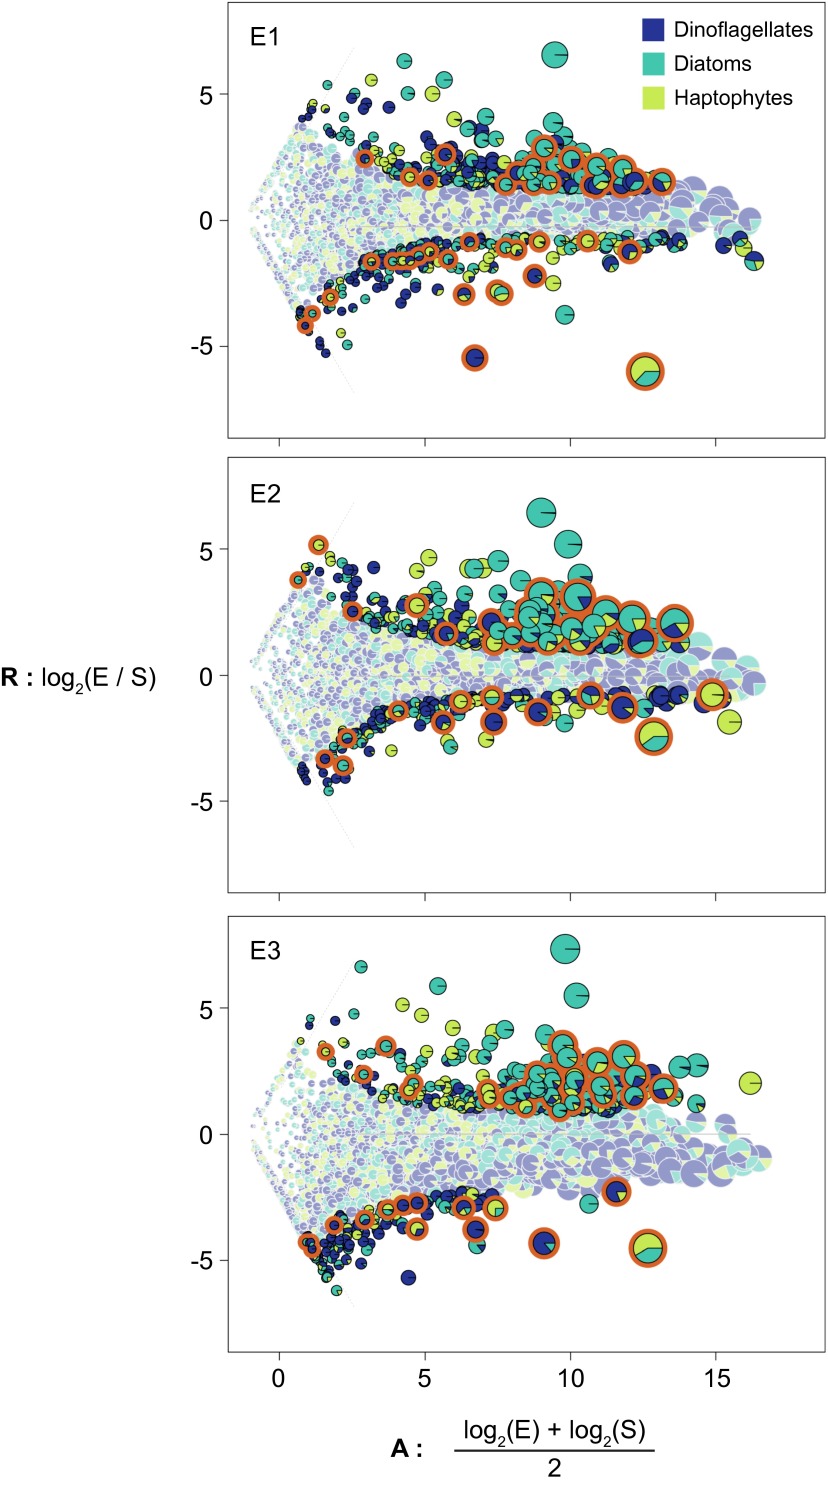
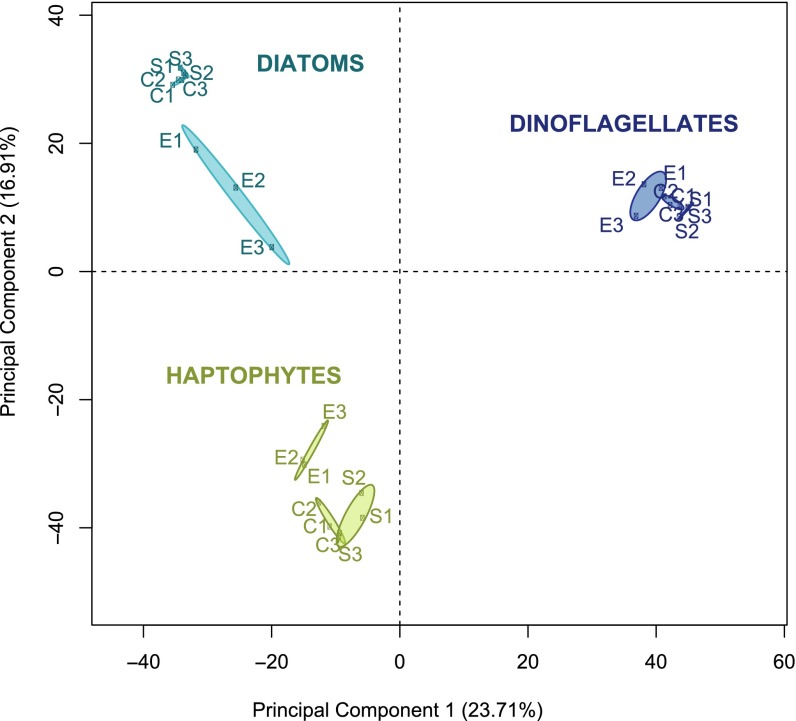
A diverse microbial assemblage in the ocean is responsible for nearly half of global primary production. It has been hypothesized and experimentally demonstrated that nutrient loading can stimulate blooms of large eukaryotic phytoplankton in oligotrophic systems. Although central to balancing biogeochemical models, knowledge of the metabolic traits that govern the dynamics of these bloom-forming phytoplankton is limited. We used eukaryotic metatranscriptomic techniques to identify the metabolic basis of functional group-specific traits that may drive the shift between net heterotrophy and autotrophy in the oligotrophic ocean. Replicated blooms were simulated by deep seawater (DSW) addition to mimic nutrient loading in the North Pacific Subtropical Gyre, and the transcriptional responses of phytoplankton functional groups were assayed. Responses of the diatom, haptophyte, and dinoflagellate functional groups in simulated blooms were unique, with diatoms and haptophytes significantly (95% confidence) shifting their quantitative metabolic fingerprint from the in situ condition, whereas dinoflagellates showed little response. Significantly differentially abundant genes identified the importance of colimitation by nutrients, metals, and vitamins in eukaryotic phytoplankton metabolism and bloom formation in this system. The variable transcript allocation ratio, used to quantify transcript reallocation following DSW amendment, differed for diatoms and haptophytes, reflecting the long-standing paradigm of phytoplankton r- and K-type growth strategies. Although the underlying metabolic potential of the large eukaryotic phytoplankton was consistently present, the lack of a bloom during the study period suggests a crucial dependence on physical and biogeochemical forcing, which are susceptible to alteration with changing climate.

Keywords: biogeochemistry; blooms; ecological traits; metatranscriptomics; phytoplankton.


Conflict of interest statement

The authors declare no conflict of interest.

Figures

Fig. 1.
Fig. 1.
Taxonomic distribution in mRNA mapped reads consistent across time but altered by DSW addition. Sequences collected during the summer of 2012 at Station ALOHA (S1: August 6, S2: August 24, S3: September 2) and corresponding DSW incubation experiments (E1–E3) were mapped to two custom databases: (i) nonsymbiotic microalgal genomes and (ii) all freely available transcriptomes from the MMETSP as of March 17, 2014. (A) Taxonomic affiliation of reads across the three most abundant functional groups—dinoflagellates, diatoms, and haptophytes—mapped to both the genome and MMETSP databases for S1–S3. The corresponding DSW addition incubations E1–E3 were only mapped to the MMETSP database. The percentage of total reads mapped is indicated inside each of the circles. (B) Spearman rank correlation for species composition shifts within each of the three functional groups across S1–S3 and E1–E3.
Fig. 2.
Fig. 2.
QMF and patterns of differential expression across KEGG orthology following DSW addition underscore functional group traits. (A) Relative metabolic partitioning of the mRNA pool across the three in situ samples (S1–S3) and corresponding DSW incubation experiments (E1–E3) was assessed using QMF. The summed proportion of mapped reads falling into each of the KEGG modules is depicted as a heat map. (B) PCA of the QMF signals for each of the functional groups across S1–S3 and E1–E3; 95% confidence ellipses are indicated for each of the sample types by functional group. (C) Log fold change and significance of differential expression between DSW amendments and in situ samples for KEGG orthologs are visualized with Circos (54) for the diatoms, haptophytes, and dinoflagellates. Outermost ring colors indicate the KEGG supermodule, with individual wedges of the pie corresponding to KEGG modules as numbered in A. Concentric circles indicate expression of the three replicated DSW addition experiments compared with in situ samples: E3 (outer), E2 (middle), and E1 (inner). The log fold change of individual KEGG orthologs is depicted as a bar plot bounded −3 to 3. The background color of individual KEGG modules identifies the percentage of genes within the module that were significantly (twofold change, post-p > 0.95) increased (orange) or decreased (blue) in abundance, where darker colors indicate that a higher percentage of genes within that module were significantly different.
Fig. S1.
Fig. S1.
Chlorophyll a of replicated experiments for in situ samples (S), a no-addition control, and a 10% DSW amendment (E) are shown. Incubation samples were harvested after 168 h. T, postinoculation time in hours.
Fig. S2.
Fig. S2.
Rank abundance shifts in the species composition of diatoms, haptophytes, and dinoflagellates for the three experiments. The relative shift in rank abundance for each species is depicted for each incubation experiment (E1–E3) following DSW addition. The nine most abundant taxa following DSW addition are highlighted for each of the functional groups. Although the species that recruited the reads are denoted here, the recruitment is highly driven by the composition of the database and does not necessarily indicate the actual species present, but rather the closest species present in the database.
Fig. S3.
Fig. S3.
Comparison of the QMF between the whole functional group and representative taxa. The proportion of reads falling into each of the modules depicted in Fig. 2 is plotted for S1–S3 and E1–E3, comparing the summed functional group signal and the signal of a representative taxon. The color of the marker indicates the sample; solid and dashed lines mark the 1:1 and 1:2 lines, respectively.
Fig. S4.
Fig. S4.
Distribution of log fold change following DSW addition. Histograms of the number of genes falling within each of the log fold change bins for diatoms, haptophytes, and dinoflagellates are shown. The solid line indicates no fold change; dashed lines indicate twofold change, both up and down.
Fig. S5.
Fig. S5.
Weighted Venn diagrams of genes with significantly different abundances following DSW addition by functional group. The uniqueness of KEGG orthologs with increased or decreased abundances as determined by ASC (twofold change, post-p > 0.95) across experiments was assessed for diatoms, haptophytes, and dinoflagellates.
Fig. 3.
Fig. 3.
Shifts in transcript abundance of genes responsive to biogeochemical forcing. The significance of changes in abundance (twofold change, post-p > 0.95 or post-p > 0.99) for genes known to be associated with nitrogen, phosphorus, vitamin, iron, or other trace metal metabolism for diatoms (D) or haptophytes (H) is indicated as blue (decrease) or orange (increase). Genes present within the reference transcriptome but not detected in the field are marked in black, and genes absent from the reference are hatched. KEGG identifications are as follows: urea transporter (K11959), nitrite/ate transporter (K02575), phosphate transporter (K08176), glycerophosphoryl diester phosphodiesterase (K01126), adenosylhomocysteinase (K01251), phosphomethylpyrimidine synthase (K03147), 5-methyltetrahydrofolate–homocysteine methyltransferase (K00548), iron complex transport system (K02013), iron/zinc/copper transport system (K11706), cobalt/nickel transport system (K02006), and zinc transporter (K14715).
Fig. 4.
Fig. 4.
Variable transcript allocation ratio (VTAR, Eq. 5) differentiates functional group strategies. The variable transcript allocation (VTA) score of the genes with significantly increased (VTAUp, Eq. 3) or decreased (VTADn, Eq. 4) abundance in the DSW amendment relative to the in situ sample is plotted for diatoms, haptophytes, and dinoflagellates for E1–E3. The size of the pie indicates the total number of genes with significantly different transcript abundances between the in situ and DSW-amended treatments. The proportion of increased TPM in DSW-amended treatments within the energy metabolism supergroup is illustrated as a pie slice in orange.
Fig. S6.
Fig. S6.
Microbial assemblage normalized transcript analysis (MANTA) ratio-averaged plots for global shifts in expression of KEGG orthologs. Fold change ratio (R) and average read count (A) are plotted for read counts in the in situ (S) and DSW amendment (E) samples across the three sample pairs (S1:E1, S2:E2, and S3:E3). The trimmed mean of fold change values is noted as a gray solid line; orthologs unique to one library are separated by gray dashed lines. Pies indicate the taxonomic distribution of orthologous reads across the three functional groups. KEGG orthologs that were significantly differentially expressed (DE) (adjusted P > 0.05) are outlined in black and highlighted in brighter colors, and those KEGG orthologs not significantly DE are outlined in gray. DE KEGG orthologs that fall in the energy metabolism KEGG module are outlined in orange.
Fig. S7.
Fig. S7.
PCA of the QMF signals across in situ, control no addition, and DSW amended samples. PCA of the QMF signals for each of the functional groups across in situ (S1–S3), control no addition (C1–C3), and DSW amendment (E1–E3); 95% confidence ellipses are indicated for each of the sample types by functional group.

References

    1. Karl DM, Laws EA, Morris P, Williams PJL, Emerson S. Global carbon cycle: Metabolic balance of the open sea. Nature. 2003;426(6962):32. - PubMed
    1. McAndrew P, et al. Metabolic response of oligotrophic plankton communities to deep water nutrient enrichment. Mar Ecol Prog Ser. 2007;332:63–75.
    1. Karl DM, Church MJ, Dore JE, Letelier RM, Mahaffey C. Predictable and efficient carbon sequestration in the North Pacific Ocean supported by symbiotic nitrogen fixation. Proc Natl Acad Sci USA. 2012;109(6):1842–1849. - PMC - PubMed
    1. Villareal TA, Brown CG, Brzezinski MA, Krause JW, Wilson C. Summer diatom blooms in the North Pacific subtropical gyre: 2008-2009. PLoS One. 2012;7(4):e33109. - PMC - PubMed
    1. Villareal TA, Adornato L, Wilson C, Schoenbaechler CA. Summer blooms of diatom-diazotroph assemblages and surface chlorophyll in the North Pacific Gyre: A disconnect. J Geophys Res. 2011;116(C3):C03001.

Publication types

Associated data

LinkOut - more resources