. 2015 Oct 27;112(43):E5844-53.
doi: 10.1073/pnas.1509914112. Epub 2015 Oct 12.

Successful arrest of photoreceptor and vision loss expands the therapeutic window of retinal gene therapy to later stages of disease

Affiliations

Successful arrest of photoreceptor and vision loss expands the therapeutic window of retinal gene therapy to later stages of disease

William A Beltran et al. Proc Natl Acad Sci U S A. .

Abstract

Inherited retinal degenerations cause progressive loss of photoreceptor neurons with eventual blindness. Corrective or neuroprotective gene therapies under development could be delivered at a predegeneration stage to prevent the onset of disease, as well as at intermediate-degeneration stages to slow the rate of progression. Most preclinical gene therapy successes to date have been as predegeneration interventions. In many animal models, as well as in human studies, to date, retinal gene therapy administered well after the onset of degeneration was not able to modify the rate of progression even when successfully reversing dysfunction. We evaluated consequences of gene therapy delivered at intermediate stages of disease in a canine model of X-linked retinitis pigmentosa (XLRP) caused by a mutation in the Retinitis Pigmentosa GTPase Regulator (RPGR) gene. Spatiotemporal natural history of disease was defined and therapeutic dose selected based on predegeneration results. Then interventions were timed at earlier and later phases of intermediate-stage disease, and photoreceptor degeneration monitored with noninvasive imaging, electrophysiological function, and visual behavior for more than 2 y. All parameters showed substantial and significant arrest of the progressive time course of disease with treatment, which resulted in long-term improved retinal function and visual behavior compared with control eyes. Histology confirmed that the human RPGR transgene was stably expressed in photoreceptors and associated with improved structural preservation of rods, cones, and ON bipolar cells together with correction of opsin mislocalization. These findings in a clinically relevant large animal model demonstrate the long-term efficacy of RPGR gene augmentation and substantially broaden the therapeutic window for intervention in patients with RPGR-XLRP.

Keywords: RPGR; XLRP; gene therapy; late stage; retinal degeneration.


Conflict of interest statement

Conflict of interest statement: W.A.B., A.V.C., W.-T.D., S.L.B., A.S.L., W.W.H., S.G.J., and G.D.A. are inventors on the following patent application: PCT/US2013/022628. W.W.H. and the University of Florida have a financial interest in the use of adeno-associated virus therapies and own equity in a company (AGTC Inc.) that might, in the future, commercialize some aspects of this work.

Figures

Fig. 1.
Fig. 1.
Schematic of neurodegenerations and complex spatiotemporal interactions of potential treatments that seek to prevent disease or positively modify the natural history in retinitis pigmentosa. (A) Natural history of neuron death can be approximated as a delayed exponential function (Upper). Therapies initiated at intermediate stages aim to stop further neuron loss and rescue function (Lower). (B) In retinitis pigmentosa and allied diseases, there is a complex spatial distribution of photoreceptor degeneration. Typically an annulus is affected first, and over decades, the width of the annulus grows both centrifugally and centripetally (Upper). Subretinal gene therapy injections aim to modify the natural history locally by either preventing or arresting neurodegeneration depending on the local disease stage (Lower).
Fig. 2.
Fig. 2.
Dose–response function and long-term durability of gene therapy intervention at initial disease stage. (A) Pseudocolor maps of mean ONL thickness topography in wild-type dogs (n = 5; ages 7–43 wk; mean = 25 wk) compared with individual eyes of representative XLPRA2 dogs (at 36–38 wk) subretinally treated at 5 wk of age in the supero-nasal quadrant with 70 μL of different vector titers. Dashed outline, the retinal region corresponding to the subretinal bleb. All eyes shown as equivalent right eyes and optic nerve and major blood vessels overlaid for ease of comparison. T, temporal; N, nasal retina. (B) ONL thickness fraction of WT (log10 units) at 36–38 wk of age as a function of vector titer injected at 5 wk. Data from treated (Tx, green) and untreated (UnTx, red) retinal regions are contrasted. The ranges of ONL fraction expected in WT eyes (thin dashed) or in untreated XLPRA2 eyes at 38 wk of age (thick dashed) are shown. In B and D, smaller symbols represent the individual data and larger symbols with error bars represent mean ± SD; *P < 0.01 for paired t tests. (C) Immunolabeling of stable human RPGR transgene product on retinal sections at 43 wk of age (38 wk after treatment) is found exclusively in the photoreceptors at the bleb/treated areas and is dose dependent. (D) Serial ONL thickness measures between 32 and 131 wk of age after a superior subretinal vector injection at 5 wk of age (green arrow) to evaluate long-term durability with the 1.51 × 10¹¹ vg/mL titer. Treated loci (green) remain near WT thickness (thin dashed lines), whereas untreated loci (red) show progressive thinning along the trajectory expected from the natural history of disease (thick dashed lines). Z468-OS and similar labels designate the individual animal and eye.
Fig. S1.
Fig. S1.
Natural history of retinal degeneration in RPGR-mutant XLPRA2 dogs. (A) Pseudocolor maps of ONL thickness topography in a representative young WT dog. Black squares demarcate the five standard locations used for analysis. (B) The mean value of the ONL thickness in young WT dogs (n = 5; ages 7–43 wk; mean = 25 wk) after each map has been translated and rotated to bring the centers of the optic nerves and the locations of the canine fovea-like region (black arrowheads) into congruence. This panel is repeated from Fig. 2A for the convenience of the readers. (C) Representative ONL thickness topographies in RPGR-mutant XLPRA2 dogs at different ages show its progressive thinning with age. Also shown (Right) is a representative control eye at 95 wk of age that was injected subretinally with BSS at 5 wk; dashed lines demarcate the BSS bleb; three superior standard locations fall within the BSS bleb and two inferior locations fall outside. There is no obvious treatment effect or toxicity resulting from the BSS injection. T, temporal; N, nasal retina. (D and E) The natural history of ONL thickness within three standard locations in superior and supero-nasal retina (D) and two standard locations in the inferior retina (E) in WT (light gray symbols) and XLPRA2 eyes (dark gray symbols). Note, data from two older WT dogs are shown for reference but not included in the mean normal calculation. The main XLPRA2 natural history data originates from nine untreated control eyes of seven dogs (ages 8–146 wk; mean = 31 wk). There were additional data from eight eyes with subretinal BSS injections. At each standard location, ONL thickness was divided by the mean WT ONL at the corresponding location to produce ONL fraction, and the logarithm (to the base 10) was calculated. Log ONL fractions are plotted as a function of age for the three superior and supero-nasal retinal loci (D) and two inferior retinal loci (E). Parallel dashed lines (up to 78 wk) demarcate the 95% prediction intervals. Estimates of the underlying exponential progression rates are −0.33 log10/y for the superior retina loci and −0.45 log10/y for the inferior retina loci. After 78 wk, there is an apparent slowing of rate of degeneration and greater variability. Smaller symbols represent the individual data and larger symbols with error bars represent mean ± SD.
Fig. S2.
Fig. S2.
WT eyes injected with increasing titers of vector. (A) Pseudocolor maps of ONL thickness topography at 34 wk of age in representative WT eyes each injected at 24 wk with 150 μL of a different viral vector titer. Dashed outline, the retinal region corresponding to the subretinal bleb. Red and green lines, the location of OCT scans in untreated and treated regions shown below. (B) ONL fraction at 34 wk as a function of vector titer injected at 24 wk. Data from treated (Tx, green) and untreated (UnTx, red) regions are contrasted. Dashed lines show the range of ONL fraction expected in untreated WT eyes.
Fig. S3.
Fig. S3.
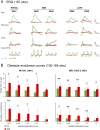
Long-term rescue of photoreceptor function and visual behavior after gene therapy intervention at early, mid, and late stages of disease. (A) Representative ERG traces recorded at 157 wk of age in XLPRA2 dogs treated at 5 wk (Z451), 12 wk (Z462 & Z463) and 26 wk (Z464 & Z465) of age. (B) Mean (±SD) transit time and mean (±SD) number of collisions in an obstacle-avoidance course under different ambient light intensities. The treated vs. control eyes of one XLPRA2 dog (Z451) vector-injected at 5 wk of age and of two XLPRA2 dogs (Z462 & Z463) injected at 12 wk of age were compared after pooling data recorded during nine trials conducted between 130 and 164 wk of age. Gray dotted lines represent the 95% CI of the transit time of WT dogs (n = 3). No collisions were observed with these WT dogs. *P < 0.05, **P < 0.001 from generalized linear model testing between treated and control eyes.
Fig. 3.
Fig. 3.
Efficacy and long-term stability of gene therapy intervention at mid-stage disease. (A) Pseudocolor maps of ONL thickness topography at 31 and 105 wk of age in an XLPRA2 dog treated at 12 wk of age. Dashed outline, the retinal region corresponding to the subretinal vector bleb at treatment. Schematic, right, paired loci across the treatment boundary and in the inferior retina chosen for quantitative evaluation. Eyes are shown as equivalent right eyes with optic nerve and major blood vessels overlaid for ease of comparability. T, temporal; N, nasal retina. (B) Progressive changes in ONL fraction recorded serially between 11 and 130 wk of age in treated (green) and untreated (red) loci in the superior (Left) and inferior (Right) retinas of three XLPRA2 dogs. Vertical green arrows depict the timing of treatment at 12 wk of age. Dashed lines show the range of ONL fraction expected in WT eyes or natural history of progression in untreated XLPRA2 eyes. Smaller symbols represent the individual data and larger symbols with error bars represent mean ± SD; *P < 0.01 for paired t tests between treated and untreated loci. (C–G) Retinal morphology at 113 wk of age in the untreated (Left) and treated (Right) areas of an XLPRA2 dog injected at 12 wk. (C) H&E-stained section across the treatment boundary (red bar in diagram shows section location). (D) H&E stain, higher magnification view. (E) IHC labeling of stable human RPGR transgene product. (F) Cone arrestin (CA, red) and rhodopsin (RHO, green) double IHC. (G) R/G opsin (red) IHC labeling. Z463-OS and similar labels designate the individual animal and eye.
Fig. S4.
Fig. S4.
Further examples of mid- and late-stage treatment. (A) Pseudocolor maps of ONL thickness topography at 31 and 105 wk of age in two XLPRA2 dogs treated at 12 wk of age. (B) Pseudocolor maps of ONL thickness topography at 40 and 106 wk of age in two XLPRA2 dogs treated at 26 wk of age. Dashed outline, the retinal region corresponding to the subretinal bleb. Schematic, right, paired loci across the treatment boundary and in the inferior retina chosen for quantitative evaluation (see Fig. 3B for plot of results that include these eyes). Eyes are shown as equivalent right eyes with optic nerve and major blood vessels overlaid for ease of comparability. T, temporal; N, nasal retina.
Fig. S5.
Fig. S5.
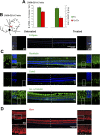
Structural rescue of photoreceptors and bipolar cells in a XLPRA2 dog treated at mid-stage disease. Histology at 113 wk of age of dog Z459 injected at 12 wk. (A) Mean (±SD) number of (M/L + S) and S cones per millimeter of retina length in the treated and untreated areas (n = 4). (B) S cone opsin (green) IHC labeling in the untreated area (Left), across the treatment boundary (Center), and in the treated area (Right). The schematic drawing illustrates the treatment area (dashed black circle) and the location of the section showing the treatment boundary (red line). (C) IHC labeling of the sensory cilium of photoreceptors with rootletin, centrin-3 (Cetn3), and acetylated α-tubulin antibodies. (D) Goα IHC labeling of ON-bipolar cells. White arrows point to their dendrites.
Fig. S6.
Fig. S6.
Immunohistochemical labeling of the photoreceptor sensory cilium in WT and untreated XLPRA2 dogs at mid and late stages of disease. (A) Low and high magnification views of an adult WT canine retina labeled with H&E stain, rootletin, centrin-3 (cetn3), and acetylated α-tubulin antibodies. The schematics show the region of the photoreceptor sensory cilium labeled by these markers. (B) H&E and IHC labeling of an untreated XLPRA2 retina at mid-stage disease. (C) H&E and IHC labeling of an untreated XLPRA2 retina at late-stage disease.
Fig. 4.
Fig. 4.
Efficacy and long-term durability of gene therapy intervention at late-stage disease. (A) Pseudocolor maps of ONL thickness topography at 40 and 106 wk of age in an XLPRA2 dog treated at 26 wk of age. Dashed outline, the retinal region corresponding to the subretinal vector bleb at treatment. Schematic, right, paired loci across the treatment boundary and in the inferior retina chosen for quantitative evaluation. Eyes are shown as equivalent right eyes with optic nerve and major blood vessels overlaid for ease of comparability. T, temporal; N, nasal retina. (B) Progressive changes in ONL fraction recorded serially between 25 and 130 wk of age in treated (green) and untreated (red) loci in the superior retina (Left). None of the three treated eyes received injection in the inferior retina; thus, only untreated loci are shown in inferior retina (Right). Vertical green arrows depict the timing of treatment at 26 wk of age. Dashed lines show the range of ONL fraction expected in WT eyes or natural history of progression in untreated XLPRA2 eyes. Smaller symbols represent the individual data and larger symbols with error bars represent mean ± SD; *P < 0.01 for paired t tests between treated and untreated loci. (C–G) Retinal morphology at 113 wk of age in the untreated (Left) and treated (Right) areas of an XLPRA2 dog injected at 26 wk. (C) H&E-stained section across the treatment boundary (red bar in diagram shows section location). (D) H&E stain, higher magnification view. (E) IHC labeling of stable human RPGR transgene product. (F) Cone arrestin (CA, red) and rhodopsin (RHO, green) double IHC. (G) R/G opsin (red) IHC labeling. Z465-OD and similar labels designate the individual animal and eye.
Fig. 5.
Fig. 5.
Structural rescue of photoreceptors and bipolar cells in a XLPRA2 dog treated at late-stage disease. Histology at 113 wk of dog Z460 injected at 26 wk of age. (A) Mean (±SD) number of (M/L + S) and S cones per millimeter of retina length in the treated and untreated areas (n = 4). (B) S cone opsin (green) IHC labeling in the untreated area (Left), across the treatment boundary (Center), and in the treated area (Right). The schematic drawing illustrates the treatment area (dashed black curve), and the location of the section showing the treatment boundary (red line). (C) IHC labeling of the sensory cilium of photoreceptors with rootletin, centrin-3 (Cetn3), and acetylated α-tubulin antibodies. (D) Goα IHC labeling of ON-bipolar cells. White arrowheads point to their dendrites.
Fig. 6.
Fig. 6.
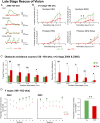
Long-term durability of retinal function and visual behavior after gene therapy intervention at late-stage disease. (A) Representative ERG traces of rod (−1.74 log cd⋅s⋅m−2), mixed rod-cone (1.01 log cd⋅s⋅m−2) recorded dark adapted, and cone (1.01 log cd⋅s⋅m−2) responses to single stimuli or 29-Hz cone flicker (0.76 log cd⋅s⋅m−2) recorded light adapted at 105 wk of age in an XLPRA2 dog treated at 26 wk of age. (B) Summary of all rod and cone ERG results recorded at 105 wk of age from three XLPRA2 dogs treated at late-stage disease. (C) Mean (±SD) transit time and mean (±SD) number of collisions in an obstacle-avoidance course under different ambient light intensities. The treated vs. control eyes of two XLPRA2 dogs (Z464 and Z465) injected at 26 wk of age were compared after pooling data recorded during nine trials conducted between 130 and 164 wk of age. Gray dotted lines represent the 95% CI of the transit time of WT dogs (n = 3). No collisions were observed with these WT dogs. (D) Visually guided behavior in a forced two-choice Y maze of the same two XLPRA2 dogs treated at 26 wk of age. (Left and Center) Performance of each dog when assessing the treated vs. the control eye during eight test sessions conducted between 149 and 162 wk of age. (Right) Visual performance of the treated vs. control eyes after pooling together data from both dogs and from all eight sessions (total of 320 trials). *P < 0.05, **P < 0.001 from paired Student t test (for ERG data) and from generalized linear model testing (for obstacle course and Y maze data) between treated and control eyes.
Fig. S7.
Fig. S7.
Y maze apparatus for the testing of visually guided behavior in dogs. Plan (Left) and three photographs (Right) of the Y maze apparatus. (Upper) Overall view showing the central unit that controls the light stimuli at both exit arms. (Lower Left) View from the entry at dog’s height. (Lower Right) View of the strip of LEDs located at the end of each exit arm. Note that the black cover that isolates the inside of the Y maze was removed on these photographs.
Fig. S8.
Fig. S8.
Retina-wide topographic analysis. Cross-sectional OCT scans were performed in square or rectangular raster sets (black outlines) placed with overlap across vast regions of the retina. Postacquisition, wide angle image of retinal reflectance was produced (gray scale image), retinal blood vessels were traced (white dashed lines) and the optic nerve and bleb locations were overlaid (white lines). Using integrated OCT backscatter intensity, each raster scan set was placed across the retina by adjusting the location and rotation with respect to retinal features visible. T, temporal, N, nasal retina.

References

    1. Hebert LE, Weuve J, Scherr PA, Evans DA. Alzheimer disease in the United States (2010-2050) estimated using the 2010 census. Neurology. 2013;80(19):1778–1783. - PMC - PubMed
    1. Wimo A, Prince M. World Alzheimer Report 2010 The Global Ecomomic Impact of Dementia - Executive summary. Alzheimer's Disease International; London: 2010. pp. 1–9.
    1. Olesen J, Gustavsson A, Svensson M, Wittchen HU, Jönsson B. CDBE2010 study group European Brain Council The economic cost of brain disorders in Europe. Eur J Neurol. 2012;19(1):155–162. - PubMed
    1. Ribe EM, Serrano-Saiz E, Akpan N, Troy CM. Mechanisms of neuronal death in disease: Defining the models and the players. Biochem J. 2008;415(2):165–182. - PMC - PubMed
    1. Li C, Ebrahimi A, Schluesener H. Drug pipeline in neurodegeneration based on transgenic mice models of Alzheimer’s disease. Ageing Res Rev. 2013;12(1):116–140. - PubMed

Publication types

LinkOut - more resources