. 2015 Oct 27;112(43):E5787-95.
doi: 10.1073/pnas.1508371112. Epub 2015 Oct 12.

Structural analysis of nucleosomal barrier to transcription

Affiliations

Structural analysis of nucleosomal barrier to transcription

Daria A Gaykalova et al. Proc Natl Acad Sci U S A. .

Abstract

Thousands of human and Drosophila genes are regulated at the level of transcript elongation and nucleosomes are likely targets for this regulation. However, the molecular mechanisms of formation of the nucleosomal barrier to transcribing RNA polymerase II (Pol II) and nucleosome survival during/after transcription remain unknown. Here we show that both DNA-histone interactions and Pol II backtracking contribute to formation of the barrier and that nucleosome survival during transcription likely occurs through allosterically stabilized histone-histone interactions. Structural analysis indicates that after Pol II encounters the barrier, the enzyme backtracks and nucleosomal DNA recoils on the octamer, locking Pol II in the arrested state. DNA is displaced from one of the H2A/H2B dimers that remains associated with the octamer. The data reveal the importance of intranucleosomal DNA-protein and protein-protein interactions during conformational changes in the nucleosome structure on transcription. Mechanisms of nucleosomal barrier formation and nucleosome survival during transcription are proposed.

Keywords: RNA polymerase II; backtracking; chromatin; elongation; transcription.


Conflict of interest statement

The authors declare no conflict of interest.

Figures

Fig. S1.
Fig. S1.
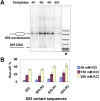
Pol II is arrested at positions +46/+48 during transcription through 601 nucleosome. (A) The experimental system for analysis of 601 nucleosomal barrier to Pol II transcription. Pol II elongation complex was assembled (1) and ligated to the 601 nucleosome (EC −41, 2). The numerical index of EC indicates the position of the Pol II active center (vertical line) relative to the promoter–proximal nucleosomal boundary. EC −5 was formed from EC −41 in the presence of ATP, CTP, and [α-32P] GTP (3). After addition of UTP, Pol II spontaneously pauses at the positions +46/+48. (B) Formation of Pol II EC +46/+48 on 601 nucleosomal template. Nonpermissive 601 nucleosomes were transcribed in the presence of indicated KCl concentrations. Pulse-labeled RNA transcripts were resolved by denaturing PAGE.
Fig. 1.
Fig. 1.
The R3 sequence dictates the strength of the polar barrier to transcription by Pol II. (A) Polar distribution of the polar barrier sequences (PBSs) within the nucleosomal DNA. The 601 and 603 sequences forming polar barriers to Pol II transcription are aligned according to their transcriptional orientations (permissive or nonpermissive). The regions of the 603 DNA where the sequence changes were introduced on different variants of the template (-R1, -R2, or -R3, shown in italics) are underlined. The nucleosomal dyad is indicated. In this work, all nucleosomes were transcribed in nonpermissive orientation. (B) Effect of mutations in the 603 -R1, -R2, or -R3 sequences on nucleosome-positioning properties, DNA–histone affinities, and the strength of the nucleosomal barrier to transcription. The thickness of the lines is directly proportional to the magnitude of the effect. See Fig. S2 for quantitative analysis. (C) After formation of a small intranucleosomal DNA loop on the surface of the nucleosome (1), Pol II likely initiates uncoiling of nucleosomal DNA, starting from the promoter–distal end (2), and eventually involving all nucleosomal DNA in front of the enzyme (3).
Fig. S2.
Fig. S2.
The R3 sequence dictates the strength of the polar barrier to transcription by Pol II. (A) The R2 sequence dictates the high-affinity DNA–histone interactions in the 603 nucleosome. Nucleosomes were reconstituted on labeled 226-bp DNA fragments containing intact and the modified (-R1, -R2, or -R3) 603 sequences in the presence of donor -H1 chromatin (ref. 16). -H1 chromatin also provides DNA that serves as a competitor for nucleosome formation. The nucleosomes were analyzed in a native gel. The fraction of histone-free DNA present in the sample is inversely proportional to DNA–histone affinity. M, end-labeled pBR322–MspI digest. (B) Mutations of 603-R3 sequence have a strong effect on the nucleosomal barrier to transcription. The variants of the nonpermissive 603 template were transcribed by Pol II in the presence of [α-32P] GTP. Run-off transcripts (full-length) produced on each template were analyzed by denaturing PAGE, quantified, and plotted.
Fig. 2.
Fig. 2.
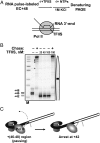
Pol II EC arrested at positions +46 and +48 backtracks by 4 or 6 bp. (A) Experimental approach for mapping positions of the active center of Pol II on DNA. Pol II can backtrack, disengaging the 3′ end of RNA from the active center. The extent of backtracking was measured using TFIIS to stimulate RNA cleavage by Pol II at the active center. (B) Analysis of pulse-labeled RNA by denaturing PAGE. The chase was conducted in the presence of all NTPs at 1 M KCl to disrupt the nucleosome and allow unimpeded transcription. Note: TFIIS was present at concentrations that do not induce Pol II backtracking, as evidenced by the lack of its effect on the length of multiple arrested transcripts (indicated by asterisks). (C) Pol II backtracking (shown by dashed arrow) could result in formation of a DNA gap between Pol II and the nucleosome.
Fig. 3.
Fig. 3.
DNA in the arrested +42 complex is partially uncoiled from the octamer upstream of Pol II. (A) Expected structures of the EC −5 and EC +42 (1 and 2) and accessibility of their DNA to various restriction endonucleases. Asterisks indicate the labeled DNA end. (B) Analysis of DNA sensitivity in the EC −5 and EC +42 to restriction endonucleases by native PAGE. Mobilities of the ECs, nucleosomes, and DNA in the gel are indicated. Mobility of EC +42 is indicated by arrowheads. Note that only EC +42 is sensitive to AflIII. All restriction enzymes are fully active, as indicated by complete digestion of histone-free DNA present in the samples (indicated by dots).
Fig. 4.
Fig. 4.
Close encounter of arrested RNAP with the nucleosome induces formation of DNase I-hypersensitive DNA sites. Analysis of ECs formed on the 601 nucleosome by DNase I footprinting. (A) The experimental approach. ECs −39, −5, and +42 formed on the DNA end-labeled template were DNase I treated, separated by native PAGE, and the DNA was purified and analyzed by denaturing PAGE. (B, Left) Analysis of the end-labeled DNA by denaturing PAGE. Position of the nucleosome on the template, shown by an oval nucleosomal dyad is indicated. Footprints of the ECs are shown by dotted lines. DNA upstream of EC +42 is highly sensitive to DNase I, suggesting that it is nearly fully uncoiled from the octamer. Positions of two hypersensitive sites (+96/+102) around the R3 region are indicated. (Right) Tight structure of the +42 complex and the presence of DNase I-hypersensitive DNA sites suggest that nucleosomal DNA likely recoils on the octamer after backtracking of RNAP (shown by dashed arrow). (C) Quantitative analysis of the footprints shown in B.
Fig. S3.
Fig. S3.
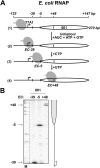
RNAP is arrested at position +48 during transcription through 601 nucleosome. (A) The experimental approach for stalling/arrest of the ECs formed by E. coli RNAP at unique positions on the 601 nucleosomal template. The sequence of the template allows EC progression to either −39 or −5 positions in the presence of different partial combinations of NTPs; the EC +48 is formed due to spontaneous arrest of RNAP in the nucleosome after transcription with all NTPs. (B) Analysis of pulse-labeled RNA in various ECs by denaturing PAGE. M, end-labeled pBR322–MspI digest. All ECs are >80% homogeneous and contain extendable RNA, suggesting that they are active.
Fig. S4.
Fig. S4.
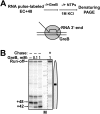
EC +48 backtracks by 6 bp. (A) Experimental approach for mapping of positions of the active center of RNAP on DNA. RNAP can backtrack, disengaging the 3′ end of RNA from the active center. The extent of backtracking was measured using GreB cleavage factor for E. coli RNAP to stimulate RNA cleavage in the active center. (B) Analysis of pulse-labeled RNA (E. coli RNAP) by denaturing PAGE. RNAP is arrested in a nucleosome-dependent manner at the position +48, backtracked by 6 bp to form EC +42, and can be reactivated by histone removal. The chase was conducted at 1 M KCl to disrupt the nucleosome and facilitate transcription.
Fig. 5.
Fig. 5.
Image processing of negatively stained EC +42. (A) Representative images corresponding to their respective class averages (B). (B) Class averages obtained by reference-free classification of particles. (С) Reprojections of 3D structure. (D) A 3D reconstruction of the +42 complex from negative-stain data. Views are produced with IMAGIC5. (Scale bar, 25 nm.)
Fig. 6.
Fig. 6.
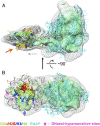
Structure of the elongation complex arrested in position +42 in nucleosome. (A) Reconstitution of the EC +42 by fitting of nucleosome core particle and E. coli RNAP EC structures (PDB 1KX5 and 4JKR, respectively) into the electron densities of the complex, determined after negative staining. The isosurface of the 3D reconstruction is shown with a higher or lower threshold in gray mesh or in green, respectively (Fig. 5). Nucleosomal DNA was connected to DNA localized downstream of the active center of RNAP. The RNAP and RNA are depicted in cyan and orange, respectively. Histones H3, H4, H2A, and H2B are colored in blue, green, yellow, and red, respectively. The gray dotted and orange arrows indicate direction of transcription and promoter–proximal H2A/H2B dimer exposed into solution, respectively. (B) The structure was rotated by ∼90° around the horizontal axis. The positions of DNaseI-hypersensitive sites on DNA are shown by asterisks. The nucleosomal dyad is indicated by purple diamond.
Fig. S5.
Fig. S5.
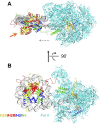
Model of Pol II EC +42 complex. (A) The bridge helix, the clamp, the C-terminal coiled coil, and the rest of the Pol II molecule are in orange, green, blue, and cyan, respectively. (B) The structure was rotated by ∼90° around the horizontal axis. Other designations are as in Fig. 6.
Fig. 7.
Fig. 7.
The mechanism of transcription through the critical +(45–50) region of a nucleosome. As Pol II enters a nucleosome and approaches a strong nucleosomal barrier (step 1), it is typically paused (2) or arrested (2′), depending on the sequence of nucleosomal DNA. Pol II can recover from arrest only with help of TFIIS that facilitates Pol II-induced RNA cleavage. Next, the DNA recoils behind the enzyme (3). In the complexes 2, 2′, and 3, bulk of Pol II overlaps with nucleosomal DNA (red asterisk), likely inducing tension in nucleosomal DNA that could drive partial unwrapping of promoter–distal end of nucleosomal DNA (4), inducing transition into the productive complex (5). DNA uncoiling can be strongly inhibited by sequence-dependent DNA–histone interactions. Further transcription typically results in nucleosome recovery on DNA. Fig. S6 shows detail.
Fig. S6.
Fig. S6.
The minimal kinetic scheme of Pol II transcription through the +(45–48) nucleosomal barrier. As Pol II enters a nucleosome and approaches a strong nucleosomal barrier [the +(70–80) and R3 sequences, red rectangles, step 1], it is arrested and could backtrack along DNA (1′). Backtracked state is strongly stabilized by recoiling of DNA on the open histone octamer surface (1′′). Bulk of Pol II collides with nucleosomal DNA, inducing formation of DNase I-hypersensitive sites on DNA (red arrows). Pol II can recover from arrest only with help of TFIIS that facilitates Pol II-induced RNA cleavage. A small fraction of the elongation complexes can form the Ø-loop–containing intermediate (2) where DNA structure is also distorted at the R3 region. Although Pol II can partially unwrap the promoter–distal end of nucleosomal DNA (3), transition into the productive complex (3′) is blocked by the R3 sequence. In the absence of the R3 sequence, FACT can facilitate transcription-induced uncoiling of nucleosomal DNA by transiently interacting with the DNA-binding surface of the promoter–distal H2A/H2B dimer (3′). Depending on the sequence of nucleosomal DNA, various steps during this process (12 or 33′) could be rate limiting during transcription through nucleosome. Other designations are as in Fig. 7.
Fig. S7.
Fig. S7.
Eigen images, produced as a result of multimeric statistical analysis (MSA) on aligned +42 complex particles.
Fig. S8.
Fig. S8.
(A) Comparison of geometries of superimposed ECs of T. thermophilus (PDB ID 2O5I, in blue) and of E. coli (PDB ID 4JKR, in cyan) RNAPs. (B) The structure was rotated by ∼90° around the horizontal axis. Other designations are as in Fig. 6.

References

    1. Smolle M, Workman JL, Venkatesh S. reSETting chromatin during transcription elongation. Epigenetics. 2013;8(1):10–15. - PMC - PubMed
    1. Das C, Tyler JK. Histone exchange and histone modifications during transcription and aging. Biochim Biophys Acta. 2013;1819(3-4):332–342. - PMC - PubMed
    1. Zentner GE, Henikoff S. Regulation of nucleosome dynamics by histone modifications. Nat Struct Mol Biol. 2013;20(3):259–266. - PubMed
    1. Kristjuhan A, Svejstrup JQ. Evidence for distinct mechanisms facilitating transcript elongation through chromatin in vivo. EMBO J. 2004;23(21):4243–4252. - PMC - PubMed
    1. Schwabish MA, Struhl K. Evidence for eviction and rapid deposition of histones upon transcriptional elongation by RNA polymerase II. Mol Cell Biol. 2004;24(23):10111–10117. - PMC - PubMed

Publication types

LinkOut - more resources