. 2015 Nov 3;112(44):E6048-57.
doi: 10.1073/pnas.1513771112. Epub 2015 Oct 12.

Glycine activated ion channel subunits encoded by ctenophore glutamate receptor genes

Affiliations

Glycine activated ion channel subunits encoded by ctenophore glutamate receptor genes

Robert Alberstein et al. Proc Natl Acad Sci U S A. .

Abstract

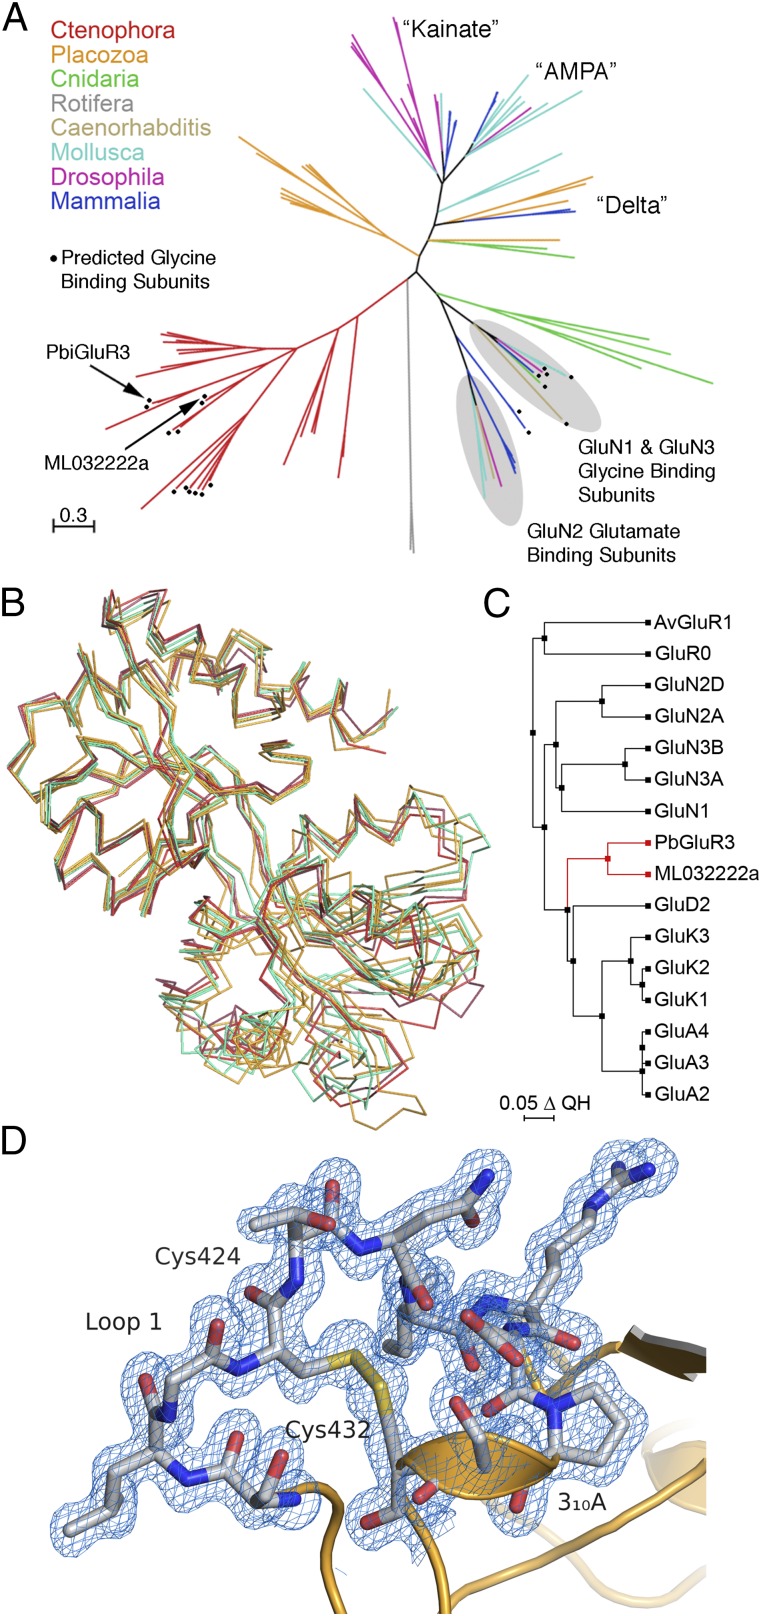
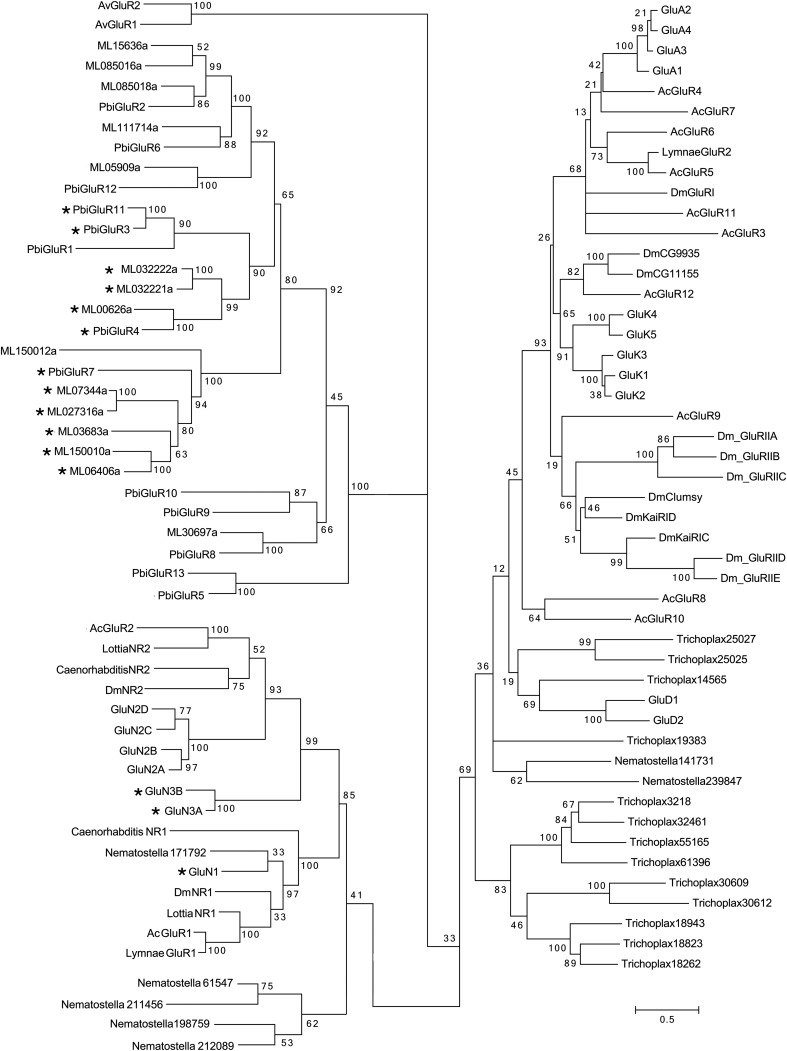
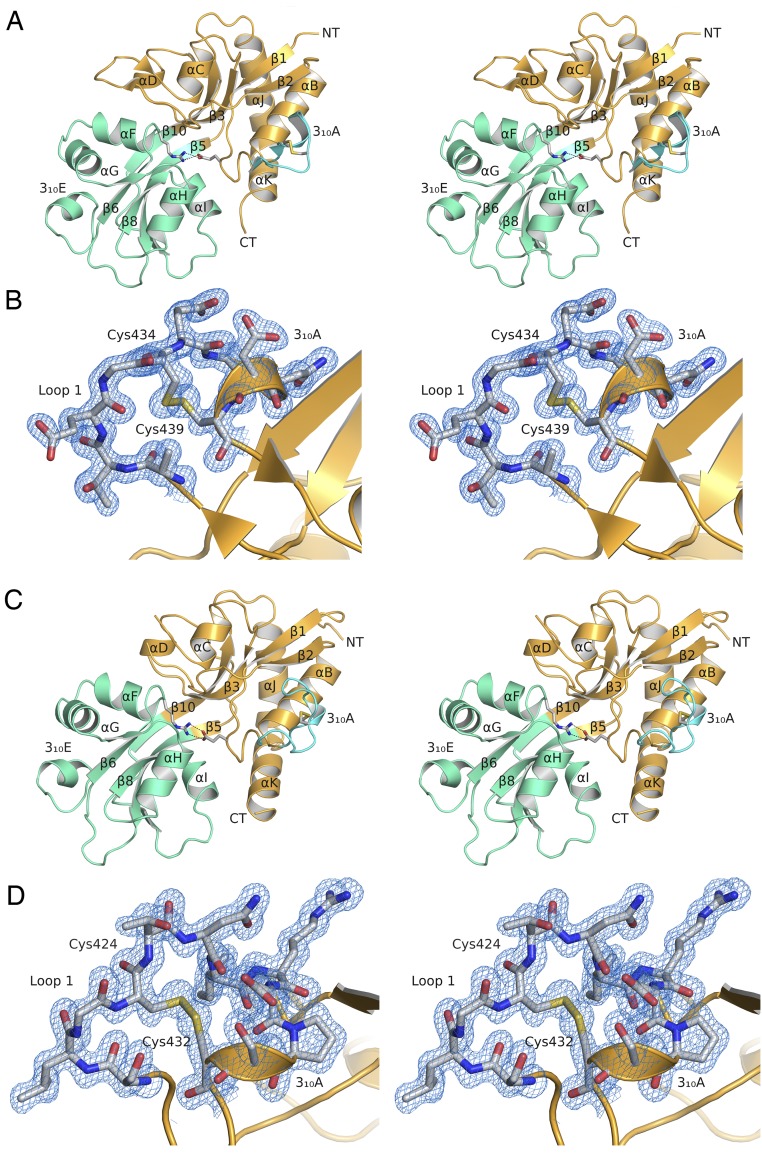
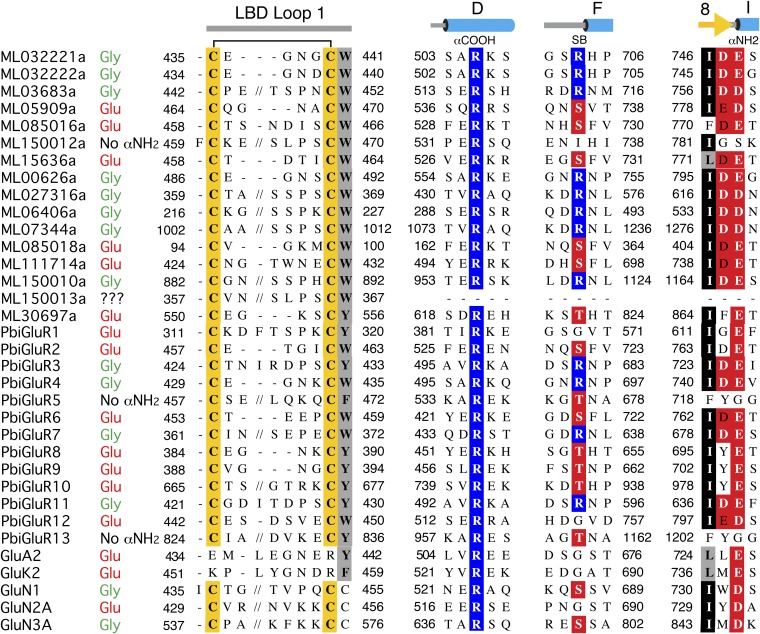
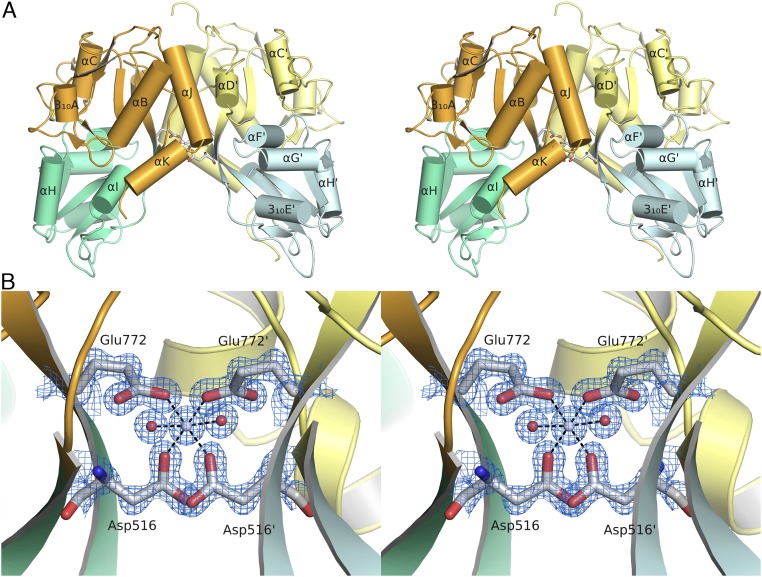
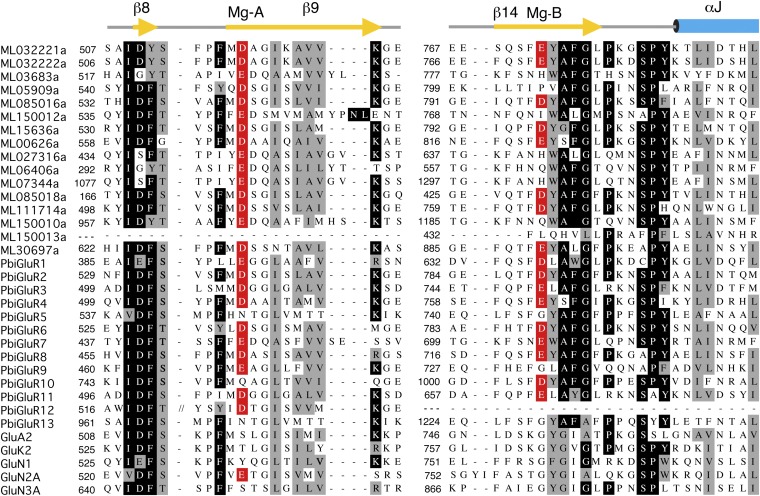
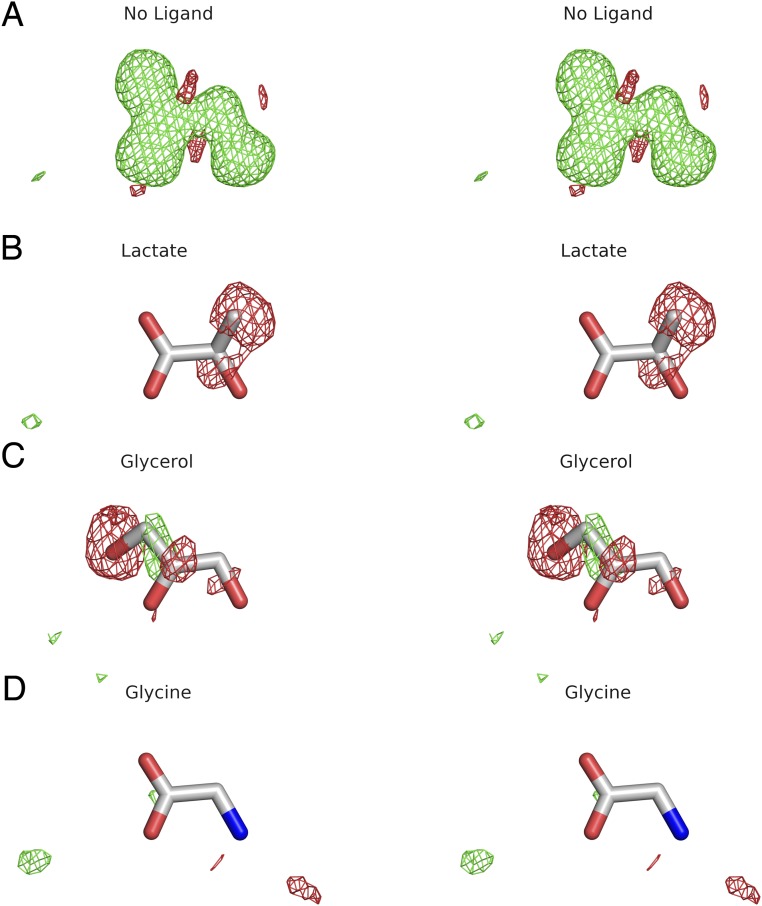
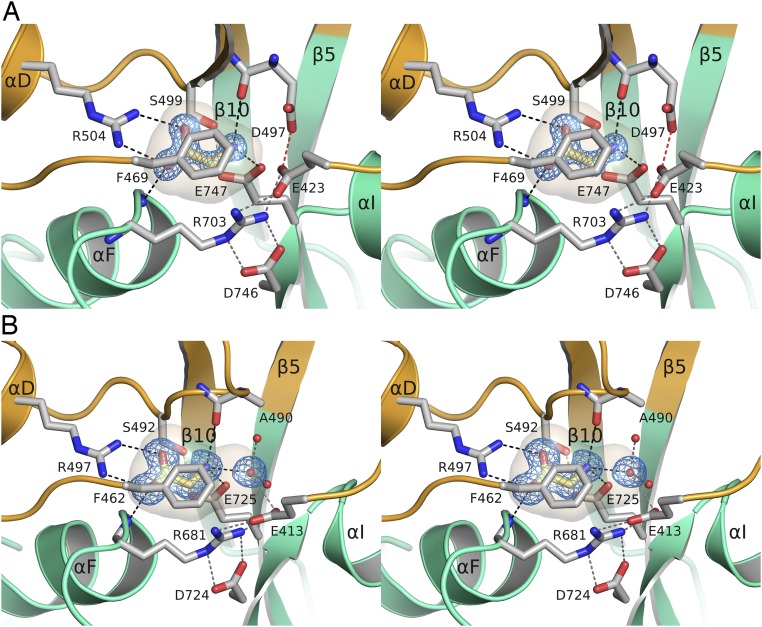
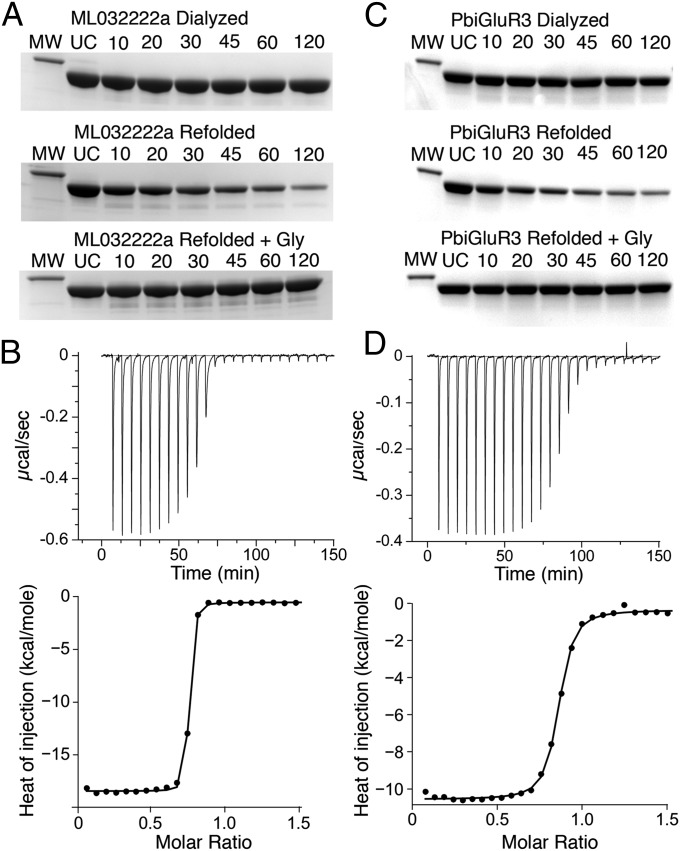
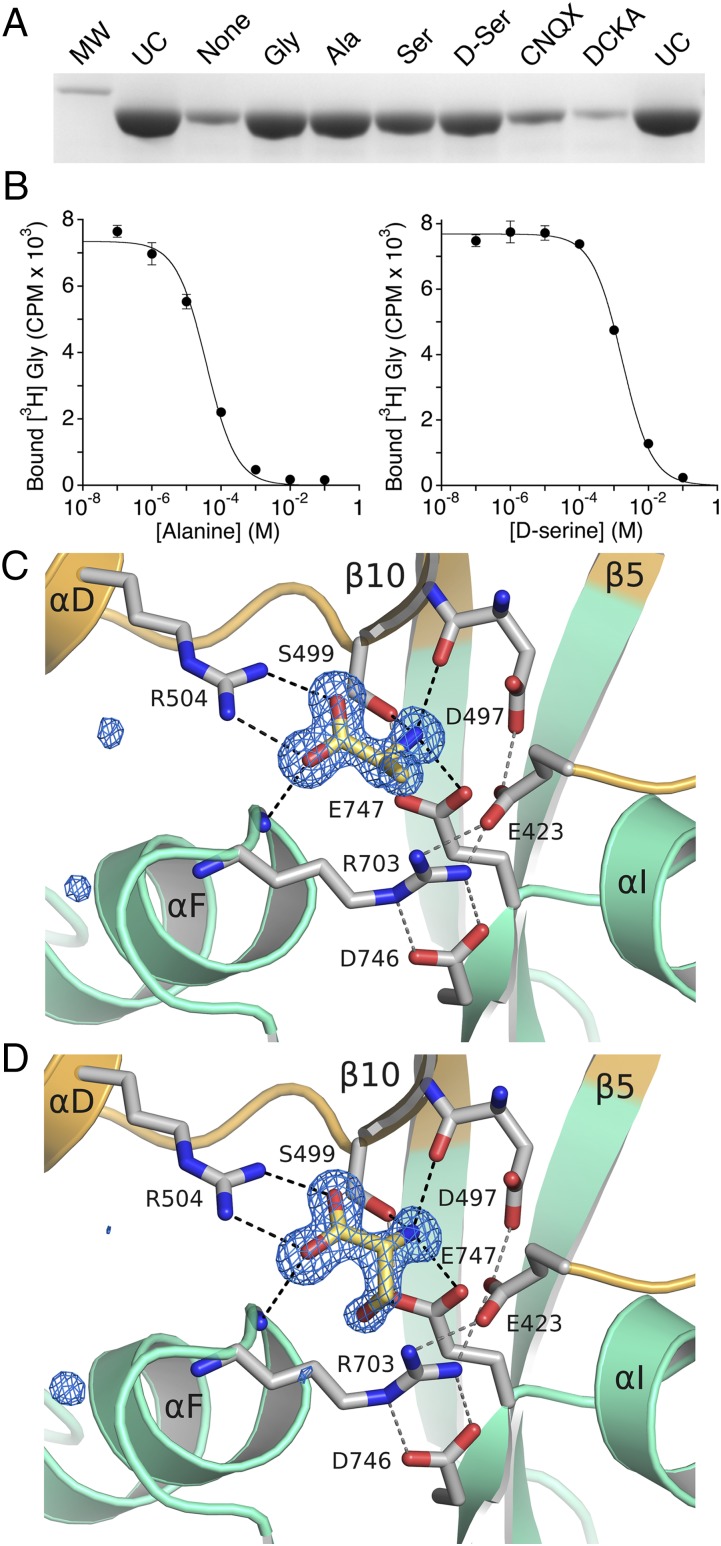
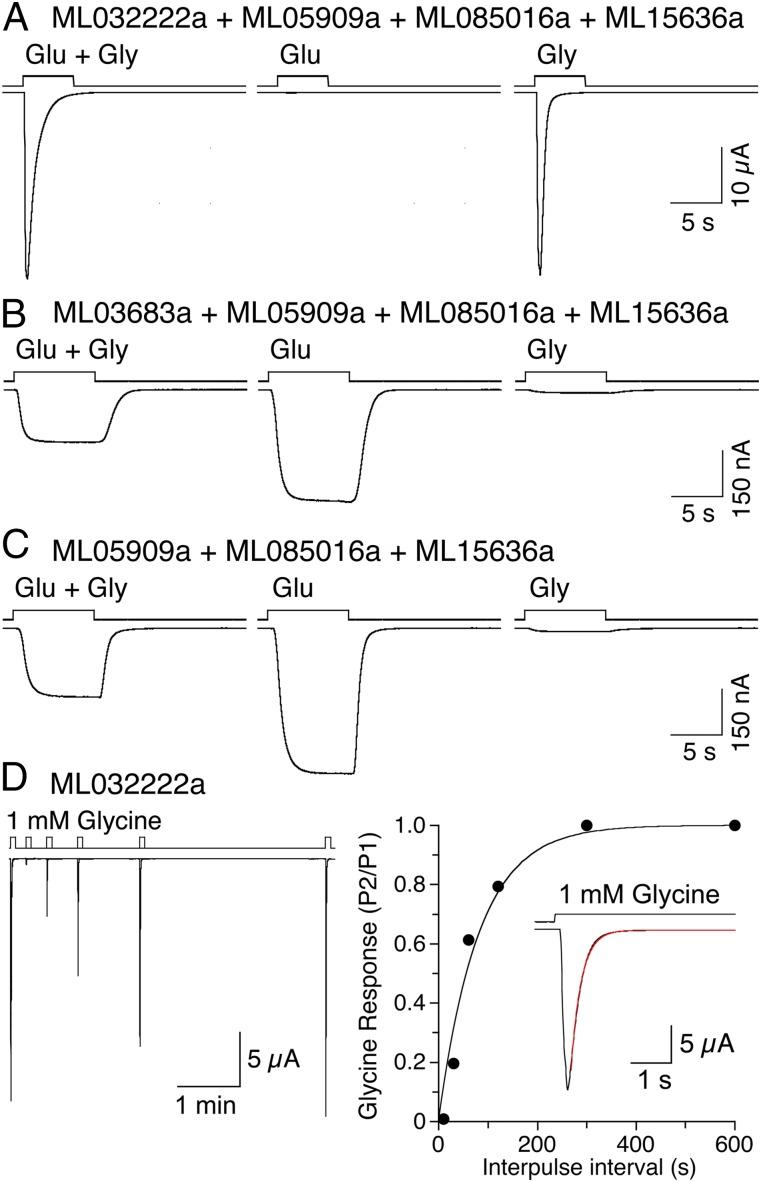
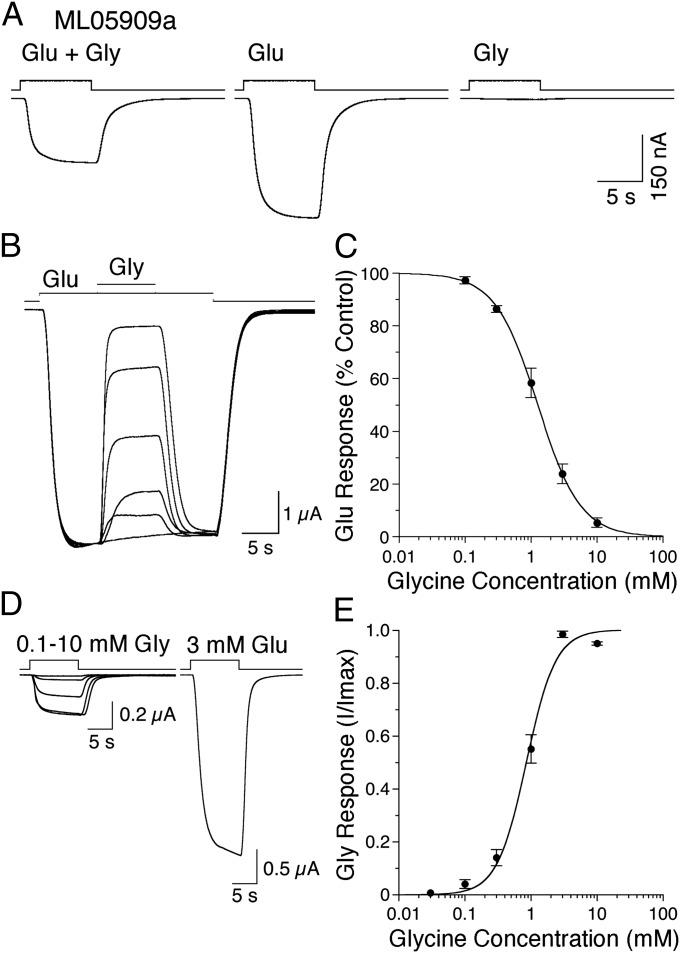
Recent genome projects for ctenophores have revealed the presence of numerous ionotropic glutamate receptors (iGluRs) in Mnemiopsis leidyi and Pleurobrachia bachei, among our earliest metazoan ancestors. Sequence alignments and phylogenetic analysis show that these form a distinct clade from the well-characterized AMPA, kainate, and NMDA iGluR subtypes found in vertebrates. Although annotated as glutamate and kainate receptors, crystal structures of the ML032222a and PbiGluR3 ligand-binding domains (LBDs) reveal endogenous glycine in the binding pocket, whereas ligand-binding assays show that glycine binds with nanomolar affinity; biochemical assays and structural analysis establish that glutamate is occluded from the binding cavity. Further analysis reveals ctenophore-specific features, such as an interdomain Arg-Glu salt bridge, present only in subunits that bind glycine, but also a conserved disulfide in loop 1 of the LBD that is found in all vertebrate NMDA but not AMPA or kainate receptors. We hypothesize that ctenophore iGluRs are related to an early ancestor of NMDA receptors, suggesting a common evolutionary path for ctenophores and bilaterian species, and suggest that future work should consider both glycine and glutamate as candidate neurotransmitters in ctenophore species.

Keywords: NMDA receptors; crystal structures; ctenophores; evolution.


Conflict of interest statement

The authors declare no conflict of interest.

Figures

Fig. 1.
Fig. 1.
Evolutionary analysis of ctenophore glutamate receptors. (A) Phylogenetic analysis for 100 iGluRs from a diverse range of animal species reveals clustering of ctenophore iGluRs in a unique branch on the maximum likelihood topology tree; black circles indicate ctenophore iGluRs predicted to bind glycine; the remaining ctenophore iGluRs likely bind glutamate; the branch length scale bar indicates the number of substitutions per site. (B) CA traces for which loop1 and loop 2 coordinates are not shown, following least squares superpositions using core domain 1 CA coordinates for the LBD crystal structures of ML032222a and PbiGluR3 (red); GluA2, GluK2 and GluN2A (orange); GluN1 and GluN3A (green). (C) Phylogenetic tree calculated using structural alignments for 16 iGluR LBD crystal structures. (D) Electron density map (1.5-Å resolution 2mFo-DFc contoured at 1 σ) for the disulfide bond in loop 1 of PbiGluR3.
Fig. S1.
Fig. S1.
Phyologenetic analysis with bootstrap values for 100 iGluRs from which the cladogram shown in Fig. 1A was generated. *Candidate glycine binding subunits.
Fig. S2.
Fig. S2.
(A) Amino acid sequence alignments for representative vertebrate iGluR subunits and nine ctenophore iGluR subunits selected for expression of LBD S1S2 constructs. Key structural features include a conserved disulfide bond between α-helix 2 and the flap loop in the ATD; an Arg residue in α-helix D of the LBD that binds the ligand α-COOH group; and pre-M1 and M1 transmembrane α-helices. Also indicated is a Cys rich intracellular loop between ion channel α-helices M1 and M2 that is unique to ctenophore iGluRs, and the Glu residue (SB) that forms an interdomain salt bridge in a subset of ctenophore iGluRs. (B) Amino acid sequence alignments for the M2, M3, and M4 transmembrane α-helices and a conserved disulfide bond in domain 2 of the LBD after α-helix I. The RNA editing (Q/R) and +4 sites which are determinants of ion channel block by cytoplasmic polyamines are indicated.
Fig. S3.
Fig. S3.
Stereoviews of ctenophore iGluR LBD crystal structures. (A) Ribbon diagram for ML032222a with domains 1 and 2 of the LBD colored gold and green, respectively; loop 1 is shown in cyan. Stick representation is used to show residues forming a disulfide bond in loop 1, and the salt bridge linking domains 1 and 2. (B) Stereoview of a ML032222a 2mFo-DFc electron density map at 1.21-Å resolution for the disulfide bond in loop 1 contoured at 1 σ. (C) Ribbon diagram for PbiGluR3 colored as described above. Note that in both structures domain 2 contains a six residue 310 helix. (D) Stereoview of a PbiGluR3 2mFo-DFc electron density map at 1.5-Å resolution for the disulfide bond in loop 1 contoured at 1 σ. funnel leading to the binding site.
Fig. S4.
Fig. S4.
Amino acid sequence alignments for the LBDs of 14 M. leidyi iGluR subunits, 13 P. bachei iGluR subunits, and 5 representative vertebrate iGluR subunits, showing conserved structural features including a conserved disulfide bond in loop 1 of ctenophore and NMDA receptors, but not AMPA or kainate receptors. Additional structural features include an Arg residue in α-helix D of the LBD that binds the ligand α-COOH group, and the acidic residue in β-strand 8 that forms an ion pair interaction with the ligand α-NH2 group; in the ligand column, no α-NH2 indicates that the ligand is unlikely to be an α-amino acid because these subunits lack the conserved acidic residue in β-strand 8 that binds the ligand α-NH2 group of Gly and Glu. The candidate ligand assigned based on the presence of an Arg residue at the N terminus of helix F that forms an interdomain salt bridge in ctenophore iGluRs with an Asp residue in β-strand 8 that is indicated in bold white type.
Fig. 2.
Fig. 2.
The ML032222a LBD dimer assembly encodes a binding site for Mg2+. (A) Ribbon diagram for the ML032222a dimer crystal structure, with the upper lobes of the LBD colored gold and pale yellow, and the lower lobes colored green and pale cyan, respectively; at the base of the upper lobes side chains drawn in stick representation show the location of the Mg2+ binding site. (B) A 1.21-Å resolution mFo-DFc electron density glycine omit map contoured at 2 σ showing the twofold symmetric coordination of the bound Mg2+ ion by two water molecules and the side chains of Asp516 and Glu772.
Fig. S5.
Fig. S5.
The ML032222a LBD dimer assembly contains an Mg2+ binding site. (A) Stereoview of the LBD dimer assembly with domains 1 and 2 colored gold and green for subunit 1, and pale yellow and pale blue for subunit 2, respectively; the binding site for Mg2+ at the base of the dimer assembly is shown using stick representation. (B) Stereoview of a 2mFo-DFc electron density map contoured at 2.2 σ, showing coordination of the Mg2+ ion by the side chains of Asp516, Glu772, and two water molecules.
Fig. S6.
Fig. S6.
Amino acid sequence alignments for the LBDs of 14 M. leidyi iGluR subunits, 13 P. bachei iGluR subunits, and 5 representative vertebrate iGluR subunits, showing conservation of acidic residues that form an Mg2+ binding site in the LBD dimer assembly of a subset of ctenophore iGluRs. Site A is located at the start of β-strand 9; in site B, located in β-strand 14 the vertebrate iGluRs all contain a Gly residue.
Fig. 3.
Fig. 3.
Unique structural elements in ctenophore iGluR glycine binding subunits. (A) Crystal structure of the ML032222a binding pocket, with a 1.21-Å resolution mFo-DFc electron density omit map for endogenous glycine contoured at 5 σ; secondary structure elements for the S1 and S2 segments are colored gold and green, respectively; side chains involved in ligand binding and interdomain contacts are drawn in stick representation, with ion pair and hydrogen bond contacts drawn as dashed lines. (B) Crystal structure of the PBiGluR3 binding pocket, colored as above, with a 1.53-Å resolution mFo-DFc electron density omit map for endogenous glycine contoured at 5 σ. (C) Sequence alignment for the nine ctenophore iGluRs selected for study and five representative vertebrate iGluRs highlighting interdomain salt bridge residues unique to ctenophore glycine binding subunits.
Fig. S7.
Fig. S7.
Stereoviews of mFo-DFc omit maps for the ligand binding site of ML032222a contoured at ±3 σ following refinement with (A) no ligand; (B) lactate; (C) glycerol; and (D) glycine.
Fig. S8.
Fig. S8.
Stereoviews of ctenophore iGluR ligand binding sites showing the ligand binding cavity, the endogenous bound glycine ligand, and the interdomain salt bridge. (A) Ribbon diagram for ML032222a with domains 1 and 2 of the LBD colored gold and green, respectively; stick representation is used to show the bound glycine ligand, residues forming the binding site, and the salt bridge linking domains 1 and 2, with a 2mFo-DFc electron density map at 1.21-Å resolution contoured at 2 σ for the glycine ligand; the ligand binding cavity is shown as a transparent surface capped by Phe-469. (B) Ribbon diagram for PbiGluR3 colored as described above, showing a 2mFo-DFc electron density map at 1.5-Å resolution contoured at 1 σ for the glycine ligand and a water molecule at the entrance to the binding site, which is connected by hydrogen bonds to the side chain carboxyl group of Glu-413, and two water molecules in a funnel leading to the binding site.
Fig. 4.
Fig. 4.
Ctenophore iGluR subunits bind glycine with nM affinity. (A) Proteolysis protection assays for purified ML032222a S1S2; lanes show a 31-kDa marker (MW), uncut protein (UC), and samples at the indicated times in min after addition of trypsin, with exhaustively dialyzed protein (Top), refolded protein (Middle), and refolded protein with 1 mM glycine (Bottom). (B) Titration of refolded ML032222a by glycine analyzed by ITC, with raw (Upper) and integrated (Lower) data fit with a binding isotherm of Kd of 2.3 nM. (C) Proteolysis protection assays for purified PbiGluR3 S1S2 using the same loading protocols as for ML032222a. (D) Titration of refolded PbiGluR by glycine analyzed by ITC, with raw (Upper) and integrated (Lower) data fit with a binding isotherm of Kd of 31 nM.
Fig. 5.
Fig. 5.
Ligand binding profile for ML032222a. (A) Proteolysis protection assays for refolded ML032222a S1S2 using a series of ligands that bind to vertebrate NMDA receptor glycine binding subunits; lanes show a 31-kDa marker (MW), uncut protein (UC), and samples with 1 mM concentrations of the indicated ligands. (B) Equilibrium dose inhibition curves for displacement of [3H]-glycine by l-alanine, Ki 37 µM, and d-Serine, Ki 1.7 mM. (C) Crystal structure of the ML032222a alanine complex, with a 1.4-Å resolution mFo-DFc electron density omit map contoured at 5 σ; secondary structure elements for the S1 and S2 segments are colored gold and green, respectively; the ligand and side chains involved in ligand binding and interdomain contacts are drawn in stick representation, with ion pair and hydrogen bond contacts drawn as dashed lines. (D) Crystal structure of the ML032222a d-serine complex, colored as above, with a 1.38-Å resolution mFo-DFc electron density omit map contoured at 5 σ.
Fig. S9.
Fig. S9.
Stereoview of the ML032222a l-serine complex with domains 1 and 2 of the LBD colored gold and green, respectively; stick representation is used to show the bound l-serine ligand, residues forming the binding site, and the salt bridge linking domains 1 and 2, with the ligand binding cavity shown as a transparent surface; the 2mFo-DFc electron density map calculated following refinement with mixed occupancy by l-serine and glycine is contoured at 1.25 σ and shows weak density for the CB and OG atoms; the side chain of Arg703 was refined in two conformations, with that for the glycine complex shown using transparent shading. Below this are shown mFo-DFc electron density maps contoured at ±3 σ following refinement with no ligand (Top), l-serine (Middle), and glycine (Bottom), all at full occupancy.
Fig. 6.
Fig. 6.
Activation of ctenophore iGluRs by glutamate and glycine. (A) Responses to 10 mM glutamate and 1 mM glycine for a mix of ML032222a and three candidate glutamate binding subunits recorded using two electrode voltage clamp for Xenopus oocytes injected with the indicated cRNAs. (B) Responses to 10 mM glutamate and 1 mM glycine for a mix of ML03683a and the same candidate glutamate binding subunits. (C) Responses to 10 mM glutamate and 1 mM glycine for a mix of only the three candidate glutamate binding subunits. (D) Response of ML032222a alone to 1 mM glycine measured using a twin pulse protocol (Left), with the rate of recovery from desensitization fit with a single exponential function of time constant 81 s (Right); Inset shows the rate on onset of desensitization fit with a single exponential function of time constant 380 ms.
Fig. 7.
Fig. 7.
Glycine is a weak partial agonist for ML05909a. (A) Responses for ML05909a to 10 mM glutamate and 1 mM glycine, applied in combination and separately. (B) Concentration-dependent inhibition of responses to 10 mM glutamate by 0.1–10 mM glycine. (C) Concentration inhibition plot for glycine fit with the Hill equation; data points show mean ± SD. (D) Maximal activation of ML05909a by glycine produces smaller responses than those to glutamate. (E) Concentration activation plot for glycine fit with the Hill equation; data points show mean ± SD.
Fig. 8.
Fig. 8.
Glycine-activated currents for ML032222a show biphasic rectification. (A) Current-voltage plot for the response to 100 µM glycine recorded from the ML032222a K505C/S789C double mutant, with an extracellular solution containing 100 µM Ca2+ and 1 mM Mg2+ to suppress activation of endogenous calcium activated chloride currents. (B) Conductance voltage plot fit with a Boltzman function, with Vb = −5.4 mV and kb = 15.7 mV (red line).

References

    1. Croset V, et al. Ancient protostome origin of chemosensory ionotropic glutamate receptors and the evolution of insect taste and olfaction. PLoS Genet. 2010;6(8):e1001064. - PMC - PubMed
    1. Liebeskind BJ, Hillis DM, Zakon HH. Convergence of ion channel genome content in early animal evolution. Proc Natl Acad Sci USA. 2015;112(8):E846–E851. - PMC - PubMed
    1. Srivastava M, et al. The Trichoplax genome and the nature of placozoans. Nature. 2008;454(7207):955–960. - PubMed
    1. Ryan JF, et al. NISC Comparative Sequencing Program The genome of the ctenophore Mnemiopsis leidyi and its implications for cell type evolution. Science. 2013;342(6164):1242592. - PMC - PubMed
    1. Moroz LL, et al. The ctenophore genome and the evolutionary origins of neural systems. Nature. 2014;510(7503):109–114. - PMC - PubMed

Publication types

LinkOut - more resources