. 2015 Nov 3;112(44):13687-92.
doi: 10.1073/pnas.1517629112. Epub 2015 Oct 12.

Bursts of beta oscillation differentiate postperformance activity in the striatum and motor cortex of monkeys performing movement tasks

Affiliations

Bursts of beta oscillation differentiate postperformance activity in the striatum and motor cortex of monkeys performing movement tasks

Joseph Feingold et al. Proc Natl Acad Sci U S A. .

Abstract

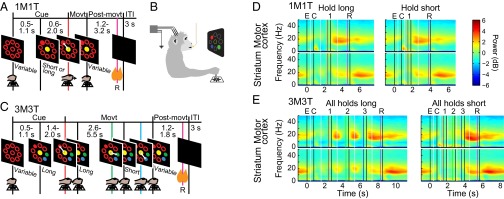
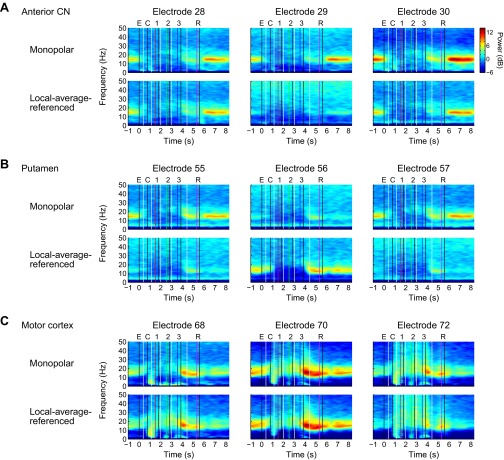
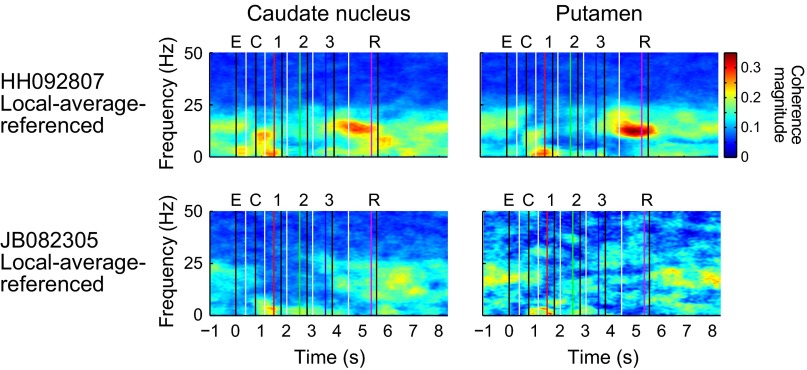
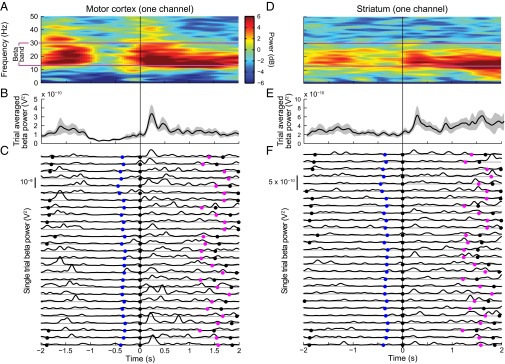
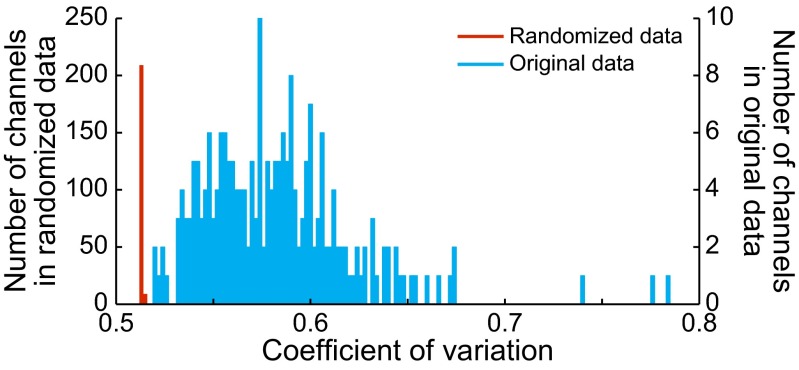
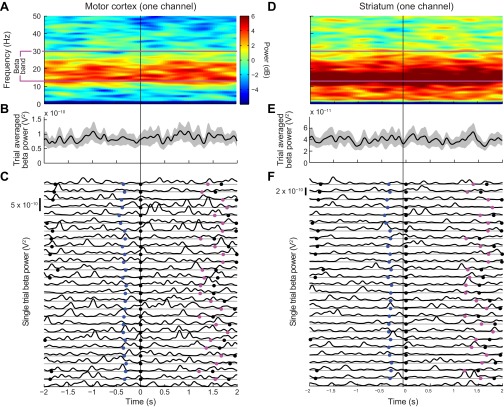
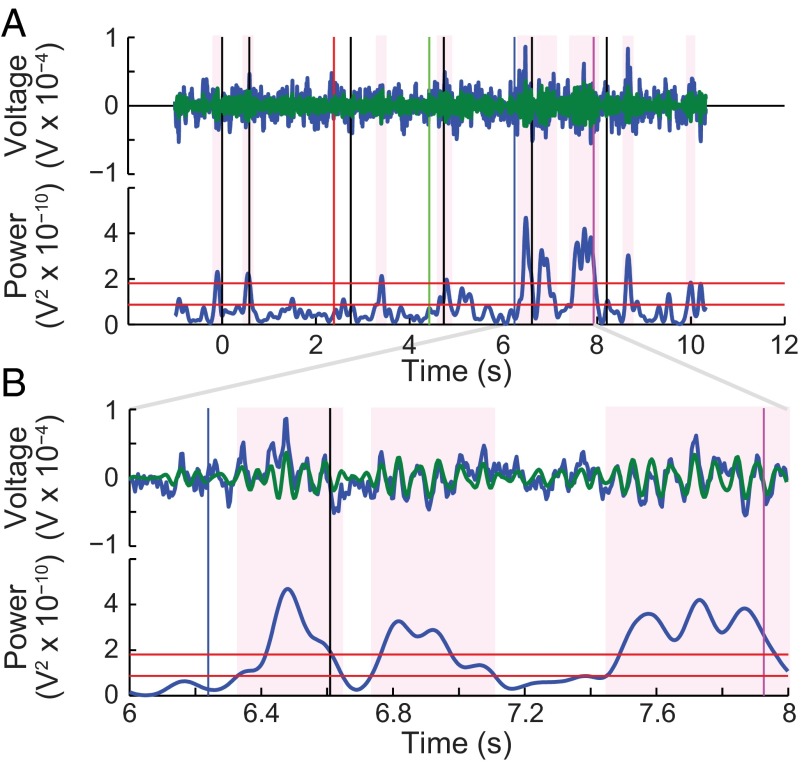
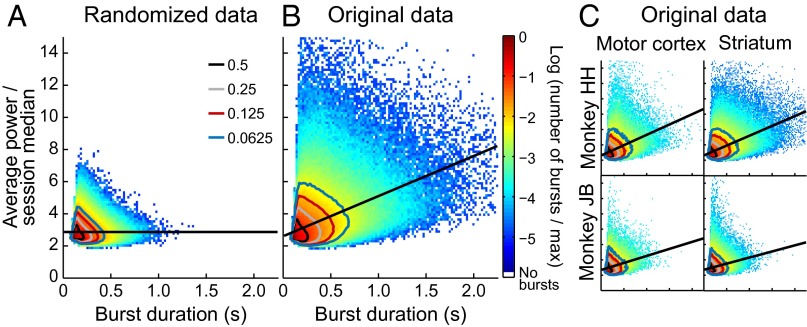
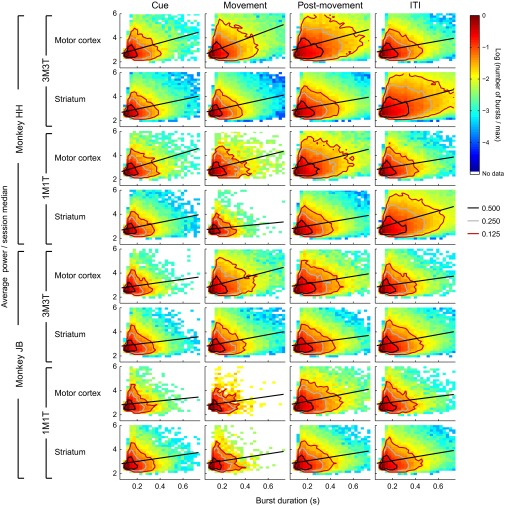
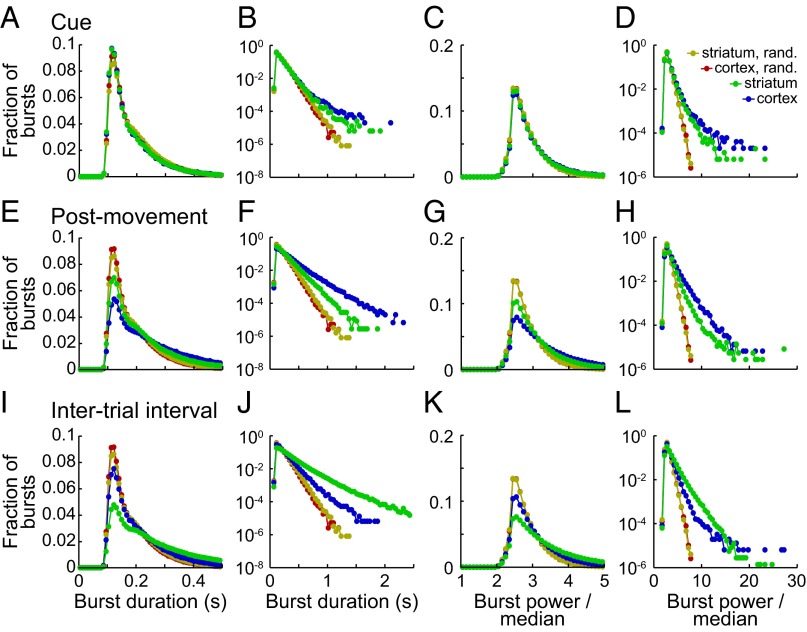
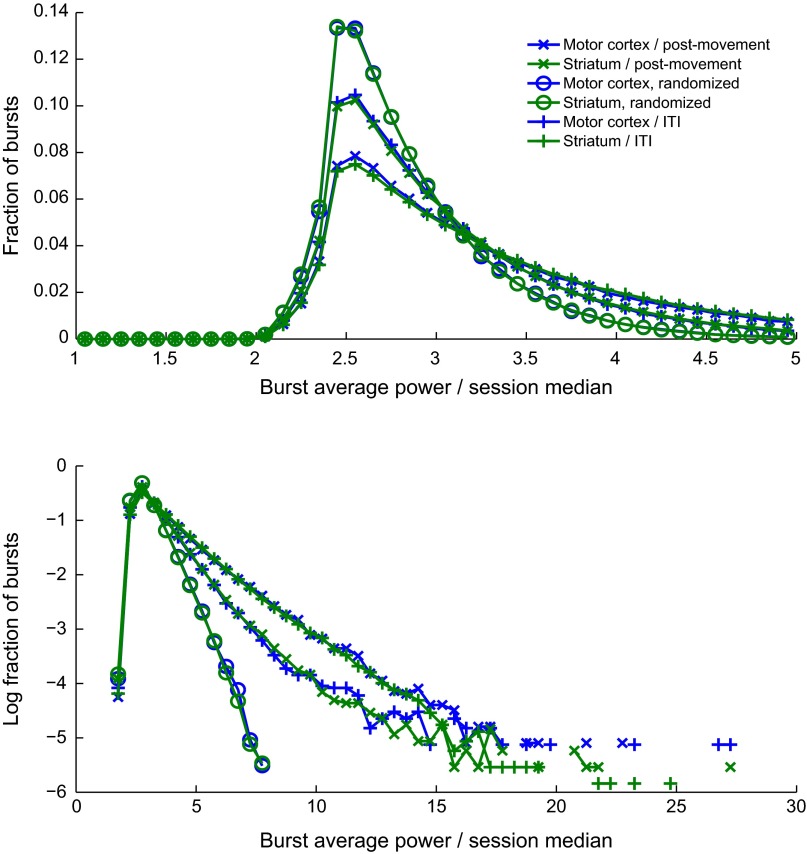
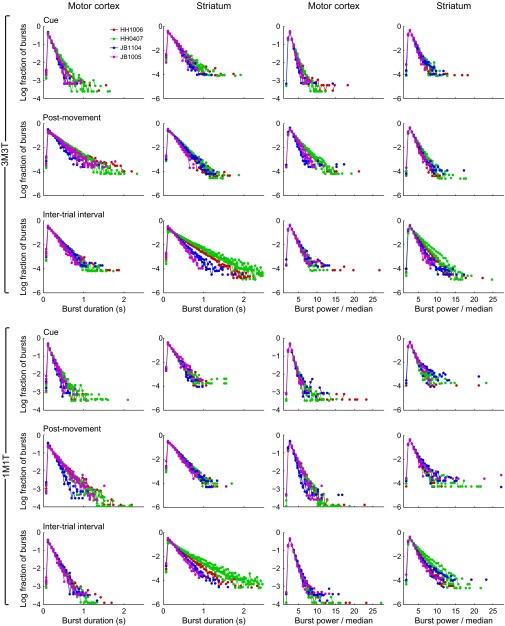
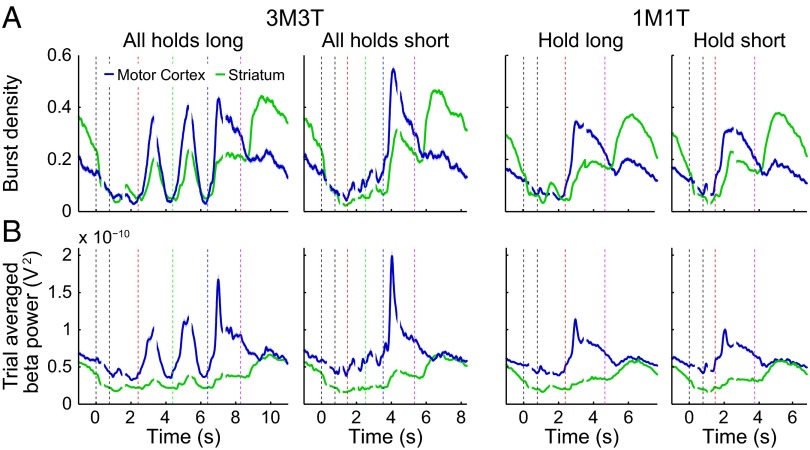
Studies of neural oscillations in the beta band (13-30 Hz) have demonstrated modulations in beta-band power associated with sensory and motor events on time scales of 1 s or more, and have shown that these are exaggerated in Parkinson's disease. However, even early reports of beta activity noted extremely fleeting episodes of beta-band oscillation lasting <150 ms. Because the interpretation of possible functions for beta-band oscillations depends strongly on the time scale over which they occur, and because of these oscillations' potential importance in Parkinson's disease and related disorders, we analyzed in detail the distributions of duration and power for beta-band activity in a large dataset recorded in the striatum and motor-premotor cortex of macaque monkeys performing reaching tasks. Both regions exhibited typical beta-band suppression during movement and postmovement rebounds of up to 3 s as viewed in data averaged across trials, but single-trial analysis showed that most beta oscillations occurred in brief bursts, commonly 90-115 ms long. In the motor cortex, the burst probabilities peaked following the last movement, but in the striatum, the burst probabilities peaked at task end, after reward, and continued through the postperformance period. Thus, what appear to be extended periods of postperformance beta-band synchronization reflect primarily the modulated densities of short bursts of synchrony occurring in region-specific and task-time-specific patterns. We suggest that these short-time-scale events likely underlie the functions of most beta-band activity, so that prolongation of these beta episodes, as observed in Parkinson's disease, could produce deleterious network-level signaling.

Keywords: basal ganglia; beta band; local field potentials; sequential movement; synchronization.


Conflict of interest statement

The authors declare no conflict of interest.

Figures

Fig. 1.
Fig. 1.
Overview of tasks and power spectra. (A and C) Task timelines. (B) Monkey’s position during the task. (D and E) Average LFP spectrograms calculated over all correct trials of 1M1T (D) and 3M3T (E) tasks across two monkeys for each region, using a 1-s moving window. Power is shown in decibels relative to a 1/f1.5 curve fitted to each channel. White vertical lines mark the boundaries between panels aligned to different task events. Colored vertical lines mark task events: empty targets on (E, black); colored cue targets on (C, black); first movement (1, red); second movement (2, green); third movement (3, blue); reward delivery (R, purple); ends of movements or reward delivery (unlabeled, black).
Fig. S1.
Fig. S1.
Grid maps illustrating electrode placements in the mediolateral (ML) versus anteroposterior (AP) plane as viewed from above, for two implants in monkey HH (A) and in monkey JB (B). Each circle with a number inside designates one electrode. The fill colors show how electrodes were grouped for analysis, as indicated in the color legends. Those with no fill color were not used owing to defects in placement and/or signal quality. CN electrodes were divided into an anterior group (CNa) and a posterior group (CNp) at AP 19.5 for monkey HH, but not for monkey JB.
Fig. S2.
Fig. S2.
Examples of spectrograms generated with monopolar and local-average-referenced signals for one session from each monkey (session HH092807 from implant HH0407 and session JB082305 from implant JB1104; see grid maps in Fig. S1). Although there was considerable variation between the monopolar and local-average-referenced spectrograms on individual electrodes (Fig. S4), the results shown here of averaging over all of the electrodes within each region were remarkably similar. As would be expected based on the rule of thumb that volume-conducted signals tend to be greatest at low frequencies, here the greatest differences between the monopolar and local-average-referenced signals manifest predominantly below 10 Hz.
Fig. S3.
Fig. S3.
Spectrograms for subregions of striatum. (A) From monopolar signals, averaged over all sessions for each monkey. In monkey HH, the CN was divided into an anterior region spanning AP 20–26 and a posterior region spanning AP 14–19 (Fig. S1). In monkey JB, spectrograms were averaged over all channels in the CN, spanning AP 14.6–27.6. For the average over the two monkeys, data from anterior CN and posterior CN recorded in monkey HH were averaged first, and the results were averaged with CN data recorded in monkey JB. (B) From local-average-referenced signals, averaged within a single session from each monkey.
Fig. S4.
Fig. S4.
Monopolar and local-average-referenced signals for three adjacent individual electrodes from each region in one session (HH092807). (A) Anterior CN. Spectrograms of monopolar signals were similar on all three channels, whereas the local-average-referenced signals show that the oscillatory activity on electrode 29 was common to all electrodes in the region, likely owing in large part to volume conduction from sources outside the region. This observation suggests that oscillatory activity in the striatum may be present or absent depending on the exact location, to a precision of ≤1 mm, a spatial scale comparable with known anatomic features (41). The average of the local-average-referenced signals shown in Fig. S2 closely resembles the average of the monopolar signals at frequencies above 10 Hz, suggesting that the monopolar recordings may have in effect performed a physical averaging of the current sources over a larger volume of tissue, as theoretically might be expected. Note the wider color scale than the scales used in average spectrograms. (B) Putamen. There appears to be a local beta-band current source near electrode 56 (the middle electrode), but very little beta-band activity near the neighboring electrodes 55 and 57 located 1 mm to each side. The beta-band activity confined to electrode 56 bears a striking resemblance to the activity at electrode 70 in the motor cortex; however, further investigation is needed to determine whether this constitutes evidence of functional connectivity. (C) Motor cortex. Local average referencing generally may make less difference in the neocortex than in the striatum, given that the electrodes were displaced from each other roughly tangentially to the cortical surface, whereas synaptic currents flow predominantly radially.
Fig. S5.
Fig. S5.
Time-frequency plots showing coherence between motor cortex and striatum for the two sessions for which local-average-referenced signals were computed. CN electrodes were limited to the anterior region (anterior to AP19.5) of the CN, and were analyzed separately from those in the putamen. Coherence was computed for each electrode pair comprising one motor cortical electrode and one striatal electrode.
Fig. 2.
Fig. 2.
Examples of LFP activity recorded on individual channels from motor cortex (A–C) and striatum (D–F) in one session from 2 s before until 2 s after the end of the third (final) movement. (A and D) Spectrograms averaged over 27 correct 3M3T trials with the long-long-long hold sequence and the up/left-down-left spatial sequence, with power coded as in Fig. 1. Purple lines denote the beta band. The color scale in A applies to D as well. (B and E) Time course of average power in the 13–30 Hz pass band (black lines) with 95% confidence limits (gray shading). (C and F) Smoothed power traces for each of the 27 trials. The gray horizontal lines below each trace represent zero power. Blue, purple, and black dots mark the onset of third movement, reward delivery, and end of movements/reward delivery, respectively.
Fig. 3.
Fig. 3.
Distributions of the CV of beta-band power across all channels in all sessions of both monkeys (blue), and across their phase-randomized counterparts (red). Owing to the extreme disparity in the shapes of the two distributions, a different vertical scale is used for each one.
Fig. S6.
Fig. S6.
Same analyses as in Fig. 2, but for phase-randomized control signals. (A and D) Spectrograms averaged over 27 trials, with power coded as in Fig. 1. (B and E) Time course of average power in the 13–30 Hz pass band (black lines) with 95% confidence limits (gray shading). (C and F) Smoothed power traces for each of the 27 trials.
Fig. 4.
Fig. 4.
Procedure for measuring beta bursts illustrated for LFP recorded in the motor cortex in a single trial. Events are shown as in Fig. 1. (A, Upper) Raw LFP (blue) and beta bandpass-filtered LFP (green) superimposed. (Lower) Beta-band power together with red horizontal lines at the two thresholds used (1.5 times and 3 times the median power, respectively). Shading indicates individual burst periods. (B) Same data as in A on an expanded time scale.
Fig. 5.
Fig. 5.
Joint distribution of duration and power values across all marked beta bursts in the dataset. Contour lines show the boundaries of the tails containing one-half (black), one-quarter (gray), one-eighth (red), and one-sixteenth (blue) of the counts. Straight black lines show least squares fits. (A) Phase-randomized control channels. (B) Actual (nonrandomized) LFPs. (C) Same data as in B, but plotted separately for monkey and brain region.
Fig. S7.
Fig. S7.
Further breakdown of the data shown in Fig. 5 into each combination of monkey, task, brain region, and task period.
Fig. 6.
Fig. 6.
Histograms showing the distributions of duration and power of bursts with peaks detected during the cue period (A–D), postmovement period (E–H), and ITI (I–L). Data were aggregated across both tasks and both monkeys for the motor cortex (blue) and striatum (green). Plots are paired, with the peaks of the distributions on a fine scale on the left and the logarithms of the distributions on a coarse scale on the right. The first two columns show durations, and the last two show power averaged over the whole burst. Results aggregated across all task periods are also shown for the phase-randomized counterparts of the signals from motor cortex (red) and striatum (gold).
Fig. S8.
Fig. S8.
Results from Fig. 6, replotted to facilitate comparison of beta bursts between the postmovement period and the ITI.
Fig. S9.
Fig. S9.
Same analyses as in Fig. 6, but broken down by task and by session. Each session is shown as a single curve. Sessions recorded from the same implant share the same color, as indicated in the legend. The first two characters of each implant ID designate the monkey.
Fig. 7.
Fig. 7.
Burst density (A) and beta-band power (13–30 Hz; B) averaged over trials for two timing patterns in each task. Breaks in traces mark the boundaries between panels that were aligned to different task events. Event markers are colored as in Fig. 1. Shading shows ±2 SEM.

References

    1. Neuper C, Wortz M, Pfurtscheller G. ERD/ERS patterns reflecting sensorimotor activation and deactivation. Prog Brain Res. 2006;159:211–222. - PubMed
    1. Stancak A, Jr, Pfurtscheller G. Event-related desynchronisation of central beta-rhythms during brisk and slow self-paced finger movements of dominant and nondominant hand. Brain Res Cogn Brain Res. 1996;4(3):171–183. - PubMed
    1. Sanes JN, Donoghue JP. Oscillations in local field potentials of the primate motor cortex during voluntary movement. Proc Natl Acad Sci USA. 1993;90(10):4470–4474. - PMC - PubMed
    1. Rubino D, Robbins KA, Hatsopoulos NG. Propagating waves mediate information transfer in the motor cortex. Nat Neurosci. 2006;9(12):1549–1557. - PubMed
    1. Reimer J, Hatsopoulos NG. Periodicity and evoked responses in motor cortex. J Neurosci. 2010;30(34):11506–11515. - PMC - PubMed

Publication types

LinkOut - more resources