. 2015 Oct 12;35(6):e00275.
doi: 10.1042/BSR20150190.

Peroxisome proliferator-activated receptor-α-mediated transcription of miR-301a and miR-454 and their host gene SKA2 regulates endothelin-1 and PAI-1 expression in sickle cell disease

Affiliations

Peroxisome proliferator-activated receptor-α-mediated transcription of miR-301a and miR-454 and their host gene SKA2 regulates endothelin-1 and PAI-1 expression in sickle cell disease

Caryn S Gonsalves et al. Biosci Rep. .

Abstract

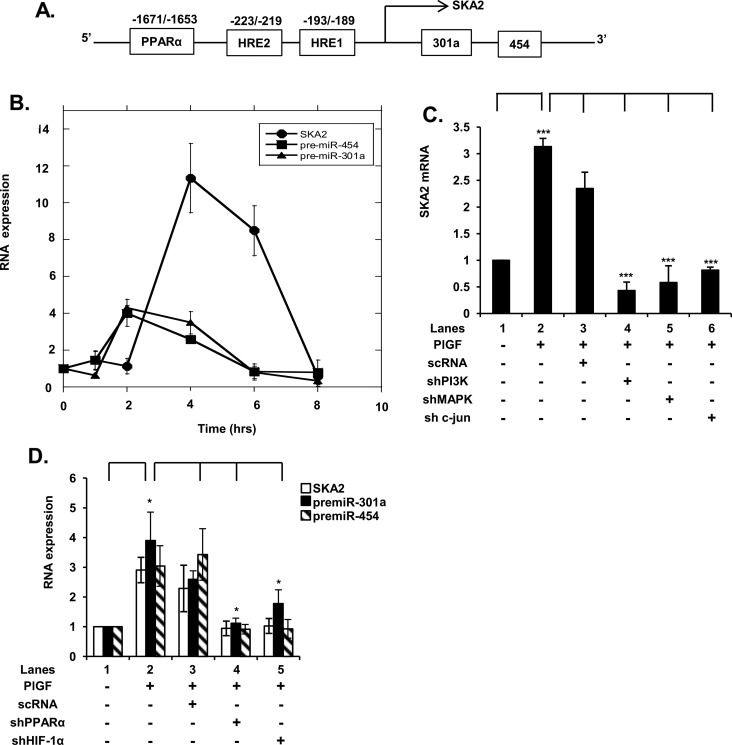
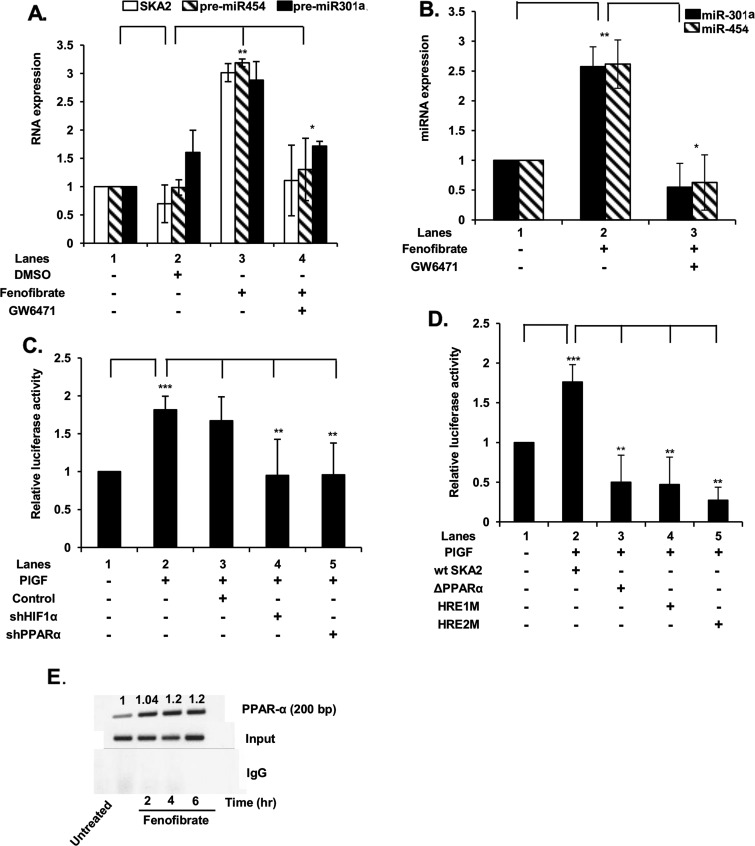
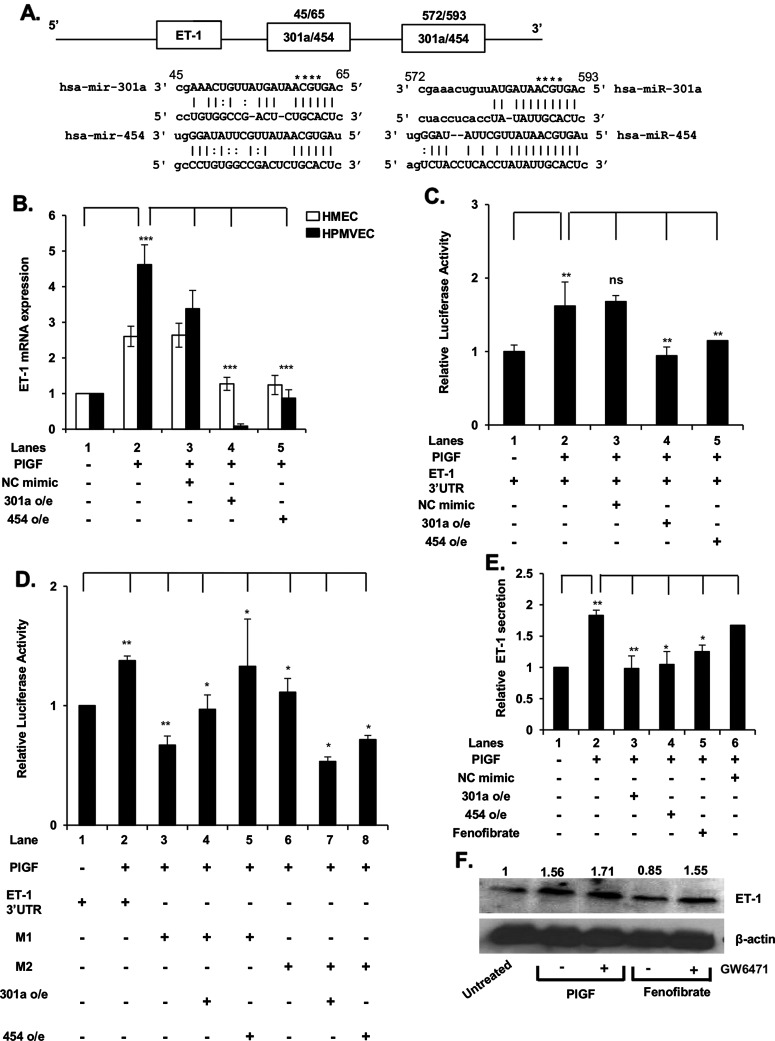
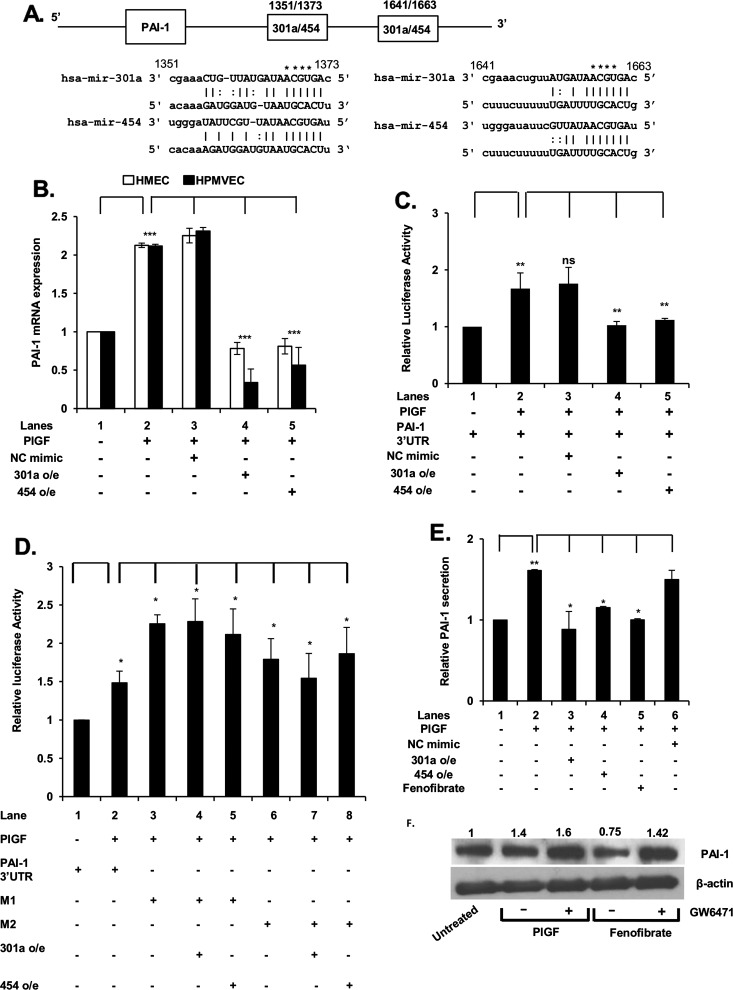
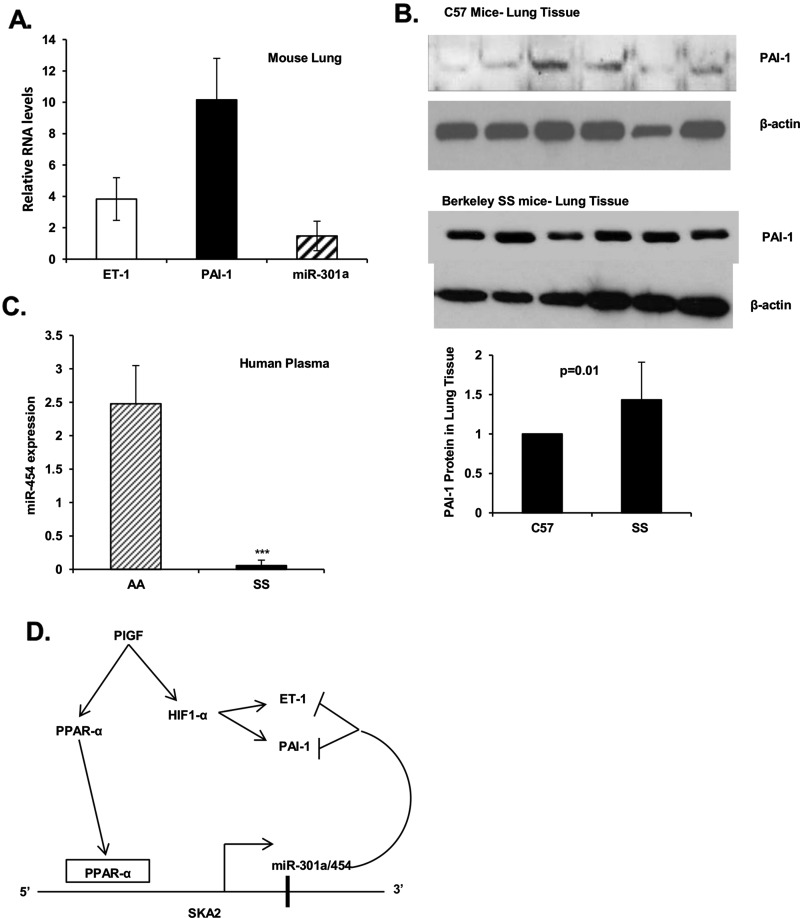
Endothelin-1 (ET-1) and plasminogen activator inhibitor-1 (PAI-1) play important roles in pulmonary hypertension (PH) in sickle cell disease (SCD). Our previous studies show higher levels of placenta growth factor (PlGF) in SCD correlate with increased plasma levels of ET-1, PAI-1, and other physiological markers of PH. PlGF-mediated ET-1 and PAI-1 expression occurs via activation of hypoxia-inducible factor-1α (HIF-1α). However, relatively little is understood regarding post-transcriptional regulation of PlGF-mediated expression of ET-1 and PAI-1. Herein, we show PlGF treatment of endothelial cells reduced levels of miR-301a and miR-454 from basal levels. In addition, both miRNAs targeted the 3'-UTRs of ET-1 and PAI-1 mRNAs. These results were corroborated in the mouse model of SCD [Berkeley sickle mice (BK-SS)] and in SCD subjects. Plasma levels of miR-454 in SCD subjects were significantly lower compared with unaffected controls, which correlated with higher plasma levels of both ET-1 and PAI-1. Moreover, lung tissues from BK-SS mice showed significantly reduced levels of pre-miR-301a and concomitantly higher levels of ET-1 and PAI-1. Furthermore, we show that miR-301a/miR-454 located in the spindle and kinetochore-associated protein-2 (SKA2) transcription unit was co-transcriptionally regulated by both HIF-1α and peroxisome proliferator-activated receptor-α (PPAR-α) as demonstrated by SKA2 promoter mutational analysis and ChIP. Finally we show that fenofibrate, a PPAR-α agonist, increased the expression of miR-301a/miR-454 and SKA2 in human microvascular endothelial cell line (HMEC) cells; the former were responsible for reduced expression of ET-1 and PAI-1. Our studies provide a potential therapeutic approach whereby fenofibrate-induced miR-301a/miR-454 expression can ameliorate PH and lung fibrosis by reduction in ET-1 and PAI-1 levels in SCD.

Keywords: endothelin-1 (ET-1); micro ribonucleic acid (miRNA); peroxisome proliferator-activated receptor-α (PPAR-α); plasminogen activator inhibitor-1 (PAI-1); sickle cell disease (SCD); spindle and kinetochore-associated protein-2 (SKA2).


Figures

Figure 1
Figure 1. PlGF up-regulates the expression of miR-301a and miR-454 located in an intron of host gene SKA2 by activation of HIF-1α and PPAR-α
(A) Schematic of 5′ end of SKA2 gene showing locations of miR-301a and miR-454 in the first intron of SKA2 and positions of cis-binding elements for HIF-1α and PPAR-α. (B) Time-dependent (1–8 h) expression of SKA2, pre-miR-301a and pre-miR-454 RNA. (C) Effect of transfection of shRNAs for PI3K, MAPK and c-Jun on SKA2 mRNA expression. HMEC cells were transfected with shRNAs for 24 h, followed by treatment with PlGF for 4 h. (D) Effect of transfection of shRNAs for HIF-1α and PPAR-α on PlGF-mediated SKA2 transcription following 2 h incubation. Data are means±S.D. of three independent experiments. ***P<0.001, **P<0.01, *P<0.05, nsP>0.05.
Figure 2
Figure 2. PlGF-mediated expression of SKA2 transcription unit is regulated by PPAR-α and HIF-1α as demonstrated by SKA2 promoter analysis and ChIP
(A) Effect of PPAR-α agonist (fenofibrate) and its antagonist (GW6471) on SKA2, pre-miR-301a and pre-miR-454 RNA expression. HMEC cells were pre-treated with GW6471 (15 μM) for 30 min, where indicated, followed by treatment with fenofibrate (100 μM) for 2 h. (B) Effect of fenofibrate on induction of mature miR-301a and miR-454. (C) Effect of shRNA for HIF-1α and PPAR-α on PlGF-mediated transcription of SKA2, as demonstrated utilizing wt SKA2 promoter-luciferase reporter. HMEC were co-transfected overnight with wt SKA2-luc and indicated shRNAs along with Renilla luciferase plasmid, followed by treatment with PlGF for 4 h. Cell lysates were assayed for luciferase activity and data normalized for Renilla luciferase activity. (D) Effect of mutation of HRE sites and deletion of PPAR-α sites in wt SKA2 promoter of SKA2-luc reporter. HMEC cells were transfected with the wt SKA2 promoter-luc or SKA2-luc reporters with mutations in either HRE site 1 or HRE site 2 or deletion of PPAR-α cis-binding element. Cells were co-transfected with Renilla luciferase plasmid for 24 h and were treated with PlGF for 4 h. Luciferase activity was normalized to Renilla luciferase activity to correct for transfection efficiency and the data are expressed as relative expression compared with the luciferase activity of wt construct, as indicated in the figure. Data are means±S.D. of three independent experiments. ***P<0.001, **P<0.01, *P<0.05, nsP>0.05. (E) ChIP analysis of HMEC cells treated with fenofibrate for 2–6 h, for assay of PPAR-α binding to the SKA2 promoter. PPAR-α antibody (top row) or control rabbit IgG (bottom row) were used for immunoprecipitation of soluble chromatin. The middle panel represents the amplification of input DNA before immunoprecipitation. Densitometric analysis, showing relative intensity of PPAR-α PCR product normalized to input DNA are indicated above each lane. Data are representative of two independent experiments.
Figure 3
Figure 3. miR-301a and miR-454 target the 3′-UTR of ET-1 mRNA
(A) Schematic of 3′-UTR of ET-1 mRNA showing locations of MRE for miR-301a and miR-454. (B) Effects of miR-301a and miR-454 synthetic mimics on PlGF-mediated ET-1 mRNA expression. HMEC and HPMVEC cells were transfected with miR-301a mimic (90 pmol), miR-454 mimic (90 pmol) or control (NC mimic) overnight, followed by treatment with PlGF for 6 h. (C) Effect of miR-301a and miR-454 synthetic mimics on 3′-UTR-ET-1-luciferase activity. HMEC cells were transfected with wt pGL3-3′-UTR-ET-1 luc reporter along with indicated miRNA mimics, followed by PlGF treatment for 6 h. (D) Effect of mutation of MRE sites for miR-301a/miR-454 in wt 3′-UTR-ET-1 luc. The sequences of predicted miR-301a-/miR-454-binding sites within ET-1 3′-UTR are shown in panel A. The bases in bold font indicate seed sequences of miR-301a/miR-454 and the base substitutions created in the corresponding MRE sequences are indicated by asterisks in panel A. HMEC were transfected with wild type ET-1 3′-UTR-luc or the indicated ET-1 3′-UTR mutant constructs (M1 or M2) along with either synthetic miR-301a or miR-454. At 24 h post-transfection, cells were treated with PlGF for 6 h. Cells were lysed in reporter assay buffer for assay of luciferase activity and data were normalized for Renilla activity. Results shown are means±S.D. of three independent experiments. ***P<0.001, **P<0.01, *P<0.05, nsP>0.05. (E) Effect of synthetic miR-301a and miR-454 mimics on PlGF-induced secretion of ET-1 from HMEC. HMEC were transfected with synthetic miR mimics (90 pmol). At 24 h post-transfection, mimic treated and control cells were treated with either PlGF or fenofibrate for 24 h, as indicated. The cell culture media were assayed for secreted ET-1 by ELISA and total protein content of cell lysates was determined. The data are expressed as relative release of ET-1 from HMEC cells. Data are means±S.D. of three independent experiments. (F) Effects of PPAR-α agonist (fenofibrate) and antagonist (GW6471) on ET-1 protein expression in HMEC cells. Densitometric analysis showing relative density values of ET-1 protein normalized to β-actin protein as a loading control, are indicated above each lane. Data are representative of two independent experiments.
Figure 4
Figure 4. miR-301a and miR-454 target the 3′-UTR of PAI-1 mRNA
(A) Schematic of 3′-UTR of PAI-1 mRNA showing locations of MRE for miR-301a and miR-454. (B) Effect of miR-301a and miR-454 synthetic mimics on PlGF-mediated PAI-1 mRNA expression. HMEC and HPMVEC cells were transfected with synthetic miR-301a mimic (90 pmol), miR-454 mimic (90 pmol) or control (NC mimic) as described in Figure 3 legend. (C) Effect of miR-301a and miR-454 synthetic mimics on 3′-UTR-PAI-1-luciferase activity. (D) Effect of mutation of MRE sites for miR-301a/miR-454 in wt 3′-UTR-PAI-1 luc. The sequences of predicted miR-301a-/miR-454-binding sites within PAI-1 3′-UTR are shown. The bases in bold font indicate seed sequences of miR-301a/miR-454 and the base substitutions in the MRE sequences are indicated by asterisks in panel A. HMEC were transfected with wild type PAI-1 3′-UTR-luc or the indicated PAI-1 3′-UTR mutant constructs (M1 or M2) along with either miR-301a or miR-454. Cells were lysed in reporter assay buffer for assay of luciferase activity and data are normalized for Renilla activity. Results are means±S.D. of three independent experiments. ***P<0.001, **P<0.01, *P<0.05, nsP>0.05. (E) Effect of synthetic miR-301a and miR-454 mimics on PlGF-induced secretion of PAI-1 from HMEC. The data are expressed as relative secretion of PAI-1 from HMEC cells. Results are means±S.D. of three independent experiments. (F) Effects of PPAR-α agonist (fenofibrate) and antagonist (GW6471) on PAI-1 protein expression in HMEC cells. Densitometric analysis of PAI-1 protein expression with values normalized to β-actin as a loading control are indicated above each lane. Data are representative of two independent experiments.
Figure 5
Figure 5. Expression of miR-301a and miR-454 in lung tissues of BK-SS and SCD human subjects
(A and B) Frozen lung tissue samples (−80°C storage) from BK-SS mice (n=6) and control C57BL/6NJ mice (n=6) were sliced and homogenized directly in RNA extraction buffer or protein cell lysate buffer. (A) Extracted RNA was analysed for ET-1 and PAI-1 mRNA expression by qRT-PCR utilizing primers indicated in Table 1. The data were normalized to GAPDH as internal control. miRNA was isolated from lung tissues using miRNA isolation kit, followed by PCR analysis. miRNA levels were normalized to internal reference 5S rRNA. The data are expressed as relative RNA levels in BK-SS mice compared with control mice. (B) Western blots of cell lysates of lung tissue from BK-SS and control C57BL/6NJ mice utilizing ET-1 and PAI-1 antibodies. Gel lanes correspond to individual animals. Lower panel, combined densitometric quantitation of PAI-1 expression in sickle (BK-SS) compared with control animals (C57). (C) miR-454 expression in plasma of SCD subjects compared with sibling controls (n=10). (D) Working model of PlGF induced transcription of SKA2 transcription unit, encompassing intronic miR-301a/miR-454, by activation of PPAR-α and binding to the 5′-flanking region of the SKA 2 promoter. miR-301a/miR-454 target the 3′-UTR of ET-1 mRNA and the 3′-UTR of PAI-1 mRNAs leading to reduction in corresponding ET-1 and PAI-1 levels. The reduced expression of miR-454 in SCD will lead to increased ET-1 and PAI-1 expression.

Similar articles

Cited by

References

    1. Gladwin M.T., Barst R.J., Castro O.L., Gordeuk V.R., Hillery C.A., Kato G.J., Kim-Shapiro D.B., Machado R., Morris C.R., Steinberg M.H., Vichinsky E.P. Pulmonary hypertension and NO in sickle cell. Blood. 2010;116:852–854. doi: 10.1182/blood-2010-04-282095. - DOI - PMC - PubMed
    1. Machado R.F., Gladwin M.T. Pulmonary hypertension in hemolytic disorders: pulmonary vascular disease: the global perspective. Chest. 2010;137:30S–38S. doi: 10.1378/chest.09-3057. - DOI - PMC - PubMed
    1. Gladwin M.T., Sachdev V., Jison M.L., Shizukuda Y., Plehn J.F., Minter K., Brown B., Coles W.A., Nichols J.S., Ernst I., et al. Pulmonary hypertension as a risk factor for death in patients with sickle cell disease. N. Engl. J. Med. 2004;350:886–895. doi: 10.1056/NEJMoa035477. - DOI - PubMed
    1. Hsu L.L., Champion H.C., Campbell-Lee S.A., Bivalacqua T.J., Manci E.A., Diwan B.A., Schimel D.M., Cochard A.E., Wang X., Schechter A.N., et al. Hemolysis in sickle cell mice causes pulmonary hypertension due to global impairment in nitric oxide bioavailability. Blood. 2007;109:3088–3098. doi: 10.1182/blood-2006-06-029173. - DOI - PMC - PubMed
    1. Bunn H.F., Nathan D.G., Dover G.J., Hebbel R.P., Platt O.S., Rosse W.F., Ware R.E. Pulmonary hypertension and nitric oxide depletion in sickle cell disease. Blood. 2010;116:687–692. doi: 10.1182/blood-2010-02-268193. - DOI - PubMed

Publication types

MeSH terms