Review
. 2015 Nov 5;370(1681):20140280.
doi: 10.1098/rstb.2014.0280.

Making parks make a difference: poor alignment of policy, planning and management with protected-area impact, and ways forward

Affiliations
Review

Making parks make a difference: poor alignment of policy, planning and management with protected-area impact, and ways forward

Robert L Pressey et al. Philos Trans R Soc Lond B Biol Sci. .

Abstract

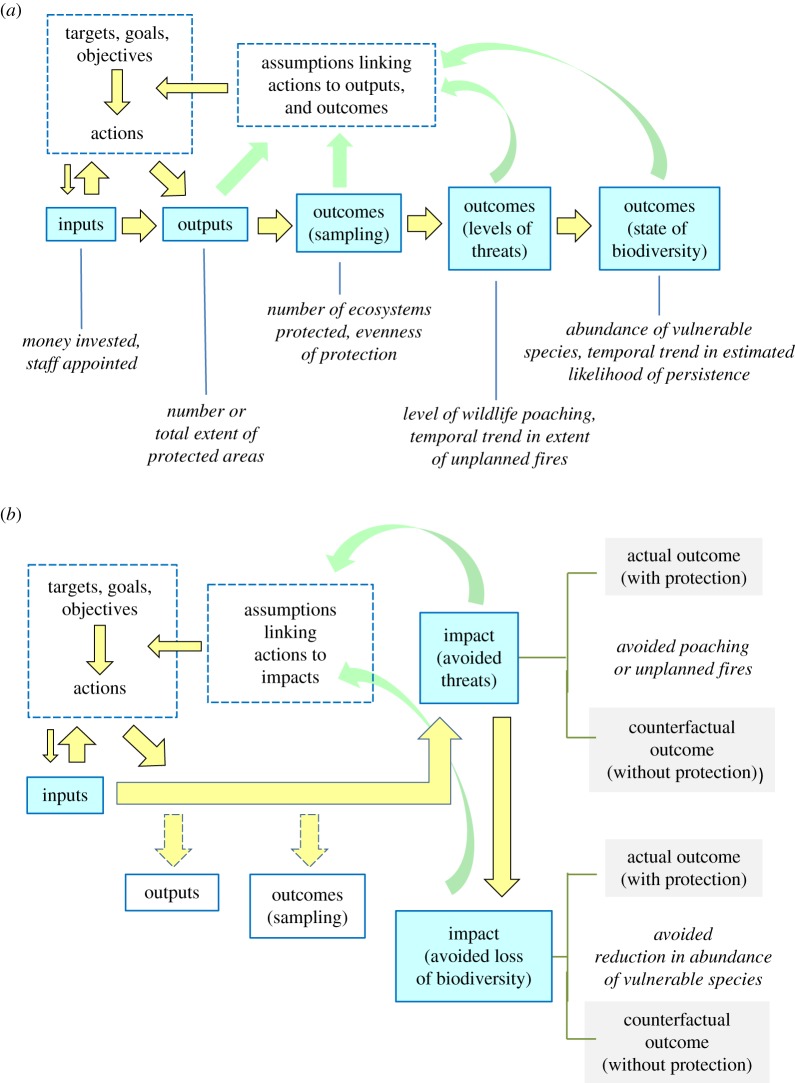
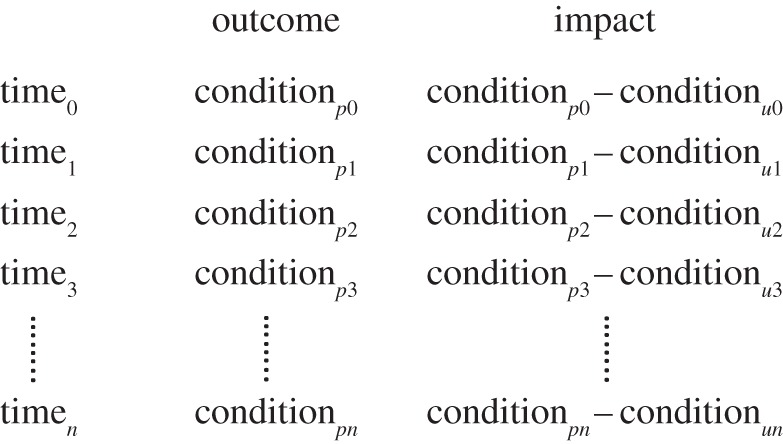
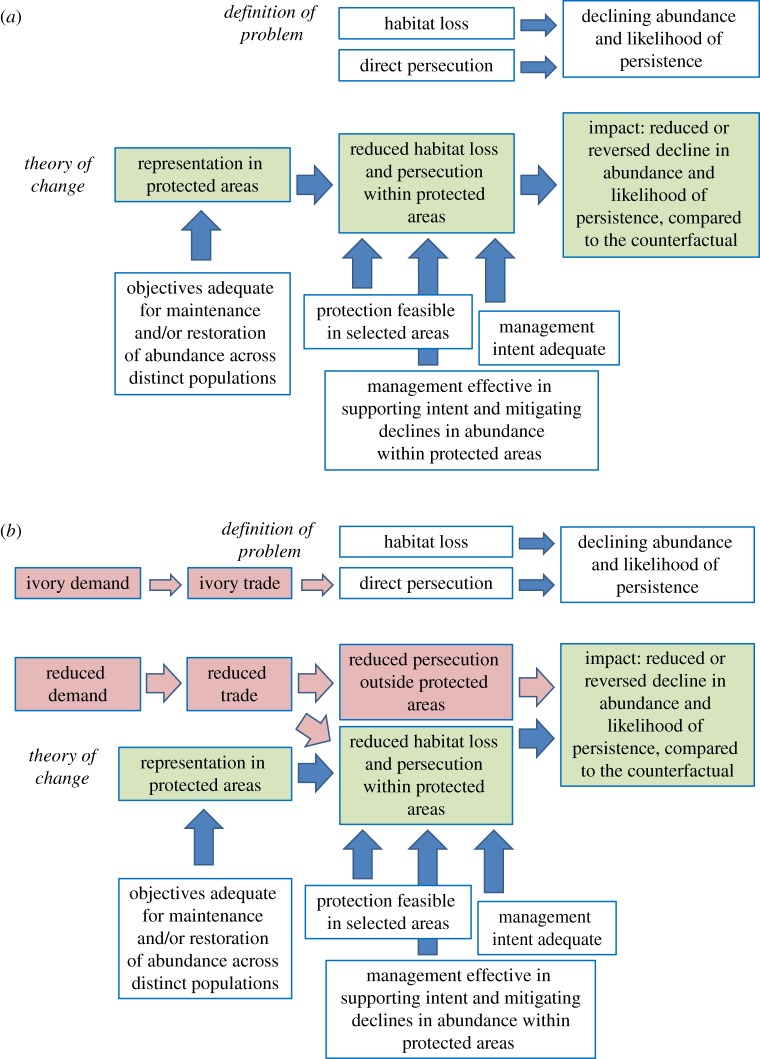
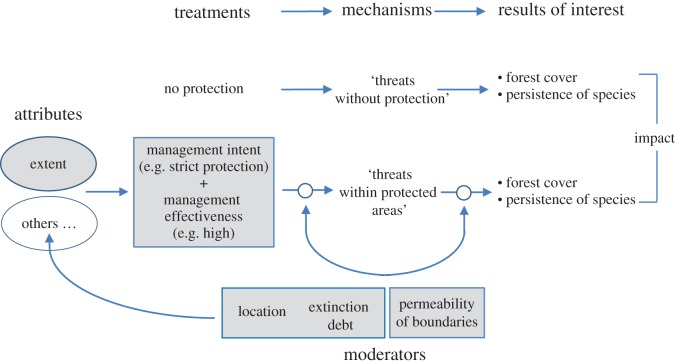
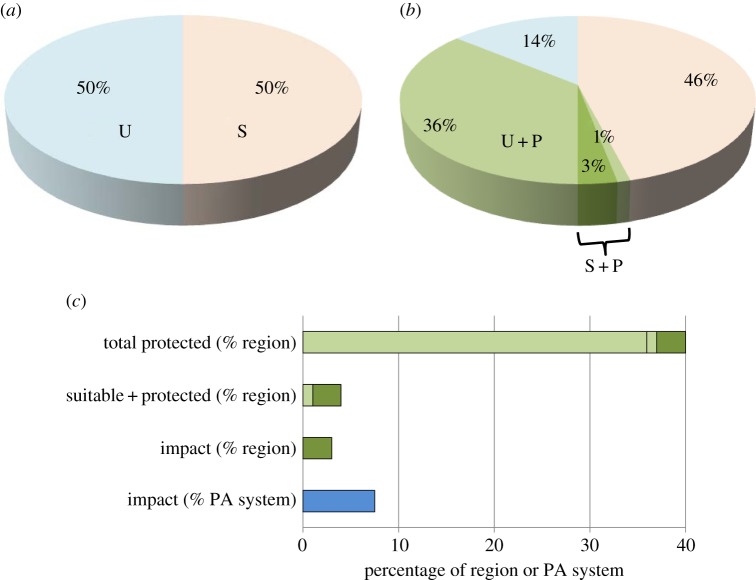
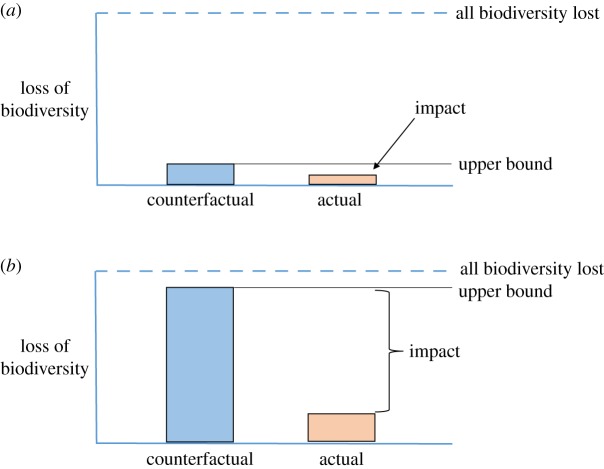
Policy and practice around protected areas are poorly aligned with the basic purpose of protection, which is to make a difference. The difference made by protected areas is their impact, defined in program evaluation as the outcomes arising from protection relative to the counterfactual of no protection or a different form of protection. Although impact evaluation of programs is well established in fields such as medicine, education and development aid, it is rare in nature conservation. We show that the present weak alignment with impact of policy targets and operational objectives for protected areas involves a great risk: targets and objectives can be achieved while making little difference to the conservation of biodiversity. We also review potential ways of increasing the difference made by protected areas, finding a poor evidence base for the use of planning and management 'levers' to better achieve impact. We propose a dual strategy for making protected areas more effective in their basic role of saving nature, outlining ways of developing targets and objectives focused on impact while also improving the evidence for effective planning and management.

Keywords: conservation planning; impact evaluation; performance management; policy targets; saving biodiversity.


Figures

Figure 1.
Figure 1.
Ways of achieving and measuring progress towards biodiversity conservation through protected areas. Blue boxes are types of measures used in performance management (a) or types of impact estimated from counterfactual analyses (b). Yellow arrows indicate influence. Terms in italics are examples of ways of setting specific targets and objectives or measuring progress towards them. (a) Results chain of inputs, outputs and outcomes, illustrating the business-as-usual approach to protected areas, focused on performance measures that can be misleading about protected-area impact. Types of measures in the results chain concern the extent, content or state of protected areas or temporal trends within them. The green feedback arrows from performance measures to assumptions refer to the recommendation for results chains to be applied adaptively, as achievements are measured [20]. (b) Policy targets and protected-area planning and management directed to making a difference. With this model, outputs and outcomes for sampling are incidental, achieved as means to the end of impact in terms of avoided threats or (preferably) avoided loss of biodiversity. The green arrows returning to assumptions indicate that impact evaluation feeds evidence back into programme design for learning and adaptive decision-making [4,21]. Definitions of terms in dashed boxes are in table 1.
Figure 2.
Figure 2.
Distinguishing outcomes from impacts as defined in this paper. Outcomes are the conditions in protected areas: the content, threat levels, or state of biodiversity within protected areas (p) at a point in time (e.g. conditionp2) or at multiple points in time, which reveal temporal trends. Impacts are the differences between conditions at sites within protected areas (p) and estimates of the conditions at the same sites were protection not present (u), or the counterfactual conditions. Ideally, impacts are also estimated at multiple points in time to test for differences in trends within and outside protected areas. The reliability of impact estimates varies with study design and quantitative rigour [14].
Figure 3.
Figure 3.
Theories of change for achieving impact for two mammal species. (a) Red wolf, Canis rufus. (b) African elephant, Loxodonta africana. Red boxes in (b) indicate additional important considerations for the African elephant. These theories of change are simplified to support key points in the text and to illustrate differences between species. More elaborate and informative theories of change are preferable for guiding conservation interventions [20], ideally using the causal inference framework of Ferraro and Hanauer [26] shown in figure 4.
Figure 4.
Figure 4.
Adaptation of a conceptual diagram (from [26]) of how protected-area impact is influenced by attributes, treatments, mechanisms and moderators. Shading indicates the attribute, treatments and moderators discussed as possible ways for practitioners to achieve impact. The figure is simplified deliberately to focus on these variables.
Figure 5.
Figure 5.
Contribution of protected areas to impact in a hypothetical forested region. In (a), U and S indicate land unsuitable and suitable, respectively, for agriculture that involves conversion of forest. In (b), U + P and S + P indicate unsuitable and suitable land, respectively, that has been placed in protected areas. Part (c) contrasts the overall extent of protected areas with impact expressed as percentages of the region and the protected-area system.
Figure 6.
Figure 6.
Influence of location of protected areas on impact. Blue bars indicate counterfactuals for loss of biodiversity, setting the upper bounds of impact. Actual impact is the difference between actual loss of biodiversity (orange bars) and the upper bounds. (a) Location of protection in area with little threat to biodiversity, counterfactual loss low, impact small. (b) Location of protection in area with high threat, counterfactual loss high, impact large. In these examples, actual losses (orange) can be seen as the losses that protection failed to avoid, e.g. owing to insufficient management resources to eliminate threats from outside.

References

    1. Dudley N, Parrish JD, Redford K, Stolton S. 2010. The revised IUCN protected area management categories: the debate and ways forward. Oryx 44, 485–490. ( 10.1017/S0030605310000566) - DOI
    1. Ferraro PJ, Hanauer MM. 2014. Advances in measuring the environmental and social impacts of environmental programs. Annu. Rev. Environ. Resour. 39, 495–517. ( 10.1146/annurev-environ-101813-013230) - DOI
    1. Ferraro PJ. 2009. Counterfactual thinking and impact evaluation in environmental policy. New Dir. Eval. 122, 75–84. ( 10.1002/ev.297) - DOI
    1. Ferraro PJ, Pattanayak SK. 2006. Money for nothing? A call for empirical evaluation of biodiversity conservation investments. PLoS Biol. 4, e105 ( 10.1371/journal.pbio.0040105) - DOI - PMC - PubMed
    1. Maron M, Rhodes JR, Gibbons P. 2013. Calculating the benefit of conservation actions. Conserv. Lett. 6, 359–367. ( 10.1111/conl.12007) - DOI

Publication types

LinkOut - more resources