. 2015 Dec;55(4):402-9.
doi: 10.1016/j.bcmd.2015.09.003. Epub 2015 Sep 21.

The free heme concentration in healthy human erythrocytes

Affiliations

The free heme concentration in healthy human erythrocytes

Anupam Aich et al. Blood Cells Mol Dis. 2015 Dec.

Abstract

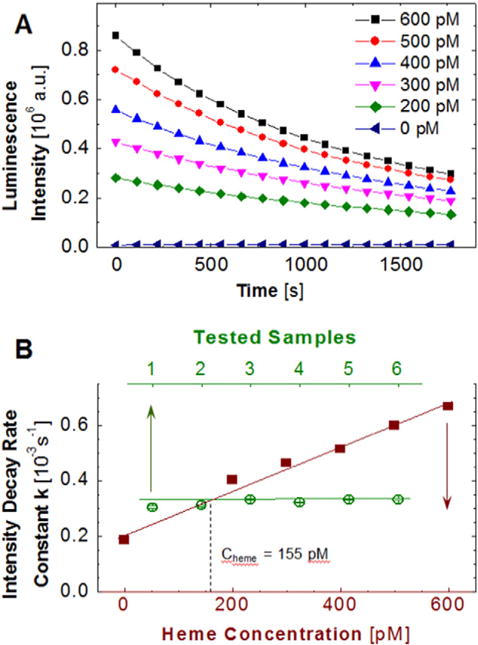
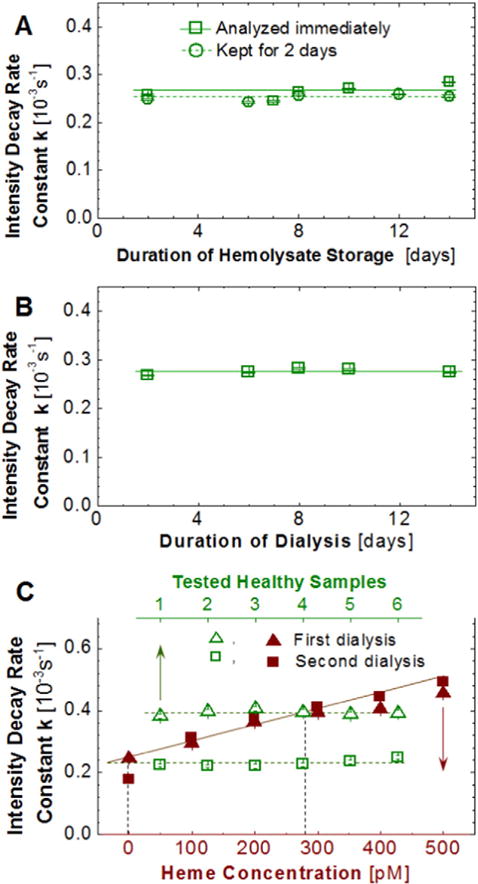
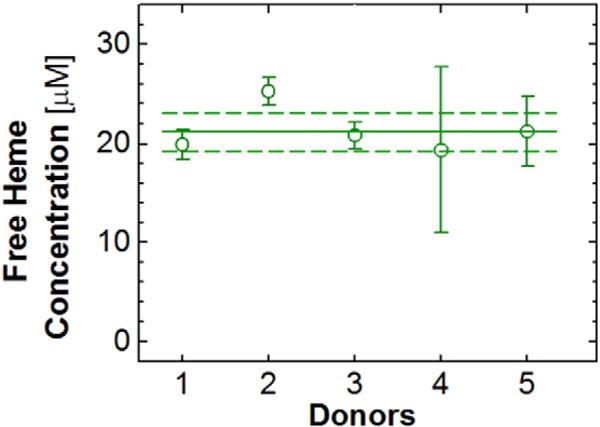
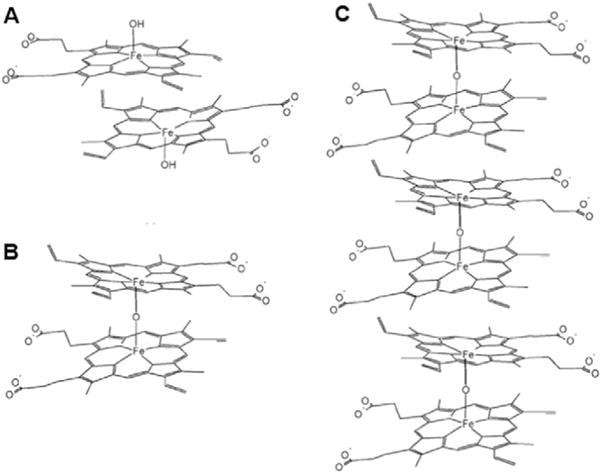
Heme, the prosthetic group of hemoglobin, may be released from its host due to an intrinsic instability of hemoglobin and accumulate in the erythrocytes. Free heme is in the form of hematin (Fe(3+) protoporphyrin IX OH) and follows several pathways of biochemical toxicity to tissues, cells, and organelles since it catalyzes the production of reactive oxygen species. To determine concentration of soluble free heme in human erythrocytes, we develop a new method. We lyse the red blood cells and isolate free heme from hemoglobin by dialysis. We use the heme to reconstitute horseradish peroxidase (HRP) from an excess of the apoenzyme and determine the HRP reaction rate from the evolution of the emitted luminescence. We find that in a population of five healthy adults the average free heme concentration in the erythrocytes is 21±2μM, ca. 100× higher than previously determined. Tests suggest that the lower previous value was due to the use of elevated concentrations of NaCl, which drive hematin precipitation and re-association with apoglobin. We show that the found hematin concentration is significantly higher than estimates based on equilibrium release and the known hematin dimerization. The factors that lead to enhanced heme release remain an open question.

Keywords: Enzymatic analysis; Hematin concentration; Heme release; Hemoglobin instability; Human erythrocytes; Luminescence.


Figures

Fig. 1
Fig. 1
An enzymatic method for the determination of the concentration of free heme. A, The evolution of luminescence intensity emitted by the reactions in Eq. (1a,b,c) at five concentrations of heme and in its absence. B, Illustration of the determination of the concentration of free heme in the dialysate. The standard curve, shown in solid symbols, relates known concentration of heme to the rate constant k of decay of the luminescent intensity determined from evolution curves similar to those shown in A. The constant k is determined for six samples of dialysate. The unknown concentration of free heme in the dialysate is determined from the average value of k.
Fig. 2
Fig. 2
Validation of the method. A and B, Independence of found free heme concentration on duration of storage of blood and hemolysate and of dialysis. A, Hemolysate from one donor was stored at ca. 5 °C. The solution was sampled at regular intervals and the free heme was quantified. In another experiment, blood was kept for 2 days at ca. 5oC before the erythrocytes were isolated and lysed and the free heme in the hemolysate was determined. B, Hemolysate from one donor was dialyzed for 14 days. The dialysate was sampled at regular intervals and its heme concentration was evaluated. C, Arrest of heme release upon dilution at red cell lysis. A hemolysate sample was dialyzed for 14 h. The dialysate was removed and the heme concentration in it was determined. The hemolysate samples in the dialysis cassettes were placed in new dialysis buffers and, dialyzed for 14 h, and the free heme concentration in the new dialysate was determined using new standard curves.
Fig. 3
Fig. 3
The average concentrations of free heme in blood samples of five healthy donors. Eight donations of four 4 mL tubes were obtained from donor 1 and two from donor 2 and are averaged; all other data points are averages over four tubes of a single donation. The population average, 21 μM, is marked with a horizontal solid line; the standard deviation, 2 μM, with two dashed lines.
Fig. 4
Fig. 4
The structures of A, π–π dimer; B, μ-oxo dimer; and C, oligomers consisting of stacked μ-oxo dimers.

References

    1. Bunn HF, Jandl JH. Exchange of heme among hemoglobins and between hemoglobin and albumin. J Biolumin Chemilumin. 1968;243:465–475. - PubMed
    1. Hargrove MS, Whitaker T, Olson JS, Vali RJ, Mathews AJ. Quaternary structure regulates hemin dissociation from human hemoglobin. J Biol Chem. 1997;272:17385–17389. - PubMed
    1. Hebbel RP, Morgan WT, Eaton JW, Hedlund BE. Accelerated autoxidation and heme loss due to instability of sickle hemoglobin. Proc Natl Acad Sci. 1988;85:237–241. - PMC - PubMed
    1. Light WR, Olson JS. Transmembrane movement of heme. J Biol Chem. 1990;265:15623–15631. - PubMed
    1. Chou AC, Fitch CD. Mechanism of hemolysis induced by ferriprotoporphyrin IX. J Clin Invest. 1981;68:672–677. - PMC - PubMed

Publication types