Comparative Study
. 2015 Oct 13;13(10):e1002273.
doi: 10.1371/journal.pbio.1002273. eCollection 2015 Oct.

Risk of Bias in Reports of In Vivo Research: A Focus for Improvement

Affiliations
Comparative Study

Risk of Bias in Reports of In Vivo Research: A Focus for Improvement

Malcolm R Macleod et al. PLoS Biol. .

Erratum in

  • Correction: Risk of Bias in Reports of In Vivo Research: A Focus for Improvement.
    Macleod MR, Lawson McLean A, Kyriakopoulou A, Serghiou S, de Wilde A, Sherratt N, Hirst T, Hemblade R, Bahor Z, Nunes-Fonseca C, Potluru A, Thomson A, Baginskaite J, Egan K, Vesterinen H, Currie GL, Churilov L, Howells DW, Sena ES. Macleod MR, et al. PLoS Biol. 2015 Nov 10;13(11):e1002301. doi: 10.1371/journal.pbio.1002301. eCollection 2015 Nov. PLoS Biol. 2015. PMID: 26556632 Free PMC article.

Abstract

The reliability of experimental findings depends on the rigour of experimental design. Here we show limited reporting of measures to reduce the risk of bias in a random sample of life sciences publications, significantly lower reporting of randomisation in work published in journals of high impact, and very limited reporting of measures to reduce the risk of bias in publications from leading United Kingdom institutions. Ascertainment of differences between institutions might serve both as a measure of research quality and as a tool for institutional efforts to improve research quality.


Conflict of interest statement

MRM is a member of the PLOS Medicine Editorial Board.

Figures

Fig 1
Fig 1. (A) Prevalence of reporting of randomisation, blinded assessment of outcome, sample size calculation, and conflict of interest in 146 publications describing in vivo research identified through random sampling from PubMed; change in prevalence of (B) randomisation, (C) blinded assessment of outcome, and (D) conflict of interest reporting in quintiles of year of publication.
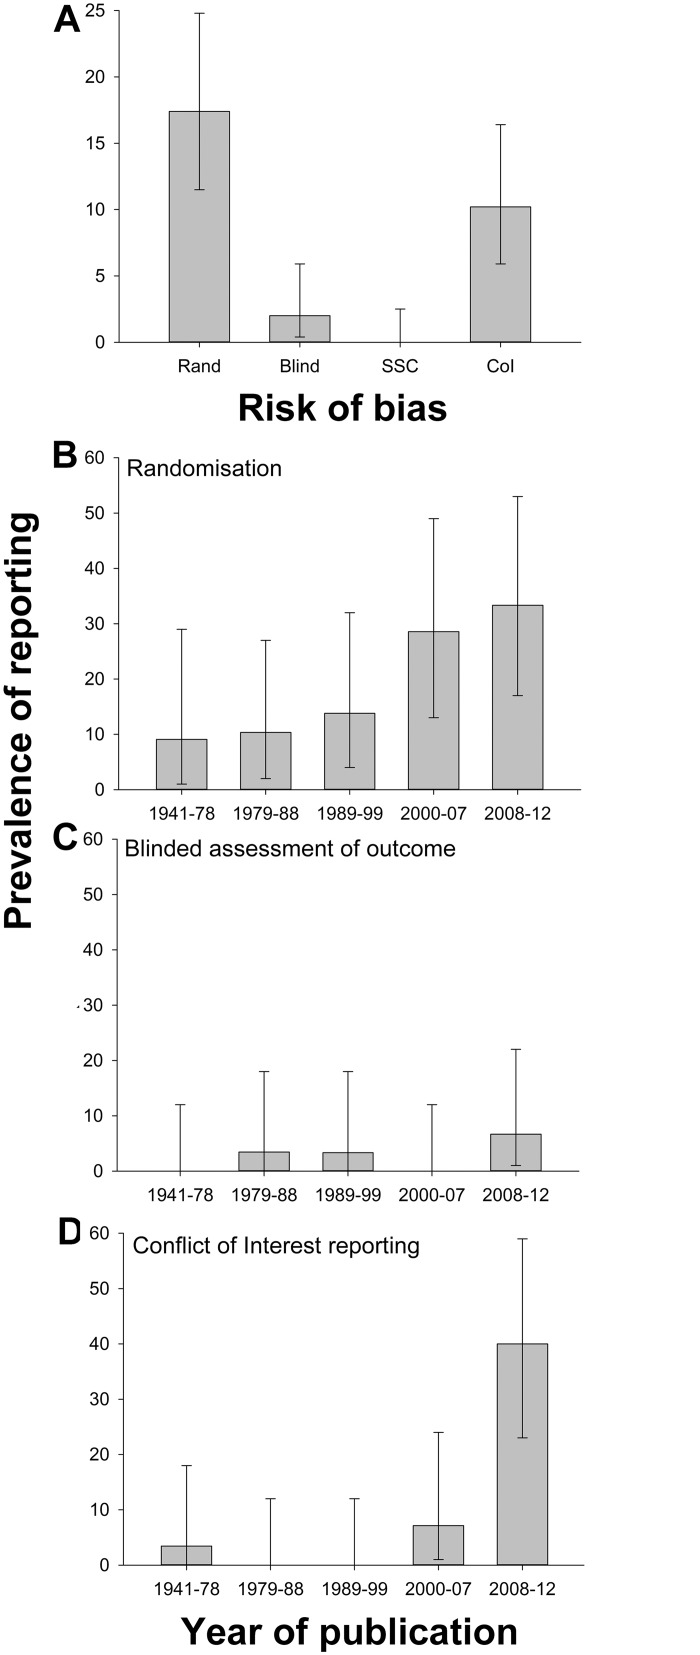
Vertical error bars represent the 95% confidence intervals of the estimates (S1 Data).
Fig 2
Fig 2. Prevalence of reporting of (A) randomisation, (B) blinded assessment of outcome, (C) sample size calculations, and (D) conflict of interest reporting in 2,671 publications describing the efficacy of interventions in animal models of Alzheimer’s disease (AD, n = 324 publications), focal cerebral ischaemia (FCI, 704), glioma (175), Huntington’s disease (HD, 113), intracerebral haemorrhage (ICH, 72), experimental autoimmune encephalomyelitis (EAE, 1029), myocardial infarction (MI, 69), and spinal cord injury (SCI, 185) identified in the context of systematic reviews.
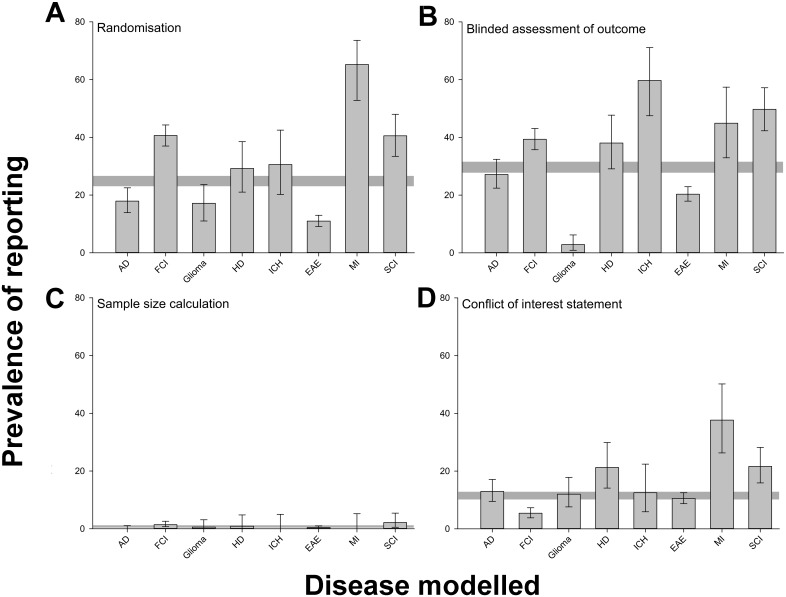
Vertical error bars represent the 95% confidence intervals, and the horizontal grey bar represents the 95% confidence interval of the overall estimate (S2 Data).
Fig 3
Fig 3. Change in prevalence of reporting of (A) randomisation, (B) blinded assessment of outcome, (C) sample size calculations, and (D) conflict of interest reporting in quintiles of year of publication for 2,671 publications describing the efficacy of interventions in animal models of eight different diseases identified in the context of systematic reviews.
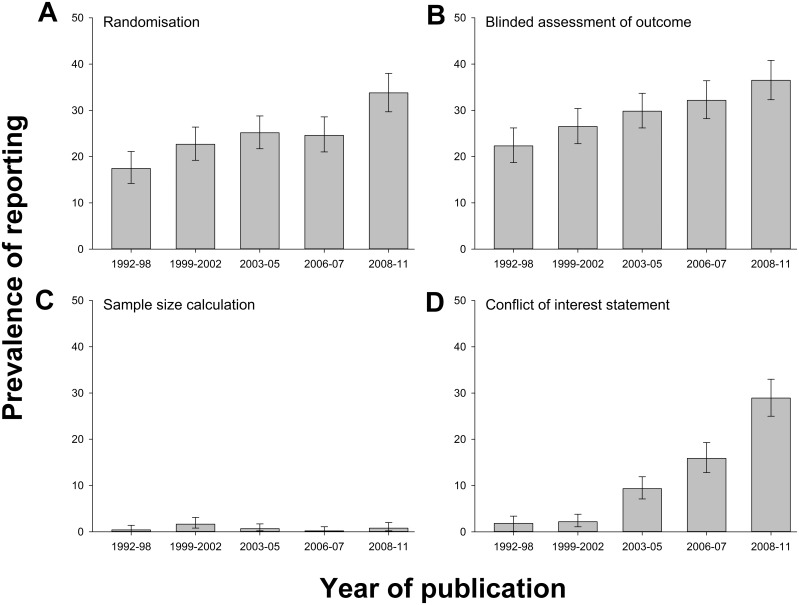
Vertical error bars represent the 95% confidence intervals of the estimates (S3 Data).
Fig 4
Fig 4. Prevalence of reporting of (A) randomisation, (B) blinded assessment of outcome, (C) sample size calculations, and (D) conflict of interest reporting by decile of journal impact factor in 2,671 publications describing the efficacy of interventions in animal models of eight different diseases identified in the context of systematic reviews.
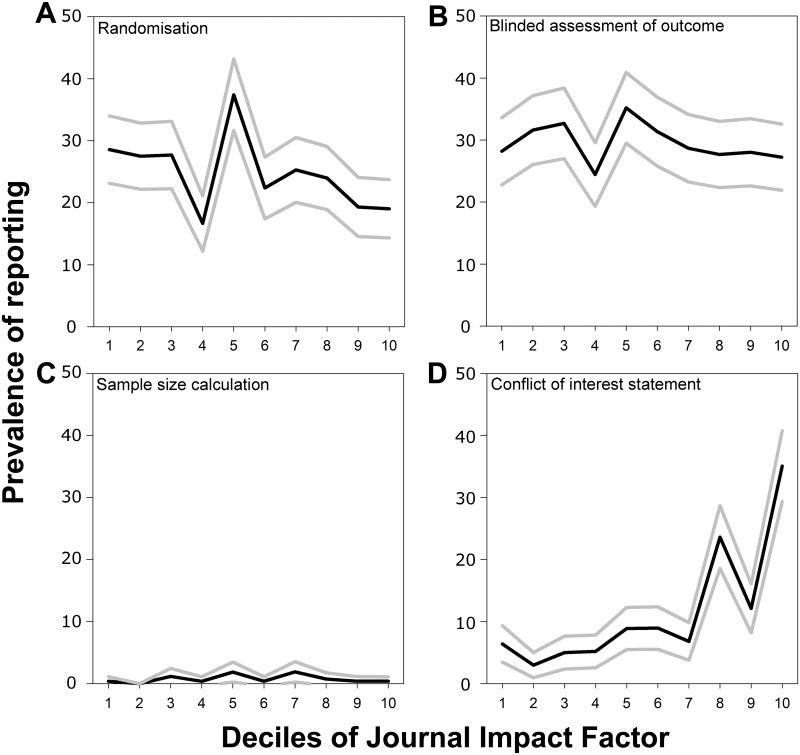
Black lines indicate the median value in that decile, and grey lines indicate the 95% confidence limits derived from nonparametric median regression (S4 Data).
Fig 5
Fig 5. Prevalence of reporting of randomisation, blinded assessment of outcome, inclusion or exclusion criteria, and sample size calculation in 1,173 publications describing in vivo research published from five leading UK institutions (labelled A through E).
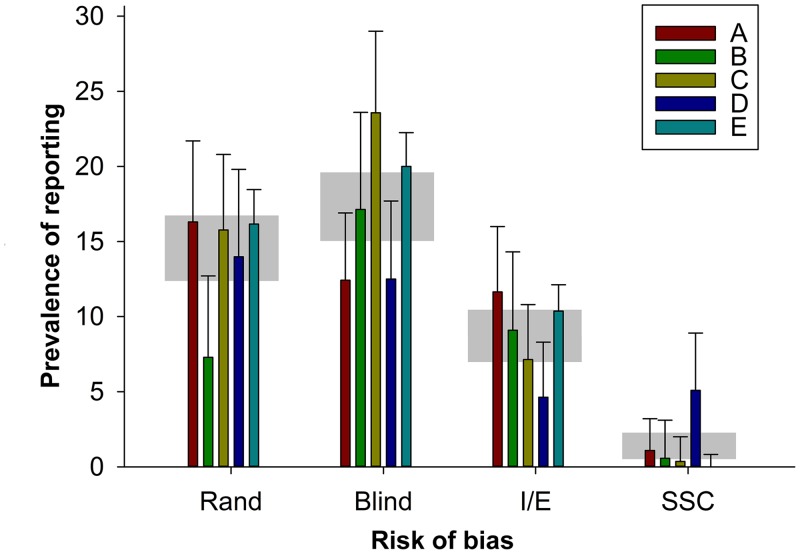
For each institution, the vertical error bars represent the 95% confidence intervals, and the horizontal grey bar represents the 95% confidence interval of the overall estimate for that risk-of-bias item (S5 Data).

Comment in

References

    1. Landis SC, Amara SG, Asadullah K, Austin CP, Blumenstein R, Bradley EW, et al. A call for transparent reporting to optimize the predictive value of preclinical research. Nature 2012. October 11;490(7419):187–91. 10.1038/nature11556 - DOI - PMC - PubMed
    1. van der Worp HB, Howells DW, Sena ES, Porritt MJ, Rewell S, O'Collins V, et al. Can animal models of disease reliably inform human studies? PLoS Med 2010. March 30;7(3):e1000245 10.1371/journal.pmed.1000245 - DOI - PMC - PubMed
    1. Crossley NA, Sena E, Goehler J, Horn J, van der Worp B, Bath PMW, et al. Empirical Evidence of Bias in the Design of Experimental Stroke Studies. A Metaepidemiologic Approach. Stroke 2008. January 31; 39(3):929–934. 10.1161/STROKEAHA.107.498725 - DOI - PubMed
    1. Hirst JA, Howick J, Aronson JK, Roberts N, Perera R, Koshiaris C, et al. The need for randomization in animal trials: an overview of systematic reviews. PLoS One 2014. June 6;9(6):e98856 10.1371/journal.pone.0098856 - DOI - PMC - PubMed
    1. Macleod MR, O'Collins T, Horky LL, Howells DW, Donnan GA. Systematic review and metaanalysis of the efficacy of FK506 in experimental stroke. J Cereb Blood Flow Metab 2005. June;25(6):713–21. - PubMed

Publication types