. 2015 Oct 13;11(10):e1004371.
doi: 10.1371/journal.pcbi.1004371. eCollection 2015 Oct.

A Common Mechanism Underlying Food Choice and Social Decisions

Affiliations

A Common Mechanism Underlying Food Choice and Social Decisions

Ian Krajbich et al. PLoS Comput Biol. .

Abstract

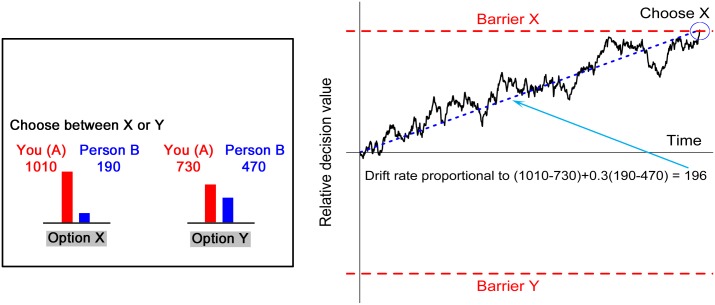
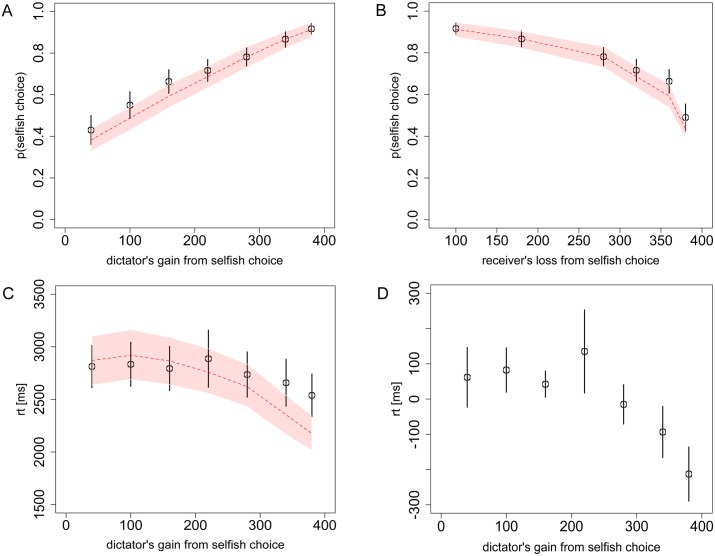
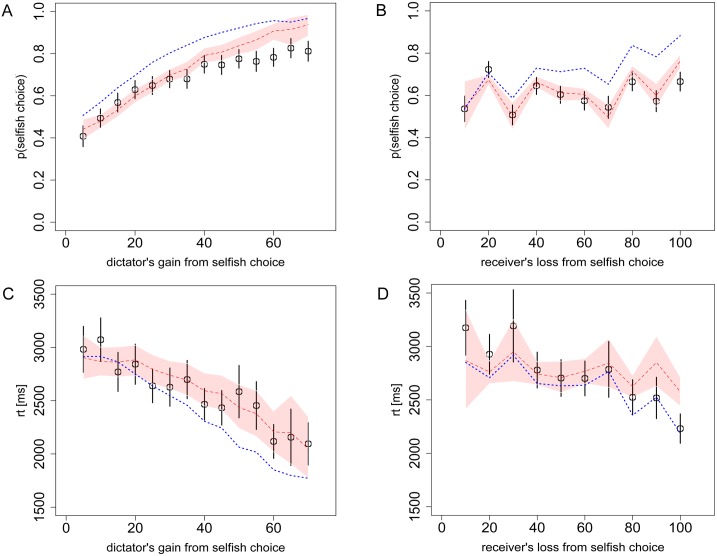
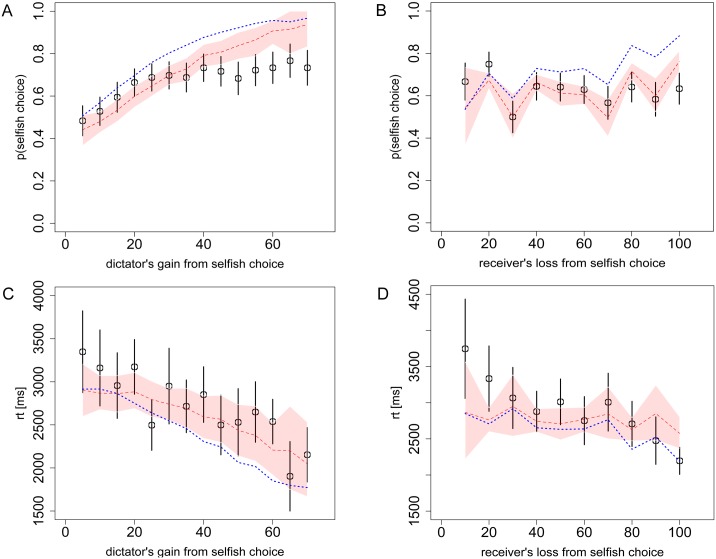
People make numerous decisions every day including perceptual decisions such as walking through a crowd, decisions over primary rewards such as what to eat, and social decisions that require balancing own and others' benefits. The unifying principles behind choices in various domains are, however, still not well understood. Mathematical models that describe choice behavior in specific contexts have provided important insights into the computations that may underlie decision making in the brain. However, a critical and largely unanswered question is whether these models generalize from one choice context to another. Here we show that a model adapted from the perceptual decision-making domain and estimated on choices over food rewards accurately predicts choices and reaction times in four independent sets of subjects making social decisions. The robustness of the model across domains provides behavioral evidence for a common decision-making process in perceptual, primary reward, and social decision making.


Conflict of interest statement

The authors have declared that no competing interests exist.

Figures

Fig 1
Fig 1. An example of a decision from Task 1, with selfish option X on the left and the fairer option Y on the right along with a simulated decision for this example, using the social aDDM with the parameters from the food study.
The drift rate (dotted blue line) is proportional to the weighted sum of the payoff differences for each player between options X and Y. The weight of 0.3 is the discount parameter θ.
Fig 2
Fig 2. Choices and reaction times from Task 1 (Dictator game).
A) The probability of the dictator choosing the selfish option as a function of his own payoff gain from the selfish option, relative to the fairer option, and B) as a function of the receiver’s payoff loss from the selfish option. C) The dictator’s RT, and D) individually de-meaned RT, as a function of his own payoff gain from the selfish option. Black circles indicate the aggregate subject data with bars representing s.e.m. Red dashed lines indicate the aDDM predictions with 95% confidence intervals. Overlap of these confidence intervals with the data’s standard error bars in every case indicates excellent model predictions. In the first row of the figure (and Figs 3 and 4) the two panels present the same data but using different x-axes to demonstrate that the data and model are sensitive to both dimensions of the decision problem.
Fig 3
Fig 3. Choices and reaction times from Task 2 (Dictator game).
A) The probability of the dictator choosing the selfish option as a function of his own payoff gain from the selfish option, relative to the fairer option, and B) as a function of the receiver’s loss from the selfish option. C) The dictator’s RT as a function of his own payoff gain from the selfish option, and D) as a function of the receiver’s loss from the selfish option. Black circles indicate the aggregate subject data with bars representing s.e.m. Red dashed lines indicate the DDM predictions with 95% confidence intervals. The overlap of these confidence intervals with the data’s standard error bars indicates excellent model predictions. Blue dotted lines indicate the alternative DDM with θ = 0.15, which would be the prediction from the widely-used Fehr-Schmidt model of social preferences.
Fig 4
Fig 4. Choices and reaction times from Task 3 (Dictator game).
A) The probability of the dictator choosing the selfish option as a function of his own payoff gain from the selfish option, relative to the fairer option, and B) as a function of the receiver’s loss from the selfish option. C) The dictator’s RT as a function of his own payoff gain from the selfish option, and D) as a function of the receiver’s loss from the selfish option. Black circles indicate the aggregate subject data with bars representing s.e.m. Red dashed lines indicate the DDM predictions with 95% confidence intervals. The overlap of these confidence intervals with the data’s standard error bars indicates excellent model predictions. Blue dotted lines indicate the alternative DDM with θ = 0.15, which would be the prediction from the widely-used Fehr-Schmidt model of social preferences.
Fig 5
Fig 5. Choices and reaction times from Task 4 (Ultimatum game).
A) The probability of the receiver accepting an ultimatum offer, and B) the RT, as a function of the offer (out of a possible 20 Swiss Francs). Black circles indicate the aggregate subject data with bars representing s.e.m. Red dashed lines indicate the DDM predictions with 95% confidence intervals. Overlap of these confidence intervals with the data’s standard error bars in every case, indicates excellent model predictions.
Fig 6
Fig 6. Sensitivity of the model to the parameter θ.
A) Replication of Fig 2A, B) Fig 3C, C) Fig 4B, and D) Fig 5A, using θ = {0.1, 0.3, 0.5, 0.7, 0.9}. Black circles indicate the aggregate subject data with bars representing s.e.m. Dashed lines indicate the aDDM predictions with different θ values, while the solid red line indicates the predicted θ = 0.3.
Fig 7
Fig 7. Alternative social preference models.
A) Replication of Fig 2A, B) Fig 3A, C) Fig 4B, and D) Fig 5A, using the alternative Fehr-Schmidt and Bolton-Ockenfels models, as well as the aDDM. Black circles indicate the aggregate subject data with bars representing s.e.m. Dashed lines indicate the alternative model predictions, while the solid line indicates the aDDM prediction.
Fig 8
Fig 8. Alternative sequential sampling model.
A) Replication of Fig 2A, B) Fig 2B, C) Fig 3A, and D) Fig 4C, E) Fig 5A, and F) Fig 5B, using the alternative Ornstein-Uhlenbeck model. Black circles indicate the aggregate subject data with bars representing s.e.m. Dashed lines indicate the alternative model predictions with 95% confidence intervals.

References

    1. Tversky A, Thaler RH (1990) Anomalies: Preference Reversals. The Journal of Economic Perspectives 4: 201–211.
    1. Slovic P (1995) The construction of preference. American Psychologist 50: 364–371.
    1. Payne JW, Bettman JR, Schkade DA (1999) Measuring Constructed Preferences: Towards a Building Code. Journal of Risk and Uncertainty 19: 243–270.
    1. Johnson EJ, Payne JW, Bettman JR (1988) Information displays and preference reversals. Organizational behavior and human decision processes 42: 1–21.
    1. Marschak J (1960) Binary choice constraints on random utility indications In: Arrow K, editor. Stanford Symposium on Mathematical Methods in the Social Sciences: Stanford University Press.

Publication types