Comparative Study
. 2015 Oct 13;10(10):e0139659.
doi: 10.1371/journal.pone.0139659. eCollection 2015.

The Urine Proteome Profile Is Different in Neuromyelitis Optica Compared to Multiple Sclerosis: A Clinical Proteome Study

Affiliations
Comparative Study

The Urine Proteome Profile Is Different in Neuromyelitis Optica Compared to Multiple Sclerosis: A Clinical Proteome Study

Helle H Nielsen et al. PLoS One. .

Abstract

Objectives: Inflammatory demyelinating diseases of the CNS comprise a broad spectrum of diseases like neuromyelitis optica (NMO), NMO spectrum disorders (NMO-SD) and multiple sclerosis (MS). Despite clear classification criteria, differentiation can be difficult. We hypothesized that the urine proteome may differentiate NMO from MS.

Methods: The proteins in urine samples from anti-aquaporin 4 (AQP4) seropositive NMO/NMO-SD patients (n = 32), patients with MS (n = 46) and healthy subjects (HS, n = 31) were examined by quantitative liquid chromatography-tandem mass spectrometry (LC-MS/MS) after trypsin digestion and iTRAQ labelling. Immunoglobulins (Ig) in the urine were validated by nephelometry in an independent cohort (n = 9-10 pr. groups).

Results: The analysis identified a total of 1112 different proteins of which 333 were shared by all 109 subjects. Cluster analysis revealed differences in the urine proteome of NMO/NMO-SD compared to HS and MS. Principal component analysis also suggested that the NMO/NMO-SD proteome profile was useful for classification. Multivariate regression analysis revealed a 3-protein profile for the NMO/NMO-SD versus HS discrimination, a 6-protein profile for NMO/NMO-SD versus MS discrimination and an 11-protein profile for MS versus HS discrimination. All protein panels yielded highly significant ROC curves (AUC in all cases >0.85, p≤0.0002). Nephelometry confirmed the presence of increased Ig-light chains in the urine of patients with NMO/NMO-SD.

Conclusion: The urine proteome profile of patients with NMO/NMO-SD is different from MS and HS. This may reflect differences in the pathogenesis of NMO/NMO-SD versus MS and suggests that urine may be a potential source of biomarkers differentiating NMO/NMO-SD from MS.


Conflict of interest statement

Competing Interests: Helle H. Nielsen has received travel funding and speaker honoraria from and served on advisory boards for Merck-Serono, Novartis Healthcare, Biogen Idec, Genzyme Denmark, Teva Denmark and UCB Nordic. Hans C. Beck declares no potential conflicts of interest. Lars P. Kristensen declares no potential conflicts of interest. Mark Burton has nothing to declare. Tunde Csepany has received speaker honoraria/congress expense compensations from Bayer Schering, Biogen Idec, Merck Serono, Novartis, Sanofi-Genzyme and Teva. Magdolna Simo has received compensation for consulting services and speaking from Biogen Idec, Merck–Serono, Novartis, Sanofi–Aventis, and Teva Pharmaceutical Industries Ltd. Peter Dioszeghy has received compensation for consulting services from Biogen, Novartis, and Teva Pharmaceutical Industries Ltd. Tobias Sejbæk has received travel funding and speaker honoraria from Merck-Serono, Novartis Healthcare, Biogen Idec, Genzyme Denmark and Teva Denmark. Manuela Grebing declares no potential conflicts of interest. Niels H. H. Heegaard declare no conflicts of interest. Zsolt Illes has received compensation for consulting services and speaking from Bayer–Schering, Biogen–Idec, Merck–Serono, Novartis, Sanofi–Aventis, and Teva Pharmaceutical Industries Ltd. This does not alter the authors' adherence to PLOS ONE policies on sharing data and materials.

Figures

Fig 1
Fig 1. Outline of the study: enrolment and sample processing.
Workflow and sample processing are shown. (A) Cohort 1: After initial screening and analysis of 176 urine samples, 67 samples were excluded due to presence of blood, nitrite, high albumin/creatinine ratio or low protein content. The remaining 109 samples were analysed as individual samples by quantitative LC-MS/MS proteomics compared to control groups of pooled samples of AQP4-seropositive NMO/NMO-SD, MS and HS samples, respectively, to yield 1112 proteins. (B) Cohort 2: For validation of increased Ig and AQP4 antibody excretion, samples from an independent cohort of patients with AQP4-seropositive NMO/NMO-SD (n = 9–10 pr group) were subjected to nephelometry and examination of anti-AQP4 by a cell-based assay. NMO/NMO-SD, neuromyelitis optica/neuromyelitis optica spectrum disorder; MS, multiple sclerosis; HS, healthy subjects.
Fig 2
Fig 2. Cluster analysis of detected proteins in the urine comparing patients with NMO/NMO-SD, MS and healthy subjects.
(A) Out of the 1112 proteins detected in the urine, 333 proteins were found in all samples. (B) PCA of all 333 proteins differentiated NMO/NMO-SD from HS samples. (C) MS samples could not be differentiated from HS by PCA. (D) NMO/NMO-SD samples could not be differentiated from MS samples by PCA. (E) PCA of proteins, which were differentially expressed (p<0.05) compared to HS and present in at least 80% of the samples enabled differentiation of the NMO/NMO-SD samples from HS. (F) PCA of proteins, which were differentially expressed (p<0.05) compared to HS and present in at least 80% of the samples enabled separation of the MS samples from HS. (G) PCA of proteins, which were differentially expressed (p<0.05) compared to HS and present in at least 80% of the samples enabled separation of the NMO/NMO-SD samples from MS. PCA, principal component analysis; NMO/NMO-SD, neuromyelitis optica/neuromyelitis optica spectrum disorder; MS, multiple sclerosis; HS, healthy subjects.
Fig 3
Fig 3. False Discovery Rate Adjustment identifies proteins significant for NMO/NMO-SD and HS discrimination in the urine.
(A) Heat maps comparing NMO/NMO-SD and HS samples by false discovery rate adjustment with q-values less than 0.05 are shown. The analysis identified 31 proteins that discriminated NMO/NMO-SD from HS. (B) Only 3 fragments of Igs appeared to be upregulated compared to HS, the rest of the proteins were downregulated. (C) ROC curves for the Ig chains Ig-G3, Ig-K and Ig-L are shown. (D) Detection of Ig light chains by LC-MS/MS was 100% in Cohort 1, while only 20–30% by nephelometry. In cohort 2, nephelometry detected Ig light chains only in 10% of NMO/NMO-SD samples. Magenta, upregulated compared to HS; Green, downregulated compared to HS; NMO/NMO-SD, neuromyelitis optica/neuromyelitis optica spectrum disorder; MS, multiple sclerosis; HS, healthy subjects; Ig-G3, immunoglobulin gamma–3 chain; Ig-K; immunoglobulin kappa chain; Ig-L, immunoglobulin lambda chain.
Fig 4
Fig 4. False Discovery Rate Adjustment identifies 4 proteins significant for NMO/NMO-SD and MS discrimination in the urine.
A) Heat maps comparing NMO/NMO-SD and MS samples by false discovery rate adjustment with q-values less than 0.05 are shown. The analysis identified 4 proteins that discriminated NMO/NMO-SD from MS. (B) Only the protein Ig-G3 chain were found to be upregulated in NMO/NMO-SD compared to MS. Magenta, upregulated compared to HS; Green, downregulated compared to HS; NMO/NMO-SD, neuromyelitis optica/neuromyelitis optica spectrum disorder; MS, multiple sclerosis; HS, healthy subjects; Ig-G3, immunoglobulin 3 chain; ICAM–2, Intercellular adhesion molecule.
Fig 5
Fig 5. Risk scores by logistic regression.
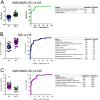
Risk scores and ROC curves for the discriminating profiles are shown. (A) A 3- protein profile based on the 333 proteins detected in all 109 was the optimal model (ROC AUC = 0.93, p<0.0001) for NMO/NMO-SD versus HS discrimination. (B) An 11-protein profile based on either proteins present in at least 80% of the samples in each group (520 proteins), or proteins present in at least 2 samples in each group (1021 proteins) was optimal for MS versus HS. (C) For NMO/NMO-SD versus MS discrimination, the best model was a 4-protein profile based on proteins present in at least 80% of the samples in each group (520 proteins).

References

    1. Lucchinetti CF, Mandler RN, McGavern D, Bruck W, Gleich G, Ransohoff RM, et al. A role for humoral mechanisms in the pathogenesis of Devic's neuromyelitis optica. Brain: a journal of neurology. 2002;125(Pt 7):1450–61. Epub 2002/06/22. . - PMC - PubMed
    1. Illes Z. Pathogenesis, diagnosis and treatment of neuromyelitis optica: Changing concept of an old disease. Clinical and Experimental Neuroimmunology. 2010;1(3):103–23. 10.1111/j.1759-1961.2010.00011.x - DOI
    1. Sellner J, Boggild M, Clanet M, Hintzen RQ, Illes Z, Montalban X, et al. EFNS guidelines on diagnosis and management of neuromyelitis optica. Eur J Neurol. 2010;17(8):1019–32. Epub 2010/06/10. 10.1111/j.1468-1331.2010.03066.x . - DOI - PubMed
    1. Carroll W, Saida T, Kim H, Kira J, Kermode A, Tsai C, et al. A guide to facilitate the early treatment of patients with idiopathic demyelinating disease (multiple sclerosis and neuromyelitis optica). Multiple sclerosis. 2013. Epub 2013/01/18. 10.1177/1352458512471092 . - DOI - PubMed
    1. Sato DK, Callegaro D, Lana-Peixoto MA, Nakashima I, Fujihara K. Seronegative Neuromyelitis Optica Spectrum–-the challenges on disease definition and pathogenesis. Arquivos de neuro-psiquiatria. 2014;72(6):445–50. . - PubMed

Publication types