. 2015 Oct 13:6:8545.
doi: 10.1038/ncomms9545.

Outward- and inward-facing structures of a putative bacterial transition-metal transporter with homology to ferroportin

Affiliations

Outward- and inward-facing structures of a putative bacterial transition-metal transporter with homology to ferroportin

Reiya Taniguchi et al. Nat Commun. .

Abstract

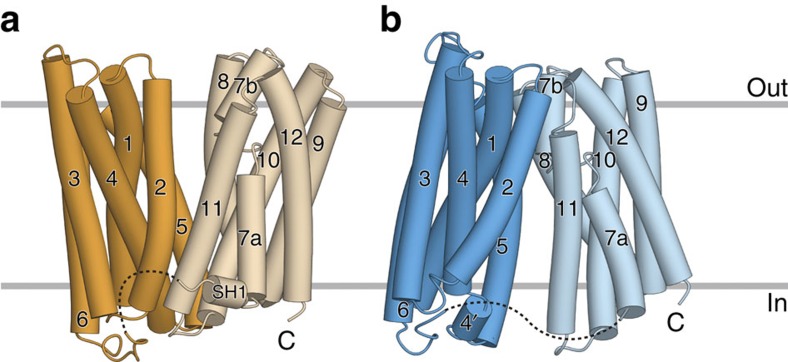
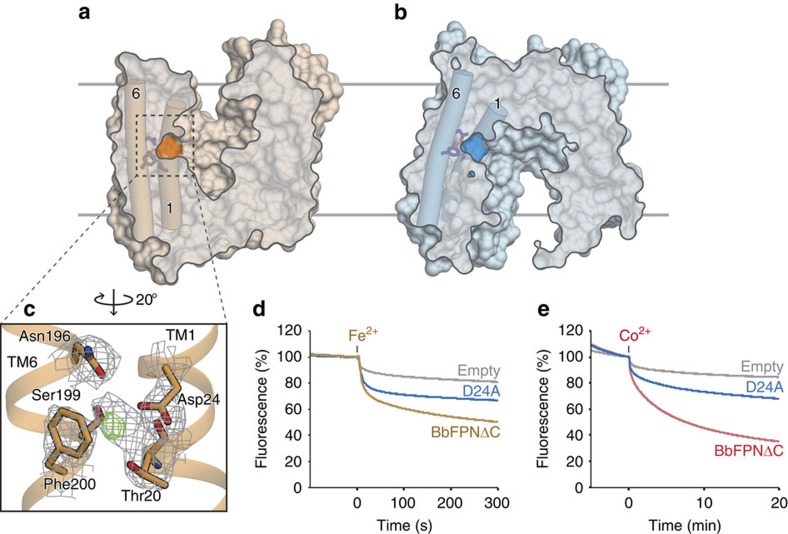
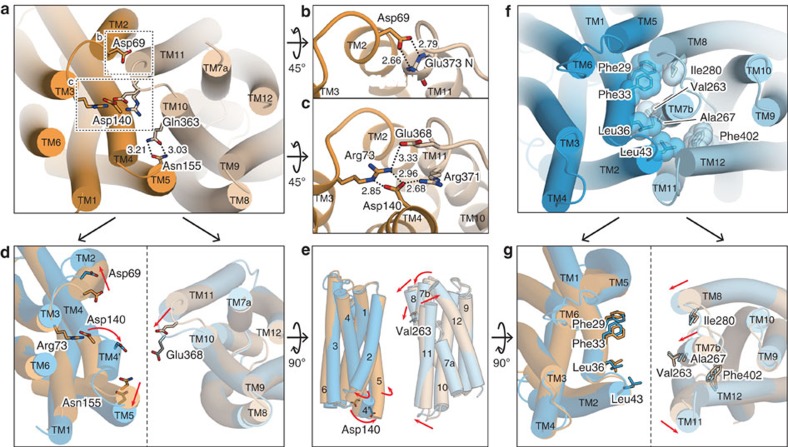
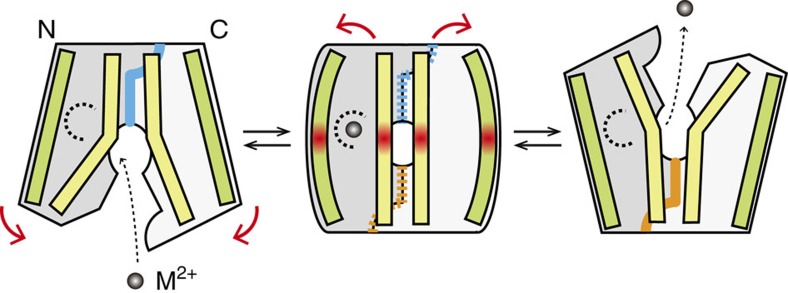
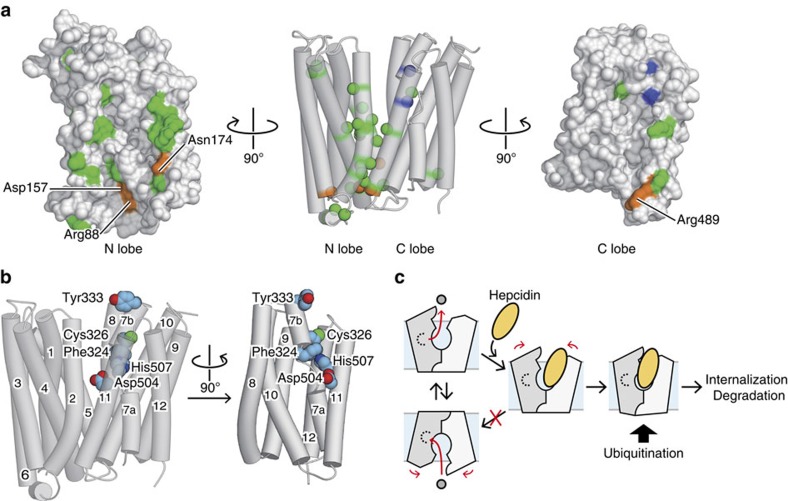
In vertebrates, the iron exporter ferroportin releases Fe(2+) from cells into plasma, thereby maintaining iron homeostasis. The transport activity of ferroportin is suppressed by the peptide hormone hepcidin, which exhibits upregulated expression in chronic inflammation, causing iron-restrictive anaemia. However, due to the lack of structural information about ferroportin, the mechanisms of its iron transport and hepcidin-mediated regulation remain largely elusive. Here we report the crystal structures of a putative bacterial homologue of ferroportin, BbFPN, in both the outward- and inward-facing states. Despite undetectable sequence similarity, BbFPN adopts the major facilitator superfamily fold. A comparison of the two structures reveals that BbFPN undergoes an intra-domain conformational rearrangement during the transport cycle. We identify a substrate metal-binding site, based on structural and mutational analyses. Furthermore, the BbFPN structures suggest that a predicted hepcidin-binding site of ferroportin is located within its central cavity. Thus, BbFPN may be a valuable structural model for iron homeostasis regulation by ferroportin.


Figures

Figure 1
Figure 1. Functional characterization of BbFPN.
(ad) BbFPN-mediated transport of (a) Fe2+, (b) Co2+, (c) Mn2+ and (d) Ni2+. Time-dependent quenching of calcein fluorescence inside the liposomes is shown. Addition of transition-metal cation and the ionophore calcimycin (Cal) is shown above the graphs. (eg) The transport activity of BbFPN measured with (e) the presence (+) or absence (−) of the ionophore gramicidin, (f) the pH gradient across the membrane, or (g) the different pH of the buffer solution. In eg the pH of the buffer solution is pH 7.0 unless otherwise stated in the boxes. The control data of empty liposomes were measured at pH 7.0. All measurements were repeated three times, and representative data are shown.
Figure 2
Figure 2. Overall structures of BbFPN.
Overall structures of BbFPN in (a) the outward-facing state and (b) the inward-facing state. In a the N lobe and C lobe of the outward-facing structure are coloured orange and pale orange, respectively. In b the N lobe and C lobe of the inward-facing structure are coloured blue and pale blue, respectively.
Figure 3
Figure 3. Metal-binding site.
(a,b) Cut away surface representations of (a) the outward-facing and (b) the inward-facing structures of BbFPN, viewed from the same orientation as in Fig. 2, visualizing the central cavity and the metal-binding site. The cross sections are shown semitransparently to visualize TM1 and TM6, which are shown as cylinders. The positions of the metal-binding residues are highlighted on the molecular surface, and also shown as stick models. (c) Close-up view of the Fe2+-binding site. The anomalous difference density of Fe2+ (contoured at 4σ) is shown as green mesh, and the refined 2Fo−Fc density (contoured at 1.5σ) is shown as grey mesh. The Fe2+ coordinating residues are shown as stick models. (d,e) The (d) Fe2+ and (e) Co2+ transport activities of the Asp24Ala mutant, measured using calcein fluorescence. The blue trace indicates the results from the Asp24Ala mutant. The liposome measurements were repeated three times, and representative data are shown.
Figure 4
Figure 4. Isothermal titration calorimetry data of BbFPN.
(a) The affinity of BbFPN toward Co2+ ion, measured using isothermal titration calorimetry. The data derived from (a) BbFPNΔC, (b) D24A, (c) N196A and (d) D24A/N196A double mutant are shown. The measurements were repeated twice, and similar results were obtained.
Figure 5
Figure 5. Structures of the intra- and extracellular gates and structural comparison.
(a) Overall structure of the intracellular gate of the outward-facing state viewed from the intracellular side. The residues constituting the gate interactions are shown as stick models. (b,c) Close-up views of the intracellular gate interactions around (b) Asp69 and (c) Asp140. (d) Structural comparison of the intracellular side. The N lobe (left) and the C lobe (right) are separately superimposed, and viewed from the intracellular side. The disordered part of the Glu368 side chain is indicated as grey sticks. (e) Superimposed N lobe (left) and C lobe (right), viewed from the membrane plane. (f) Overall structures of the extracellular gate of the inward-facing state viewed from the extracellular side. The residues constituting the gate interactions are shown as stick models, with CPK models superimposed. (g) Structural comparison of the extracellular side. The N lobe (left) and the C lobe (right) are separately superimposed, and viewed from the extracellular side. In d,e,g the relative motions of the helices in the inward-facing state, as compared with the outward-facing state, are indicated by red arrows. All of the models are coloured in the same manner as in Fig. 2.
Figure 6
Figure 6. Schematic model of the transport cycle.
Schematic representation of the BbFPN transport cycle. The scaffold helices are coloured green, and the helices at the inter-lobe interface are yellow. The metal-binding site is indicated as a dashed half circle. The intracellular gate interactions and the extracellular gate interactions between the two lobes are schematically represented as orange and blue lines, respectively. In the occluded state, which is shown in the middle, the distortions of the helices are indicated as red gradations. The incomplete formation of the gate interactions is indicated by dashed lines.
Figure 7
Figure 7. Mapping of functionally important residues on the hFPN homology model.
(a) Mapping of disease-related mutation sites on the hFPN homology model. The residues involved in the intracellular gate interactions and the hepcidin binding are coloured orange and blue, respectively. Other mutation sites are coloured green. In the middle panel, TM helices are represented as semitransparent cylinders, and the Cα atoms of the mutation sites are indicated by CPK spheres. The surface representation of the N lobe, viewed from the inside of the central cavity, is shown in the left panel, while that of the C lobe is shown in the right panel. (b) Mapping of the hepcidin-binding residues on the hFPN homology model. The side chains of these residues are represented by CPK models. In the right panel, the N lobe is omitted for clarity. (c) Possible model of the hepcidin-mediated inhibition of hFPN. Hepcidin, represented as the yellow oval, binds to the hFPN C lobe, inhibiting its state transition toward the inward-facing state. Hepcidin binding may also change the conformation of the intracellular side of hFPN, which triggers the ubiquitination and subsequent internalization.

References

    1. McKie A. T. et al.. A novel duodenal iron-regulated transporter, IREG1, implicated in the basolateral transfer of iron to the circulation. Mol. Cell 5, 299–309 (2000). - PubMed
    1. Donovan A. et al.. Positional cloning of zebrafish ferroportin1 identifies a conserved vertebrate iron exporter. Nature 403, 776–781 (2000). - PubMed
    1. Abboud S. & Haile D. J. A novel mammalian iron-regulated protein involved in intracellular iron metabolism. J. Biol. Chem. 275, 19906–19912 (2000). - PubMed
    1. Yang F. et al.. Regulation of reticuloendothelial iron transporter MTP1 (Slc11a3) by inflammation. J. Biol. Chem. 277, 39786–39791 (2002). - PubMed
    1. Hentze M. W., Muckenthaler M. U., Galy B. & Camaschella C. Two to tango: regulation of mammalian iron metabolism. Cell 142, 24–38 (2010). - PubMed

Publication types

LinkOut - more resources