. 2015 Oct 12;28(4):429-440.
doi: 10.1016/j.ccell.2015.09.007.

Adult Lineage-Restricted CNS Progenitors Specify Distinct Glioblastoma Subtypes

Affiliations

Adult Lineage-Restricted CNS Progenitors Specify Distinct Glioblastoma Subtypes

Sheila R Alcantara Llaguno et al. Cancer Cell. .

Abstract

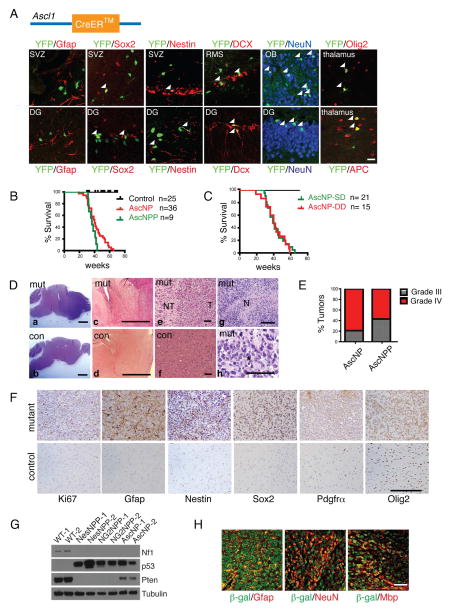
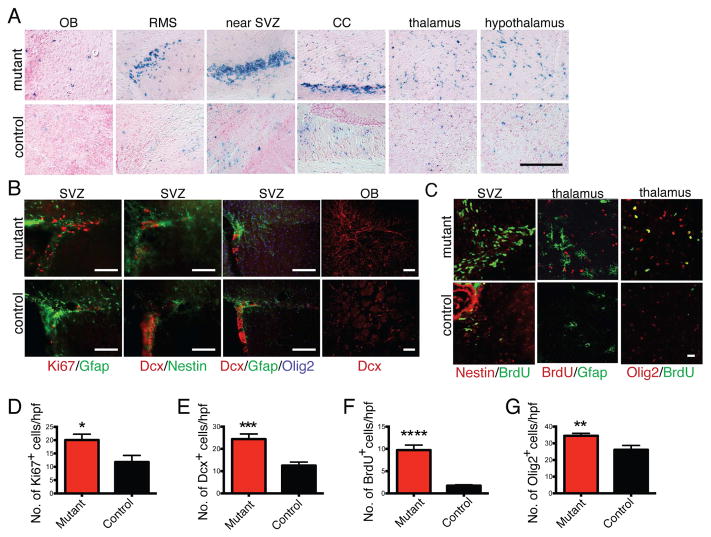
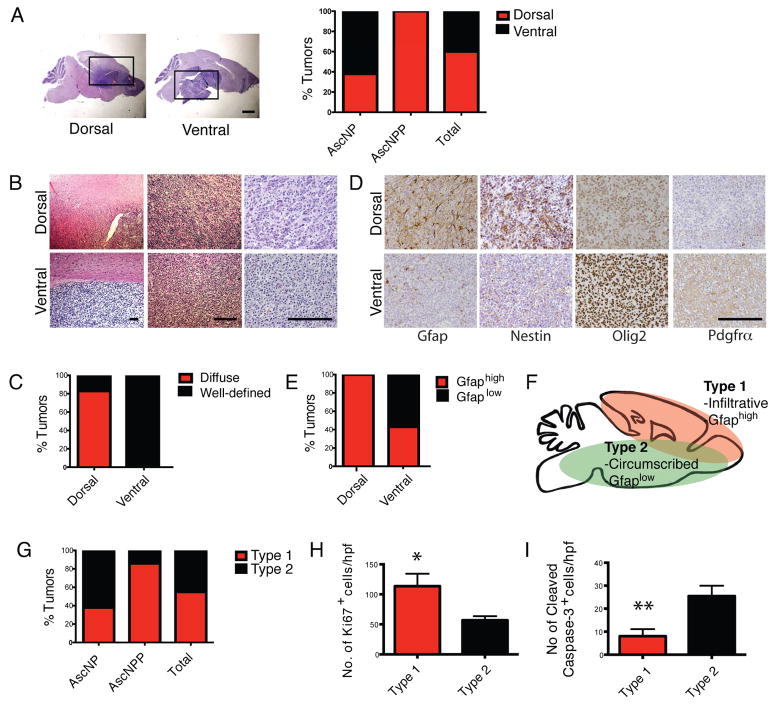
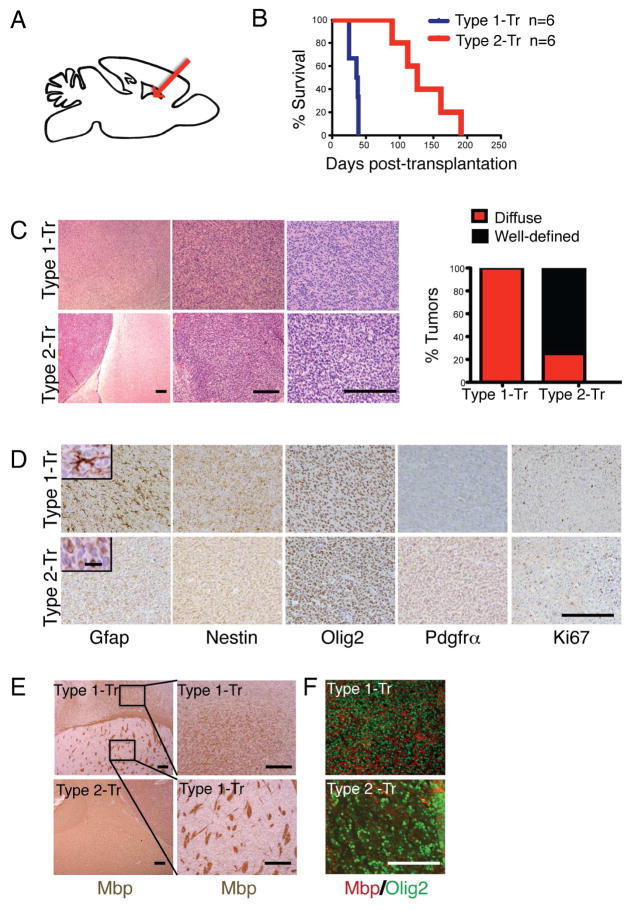
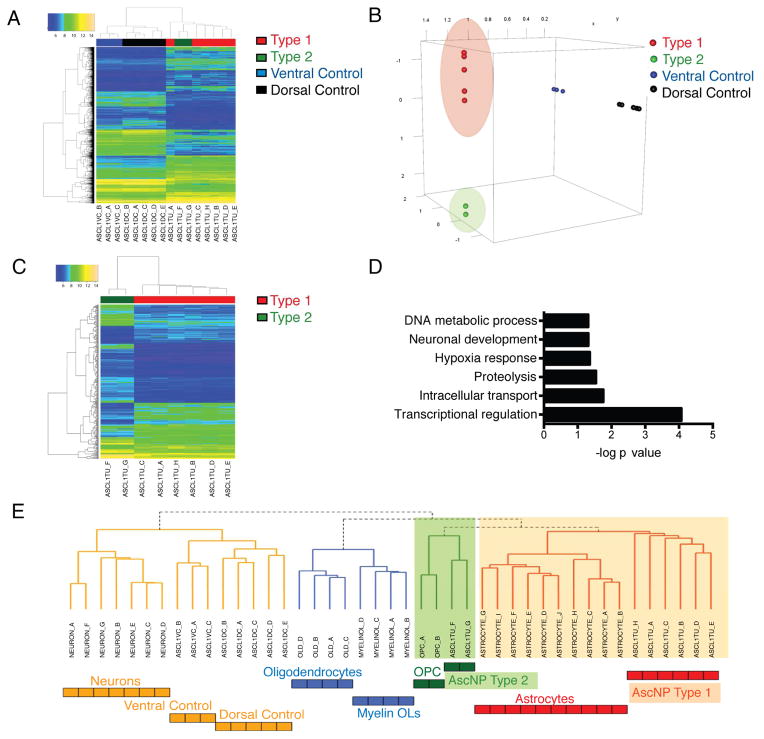
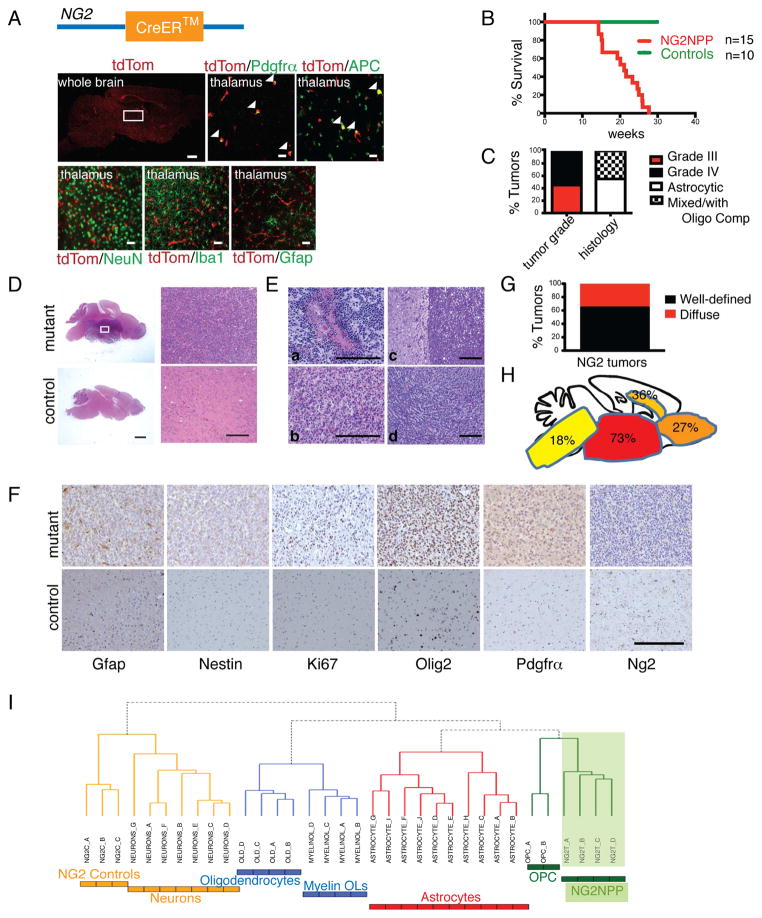
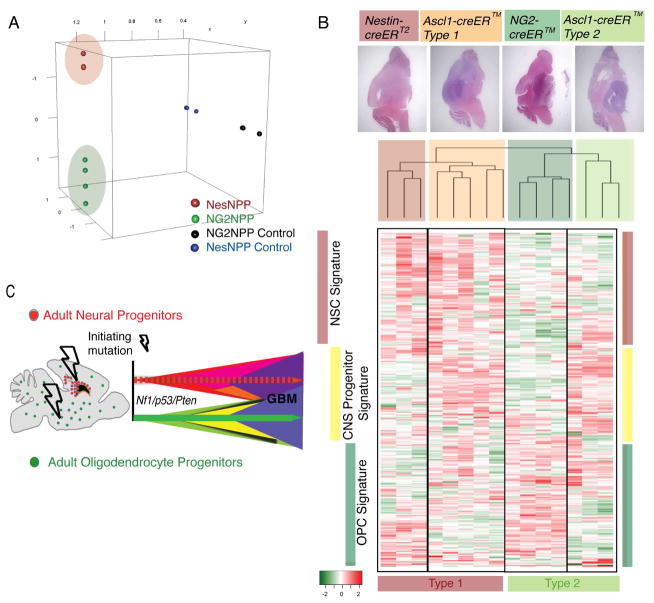
A central question in glioblastoma multiforme (GBM) research is the identity of the tumor-initiating cell, and its contribution to the malignant phenotype and genomic state. We examine the potential of adult lineage-restricted progenitors to induce fully penetrant GBM using CNS progenitor-specific inducible Cre mice to mutate Nf1, Trp53, and Pten. We identify two phenotypically and molecularly distinct GBM subtypes governed by identical driver mutations. We demonstrate that the two subtypes arise from functionally independent pools of adult CNS progenitors. Despite histologic identity as GBM, these tumor types are separable based on the lineage of the tumor-initiating cell. These studies point to the cell of origin as a major determinant of GBM subtype diversity.


Conflict of interest statement

The authors report no conflict of interest.

Figures

Figure 1
Figure 1. Tumor suppressor inactivation in adult lineage restricted CNS progenitors but not stem cells initiates GBM
(A) Schematic of Ascl1-creERTM transgene (top). Immunohistochemical staining of Ascl1-creERTM;R26-stop-YFP reporter adult mouse brain sections for YFP together with the neural stem cell–specific marker Gfap, neural stem/progenitor markers Sox2 and Nestin, immature neuronal marker doublecortin (Dcx), mature neuronal marker NeuN, OPC marker Olig2, and mature oligodendrocyte marker APC. Arrowheads mark YFP/marker co-localization. Scale bar: 20 μm (B) Kaplan-Meier survival curves of AscNP and AscNPP mice induced with tamoxifen at 4 weeks of age. Median survival: AscNP, 40 weeks; AscNPP, 36.7 weeks; p=0.0782. (C) Kaplan-Meier survival curves of AscNP mice induced with a single dose (SD) or double dose (DD) of tamoxifen. Median survival: SD, 39 weeks; DD, 33.5 weeks p=0.8044. (D) Representative H&E brain sections of AscNP and AscNPP mutant (mut) brains compared to controls (con; a–f). High-grade gliomas with characteristic features: indistinct tumor borders, with tumor cells (T) diffusely infiltrating into adjacent normal (NT) regions (e), pseudopalisading necrosis (N; g) and presence of mitotic figures (asterisk; h) are shown. Scale bars: a–b=1 mm; c–h=100 μm. (E) Bar graph showing percentage of AscNP and AscNPP tumors classified as WHO grade III or IV gliomas (n=16 AscNP, n=9 AscNPP mice). (F) Expression of high-grade glioma markers such as Ki67, Gfap, Nestin and Olig2, as well as progenitor markers Sox2 and Pdgfrα in AscNP and AscNPP tumors. Scale bar: 200 μm. (G) Western blot analysis of Nf1, p53, and Pten in AscNP, NG2NPP, and NesNPP tumors. Tubulin is used as a loading control. (H) Expression of mature differentiation markers (Gfap for astrocytes, NeuN for neurons, and myelin basic protein or Mbp for oligodendrocytes) in a subset of β-galactosidase positive (cre+) tumor cells in AscNP tumors with R26-stop-lacZ reporter. Scale bar: 100 μm. See also Figure S1.
Figure 2
Figure 2. Increased proliferation and accelerated differentiation precede tumor formation
(A) AscNP R26-stop-lacZ and control reporter mice were administered tamoxifen at 4 weeks of age and analyzed 4 months later by X-gal staining. CC: corpus callosum. Scale bar: 200 μm. (B) Proliferation (based on Ki67 staining) and expression of various markers (Gfap, Nestin, Doublecortin, Olig2) in the SVZ and OB of AscNP and control brains. Scale bars: 200 μm. (C) Immunohistochemistry with BrdU and progenitor markers following short term BrdU pulses. Scale bar: 20 μm. (D) Quantification of Ki67+ cells in SVZ (n=4 mutants, 4 controls; p<0.05). (E) Quantification of Dcx+ cells in OB (n=4 mutants, 4 controls; p=0.0001). (F) Quantification of BrdU+ cells in thalamus (n=3 mutants, 3 controls; p<0.0001). (G) Quantification of Olig2+ cells in thalamus (n=3 mutants, 3 controls; p<0.01). All statistical analyses used Student’s t test. All error bars denote mean ± SEM. See also Figure S2.
Figure 3
Figure 3. AscNP and AscNPP Mutants form Two Identifiable GBM Subtypes
(A) Left panels: Representative H&E staining images of AscNP and AscNPP brain sections showing a subgroup of gliomas in the dorsal brain and another subgroup found in ventral/basal region. Black boxes mark tumor regions. Scale bar: 1 mm. Right panel: Bar graph showing the percentage of gliomas in the dorsal and ventral brain regions that were identified in AscNP (n=13) and AscNPP (n=7) mutants. (B) H&E staining images of mutant brains showing tumor borders, at three different magnifications. Scale bars: 200 μM. (C) Bar graph showing the percentage of tumors that exhibit diffuse vs. well-defined tumor borders in dorsal (n=12) and ventral (n=8) tumors found in AscNP and AscNPP mice. (D) Immunohistochemistry of GBM markers in glioma subtypes found in AscNP and AscNPP mice. Scale bar: 200 μM. (E) Bar graph showing the percentage of dorsal (n=12) and ventral (n=8) tumors that shows high vs. low Gfap expression. (F) Schematic showing the general features of Type 1 vs. Type 2 gliomas. Type 1 gliomas are mostly diffuse tumors commonly found in the dorsal brain and exhibit high Gfap expression. Type 2 tumors are generally found in the ventral brain, show well-defined tumor borders, and exhibit low Gfap expression. (G) Bar graph showing the percentage of Type 1 and 2 tumors in AscNP (n=13) and AscNPP (n=7) mouse models. (H) Quantification of Ki67+ cells per high power field (20x magnification; n=4 Type 1 tumors, n=4 Type 2 tumors; p<0.05). (I) Quantification of Cleaved Caspase-3+ cells per high power field (20x magnification; n=3 Type 1 tumors, n=5 Type 2 tumors; p<0.005). All statistical analyses used Student’s t test. All error bars denote mean ± SEM. See also Figure S3.
Figure 4
Figure 4. Differential Growth of Transplanted Type 1 and Type 2 GBM Cells
(A) Schematic of transplantation experiments. Type 1 and Type 2 tumors from symptomatic AscNP mice were cultured in serum-free media with growth factors and 2 × 10⁵ tumor cells were subsequently transplanted into the dorsal striatum (arrow) of adult immunodeficient mice. (B) Kaplan-Meier survival curve of nude mice transplanted with Type 1 (n=6) compared with Type 2 tumor cells (n=6); p<0.01. Two independent lines for each tumor subtype were tested. Figure shows a representative survival curve for the independent lines used for each type. (C) H&E staining of tumors from Type 1 vs. Type 2 transplanted mice, and bar graph showing percentage of transplanted tumors with diffuse or well-defined tumor borders (n=6 tumors for each type analyzed). Scale bars: 200 μm. (D) Immunohistochemical staining using glioma markers. Scale bar: 200 μm. Insets show higher magnification images of Gfap staining (scale bar: 20 μm). (E) Mbp staining showing association with myelin fibers and fiber bundles in tumor regions of Type 1 vs. Type 2 transplanted mice. Right sub-panels show higher magnification images of a Type 1 tumor in the cortex (top) and striatum (bottom). Scale bars: 200 μm. (F) Immunofluoresence staining for Olig2 (tumor cells) and Mbp within the tumor bulk of Type 1 and Type 2 transplanted gliomas. Scale bars: 200 μm.
Figure 5
Figure 5. Distinguishable Molecular Signatures for Type 1 and Type 2 Gliomas
(A) Heat map of 2700 differentially expressed genes (DEGs) between AscNP tumors (n=8) and controls (n=8) and the result of unsupervised hierarchical clustering analysis. (B) Locally Linear Embedding (LLE) dimension reduction analysis depicting the DEGs projected in 3-dimensional space and showing separated groups of dorsal and ventral tissue controls as well as Type 1 and Type 2 gliomas (outlier removed). (C) Heat map of DEGs by direct comparison of AscNP Type 2 tumors with Type 1 tumors. (D) Gene Ontology Analysis of DEGs between Type 1 and 2 tumors. (E) Unsupervised hierarchical cluster analysis of gene expression profiles of Type 1 and 2 gliomas in comparison with different adult murine CNS cell states (derived from Cahoy et al., 2008). See also Tables S1–S3.
Figure 6
Figure 6. Adult Oligodendrocyte Progenitors are the Source of Type 2 GBM
(A) NG2-creERTM transgene schematic (top). Immunohistochemical staining of NG2-creERTM;R26-stop-TdTomato reporter together with OPC marker Pdgfrα, mature oligodendrocyte marker APC, neuronal marker NeuN, microglial marker Iba1 and astrocytic marker Gfap in OPC regions such as the thalamus (area denoted by white box in whole brain image). Arrowheads indicate co-localization of TdTomato with indicated marker. Scale bars: whole brain, 500 μm; all other sub-panels, 20 μm. (B) Kaplan-Meier survival curve of NG2NPP mice tamoxifen-induced at 4–8 weeks and aged until symptomatic (n=15 NG2NPP, 10 Controls). (C) Bar graph showing percentage of NG2NPP tumors classified as either WHO Grade III (n=5) or IV (n=6) gliomas or classified as malignant astrocytomas (n=6) or mixed differentiation gliomas (Anaplastic Oligoastrocytomas or Glioblastoma with Oligodendroglioma Component (GBMO); n=5). (D) Representative H&E staining of a histologically identifiable high-grade glioma in a symptomatic NG2NPP mutant mouse compared to a control mouse brain. White box indicates the tumor region magnified in the right top sub-panel; right bottom sub-panel shows the corresponding region in control brain. Scale bars: left two sub-panels, 1 mm; right two sub-panels, 200 μm. (E) Representative H&E staining of Grade IV tumors in NG2NPP mutant mice showing pseudopalisading necrosis (a), oligodendrocytic differentiation (b), circumscribed tumor with a clear boundary (c), and tumor with less defined borders (d). Scale bars: 200 μm. (F) Immunohistochemistry indicating expression of different markers in NG2NPP tumors. Scale bar: 200 μm. (G) Bar graph showing percentage of NG2NPP gliomas that exhibit lesions with identifiable borders (n=7 well-defined vs. n=4 diffuse). (H) Frequency of tumor locations in NG2NPP tumors. (I) Clustering Analysis of NG2NPP tumors with adult murine CNS cell types showing relatedness to OPCs. See also Figure S4 and Tables S4–S5.
Figure 7
Figure 7. Molecular Separation of Mouse Gliomas based on Cell of Origin
(A) LLE dimension reduction analysis showing the expression of 18,000+ genes probed by microarray and projected in 3-dimensional space in NesNPP and NG2NPP mouse models and their controls. (B) Analysis of mouse model gene expression profiles based on cell of origin. Top panels show representative tumors derived from Ascl1-creERTM (Type 1 and 2 tumors shown), Nestin-creERT2 and NG2-creERTM models. Unsupervised hierarchical clustering analysis of AscNP, NesNPP and NG2NPP tumors using differentially expressed genes from published data comparing SVZ neural stem cells and OPCs (Beckervordersandforth et al., 2010). Heat map represents the gene expression profile of the top 310 differentially expressed genes with the highest median absolute deviation (MAD >0.7) showing the molecular separation of the mouse model tumors based on the tumor-initiating cell. Side bars indicate lineage-specific signatures that highlight distinct expression patterns by GBMs derived from NSCs (NesNPP), Progenitors (AscNP Type 1 and 2) and OPCs (NG2NPP). Bottom bars emphasize the common Type 1 (NesNPP and AscNP Type 1) and Type 2 (NG2NPP and AscNP Type 2) tumors. (C) Model of adult progenitor cell of origin of gliomas. Our studies are consistent with the presence of at least two distinct lineages of GBM-initiating progenitors in the adult mouse brain. GBMs show overlapping histologic similarity but retain molecular differences arising from different cellular origins. See also Tables S6–S8.

Comment in

References

    1. Alcantara Llaguno S, Chen J, Kwon CH, Jackson EL, Li Y, Burns DK, Alvarez-Buylla A, Parada LF. Malignant astrocytomas originate from neural stem/progenitor cells in a somatic tumor suppressor mouse model. Cancer Cell. 2009;15:45–56. - PMC - PubMed
    1. Alvarez-Buylla A, Lim DA. For the long run: maintaining germinal niches in the adult brain. Neuron. 2004;41:683–686. - PubMed
    1. Beckervordersandforth R, Tripathi P, Ninkovic J, Bayam E, Lepier A, Stempfhuber B, Kirchhoff F, Hirrlinger J, Haslinger A, Lie DC, et al. In vivo fate mapping and expression analysis reveals molecular hallmarks of prospectively isolated adult neural stem cells. Cell Stem Cell. 2010;7:744–758. - PubMed
    1. Cahoy JD, Emery B, Kaushal A, Foo LC, Zamanian JL, Christopherson KS, Xing Y, Lubischer JL, Krieg PA, Krupenko SA, et al. A transcriptome database for astrocytes, neurons, and oligodendrocytes: a new resource for understanding brain development and function. J Neurosci. 2008;28:264–278. - PMC - PubMed
    1. Chen J, Kwon CH, Lin L, Li Y, Parada LF. Inducible site-specific recombination in neural stem/progenitor cells. Genesis. 2009;47:122–131. - PMC - PubMed

Publication types

Associated data