. 2015 Oct 12;28(4):441-455.
doi: 10.1016/j.ccell.2015.09.002.

Preferential Iron Trafficking Characterizes Glioblastoma Stem-like Cells

Affiliations

Preferential Iron Trafficking Characterizes Glioblastoma Stem-like Cells

David L Schonberg et al. Cancer Cell. .

Abstract

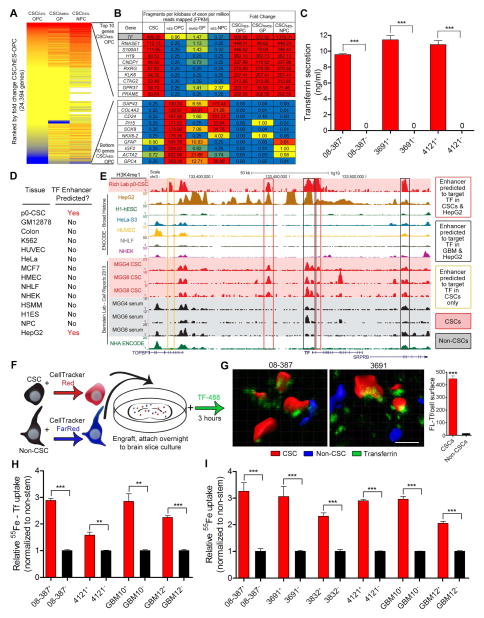
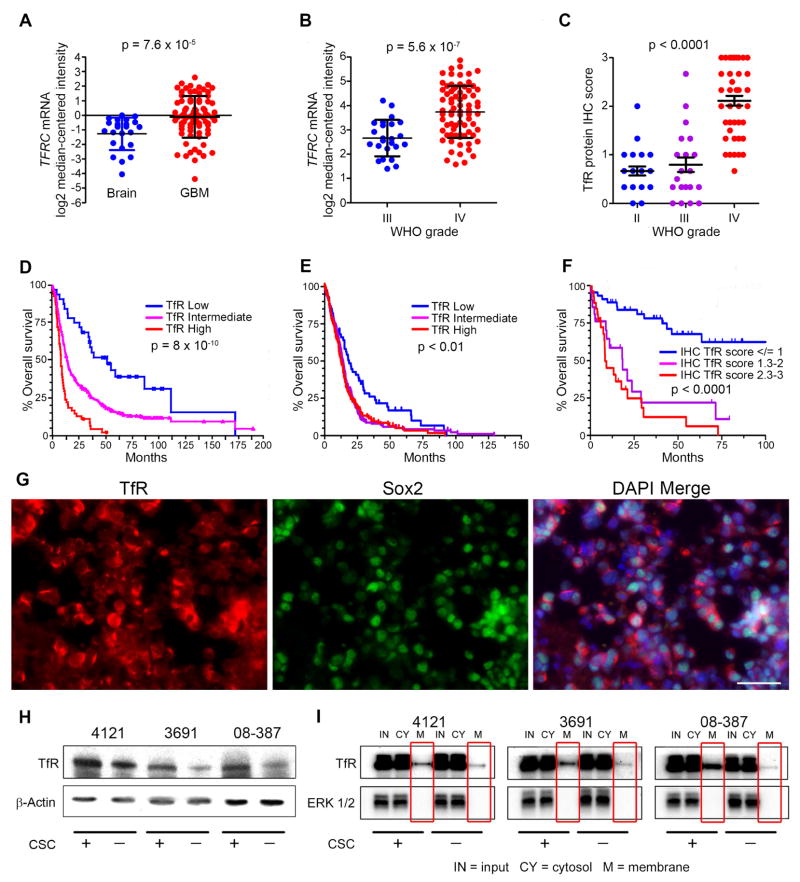
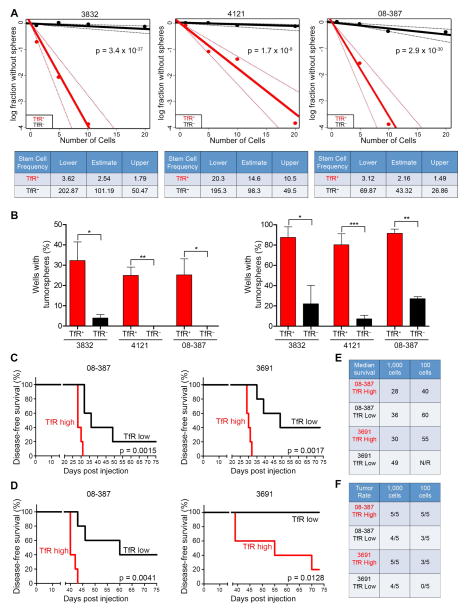
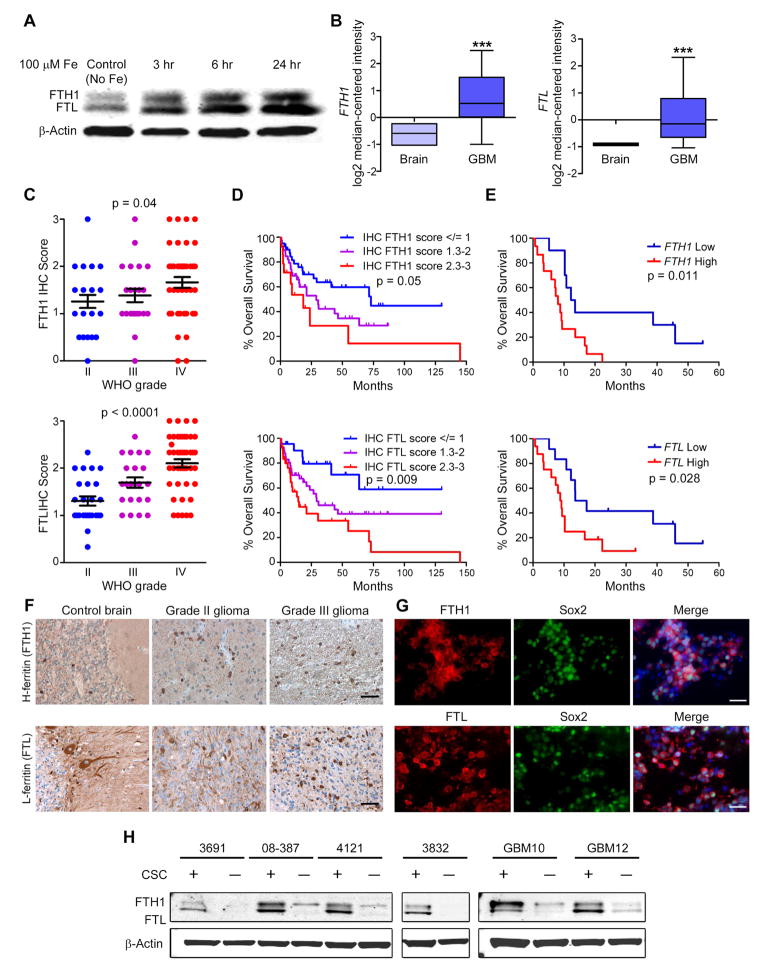
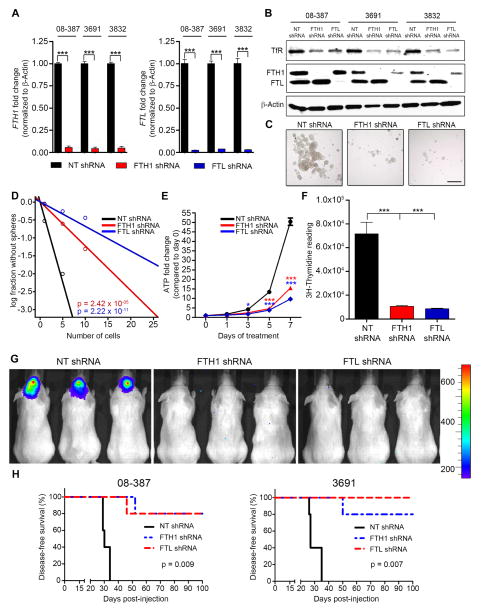
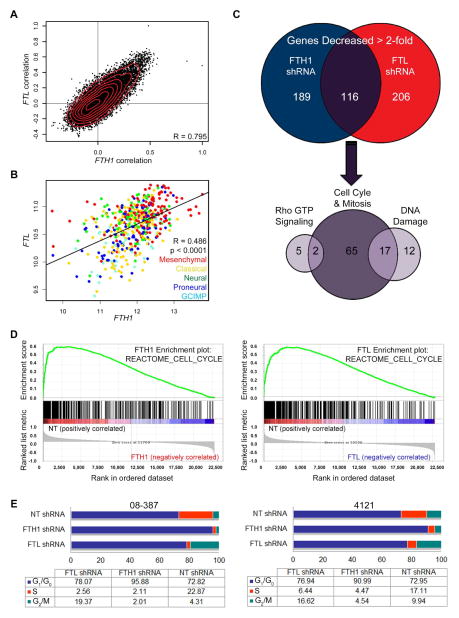
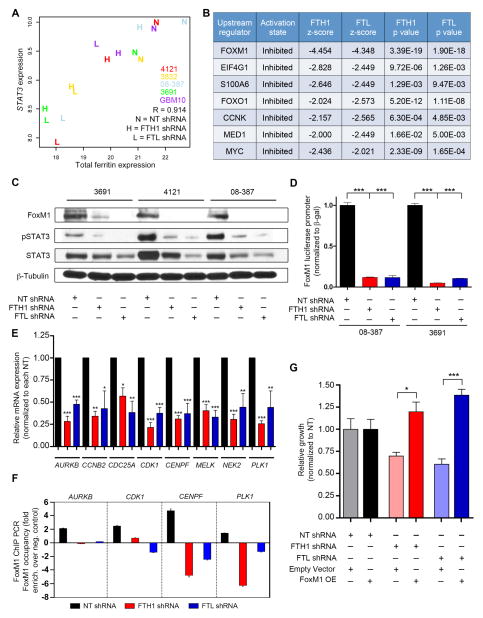
Glioblastomas display hierarchies with self-renewing cancer stem-like cells (CSCs). RNA sequencing and enhancer mapping revealed regulatory programs unique to CSCs causing upregulation of the iron transporter transferrin, the top differentially expressed gene compared with tissue-specific progenitors. Direct interrogation of iron uptake demonstrated that CSCs potently extract iron from the microenvironment more effectively than other tumor cells. Systematic interrogation of iron flux determined that CSCs preferentially require transferrin receptor and ferritin, two core iron regulators, to propagate and form tumors in vivo. Depleting ferritin disrupted CSC mitotic progression, through the STAT3-FoxM1 regulatory axis, revealing an iron-regulated CSC pathway. Iron is a unique, primordial metal fundamental for earliest life forms, on which CSCs have an epigenetically programmed, targetable dependence.


Conflict of interest statement

Conflict of Interest

The authors declare no conflict of interest.

Figures

Figure 1
Figure 1
Upregulation of TF through hepatocyte specific epigenetic program and increased iron uptake via TF in CSCs. (A) Heat map of fold change of gene expression (FPKM from RNA-seq) in CSCs versus normal neural progenitors. Red represents increased expression in CSCs compared to normal neural progenitor cells, while blue represents a decrease in expression in CSCs compared to normal controls. Samples compared are IN528 CSCs versus human Embryonic Stem (hES)-cell derived OPCs, Glial Progenitors (GP) derived from acute dissociated epilepsy resection, and hES-cell derived neuronal precursor cell (NPC). OPC and GP data was generated from this study while NPC data is from (Sauvageau et al., 2013). (B) Top and bottom 10 differentially expressed genes from cell types above (CSC FPKM/OPC FPKM). (C) TF secretion was measured in CSCs and non-CSCs using 1 μg protein from each xenograft specimen added to a transferrin ELISA (Abcam). ***, p < 0.001. (D) PreSTIGE analysis (Corradin et al., 2014) was conducted on H3K4me1 ChIP-seq data from CSCs and 13 ENCODE cell lines to determine enhancers predicted to target TF. (E) UCSC Browser image depicting H3K4me1 peaks at the TF locus. Red background designates acutely dissociated (p0) CSCs or in vitro (MGG) CSCs, black designates in vitro serum differentiated CSCs. Enhancers predicted by PreSTIGE to target TF in p0 CSCs. (F) Diagram of the experimental procedure for ex vivo imaging of TF uptake in brain slices. (G) Reconstructions of representative fields showing TF (green) in CSCs (red) and non-CSCs (blue) and quantification of fluorescent-Tf as measured on the surface of the three-dimensional reconstruction. ***, p = 4.73 × 10−166. Scale bar = 10 μm. (H) Radiolabeled iron (100 μM 55Fe bound to TF) uptake after 3 hr in CSCs compared to non-CSCs, **, p < 0.01; ***, p < 0.001. (I) Scavenge of iron (100 μM 55Fe) by CSCs and matched non-CSCs, ***, p < 0.001. Error bars represent ± SEM. See also Figure S1 and Table S1.
Figure 2
Figure 2
Elevated TfR expression in GBM indicates poor prognosis. (A, B) Analysis of brain tumor data sets from Oncomine for the mRNA level of TFRC in GBM compared to non-neoplastic brain (A; Sun dataset) and in high-grade glioma compared to lower grade glioma (B; Phillips dataset). (C) IHC scores of TfR in different grades of glioma in the Horbinski dataset. (D, E) Analysis of correlation between TFRC mRNA expression and glioma patient survival (D; REMBRANDT dataset and E; TCGA dataset). High expression represents 2-fold elevation vs. intermediate expression with log rank analysis. Low expression represents < 2-fold reduction vs. intermediate expression with log rank analysis. (F) Analysis of TfR protein expression score with patient survival; Horbinski dataset (WHO grades II–IV). (G) Immunofluorescence (IF) of TfR (red), Sox2 (green), and DAPI (blue) in GBM xenograft tissue. Scale bar = 50 μm. (H) Western blot of TfR and β-actin in CSCs and non-CSCs from 3 different GBM xenografts. (I) Membrane and cytosol fractions of TfR were determined in CSCs and non-CSCs. Error bars represent ± SEM. See also Figure S2.
Figure 3
Figure 3
TfR drives sphere formation in vitro and tumor formation in vivo. (A) In vitro limiting dilution assays plating decreasing numbers of FACS TfR+ or TfR tumor cells from freshly dissociated GBM xenografts calculated with extreme limiting dilution assay (ELDA) analysis (Top). Stem cell frequencies from TfR+ and TfR cells were calculated as the ratio 1/x, where 1 = stem cell and x = all cells (Bottom). (B) Percentage of wells that formed tumorspheres from either TfR+ or TfR GBM cells based on plating 1 cell/well (Left) or 10 cells/well (Right). Error bars represent ± SEM. (C, D) Survival curves of mice orthotopically implanted with TfR-high or TfR-low expressing GBM cells at dilutions of 1,000 cells (C) or 100 cells (D); n = 5 for all groups. (E, F) Median survival (E, in days post injection) and tumor incidence (F, in days) in mice bearing GBM cells. See also Figure S3.
Figure 4
Figure 4
Ferritin is preferentially expressed in CSCs. (A) Western blot of FTH1 and FTL following treatment with 100 μM Fe. (B) In silico analysis of brain tumor datasets from Oncomine showing FTH1 and FTL expression in GBM compared to normal brain tissue. Middle box line represents median, top box line represents upper quartile, bottom box line represents lower quartile, top error bar represents 90th percent and bottom error bar represents 10th percent. ***, p < 0.001. (C) Quantification of FTH1 and FTL IHC intensity with glioma grade. Error bars represent ± SEM. (D) Correlation between overall survival of glioma patients and FTH1 and FTL IHC score of their tumor from the Horbinski dataset (WHO grades II–IV). (E) Correlations between FTH1 or FTL expression and patient survival in the TCGA dataset. (F) Ferritin IHC of control brain, low-grade and high-grade glioma tissue. Scale bar = 50 μm. (G) IF labeling of GBM xenografts with FTH1 (Top, red) or FTL (Bottom, red), Sox2 (green), and DAPI (blue). Scale bar = 50 μm. (H) Western blot of FTH1, FTL and β-actin in CSCs and non-CSCs from 6 different GBM xenografts.
Figure 5
Figure 5
Targeting ferritin decreases CSC growth in vitro and tumor formation in vivo. (A–B) qRT-PCR of FTH1 and FTL mRNA (A) and immunoblot of proteins (B) in CSCs following transduction with NT, FTH1, or FTL shRNA. (C) CSC-derived tumorsphere formation following ferritin knockdown. Scale bar = 200 μm. (D) In vitro limiting dilution assays of CSCs transduced with NT, FTH1, or FTL shRNA calculated with ELDA analysis. (E) ATP-dependent growth in CSCs after ferritin knockdown. *, p < 0.05; ***, p < 0.001. (F) CSC proliferation following ferritin knockdown, measured by 3H-thymidine incorporation. ***, p < 0.001. (G) In vivo imagining 2 weeks post-orthotopic injection of CSCs expressing luciferase, transduced with NT, FTH1, or FTL shRNA. (H) Kaplan-Meier curves indicating survival of mice bearing intracranial injections of 10,000 CSCs with ferritin knockdown. Error bars represent ± SEM. See also Figure S4.
Figure 6
Figure 6
Gene expression profiling reveals ferritin dependence for cell cycle progression. (A) Genome-wide analysis of TCGA GBM dataset that demonstrates genes (points on graph) displaying correlation coefficients with FTH1 (x-axis) and correlation coefficients with FTL (y-axis). (B) FTH1 and FTL expression in TCGA GBM dataset based on subtype. (C) Affymetrix HuGene 2.1 microarray analysis of all genes decreased ≥ 2-fold from 5 different GBM specimens following ferritin shRNA compared to NT shRNAs. (D) Geneset enrichment analysis using the C2 canonical pathways Broad MsigDB database on gene expression data compared non-targeting control against FTH1 (left) or FTL (right) knockdown. (E) Cell cycle analysis of two GBM specimens following transduction with NT, FTH1, or FTL shRNA. See also Figure S5 and Table S2.
Figure 7
Figure 7
FoxM1 signaling requires intact ferritin. (A) Correlation of STAT3 with total ferritin following ferritin knockdown. Colors represent individual xenograft specimens. (B) Ingenuity upstream analysis of pathways down-regulated by ferritin shRNA-derived gene expression data. (C) Immunoblot of FoxM1, pSTAT3 and total STAT3 following ferritin knockdown in CSCs. (D) Ferritin knockdown effect on FoxM1 promoter activity in 08-387 CSCs, measured with a luciferase reporter construct; ***, p < 0.001. (E) Relative mRNA levels of FoxM1 downstream targets derived from gene expression data (averages taken from specimens 4121, 3832, 3691, 08-387 and GBM10); *, p < 0.05; **, p < 0.01; ***, p < 0.001. (F) ChIP PCR of FoxM1 targets performed on 08-387 CSCs transduced with NT, FTH1, or FTL shRNA. (G) Transient FoxM1 overexpression in 08-387 CSCs 48h following ferritin knockdown; *, p < 0.05; ***, p < 0.001. Error bars represent ± SEM. See also Figure S6.

References

    1. Akhtar-Zaidi B, Cowper-Sal-lari R, Corradin O, Saiakhova A, Bartels CF, Balasubramanian D, Myeroff L, Lutterbaugh J, Jarrar A, Kalady MF, et al. Epigenomic enhancer profiling defines a signature of colon cancer. Science. 2012;336:736–739. - PMC - PubMed
    1. De Arriba Zerpa GA, Saleh MC, Fernández PM, Guillou F, Espinosa de los Monteros A, de Vellis J, Zakin MM, Baron B. Alternative splicing prevents transferrin secretion during differentiation of a human oligodendrocyte cell line. J Neurosci Res. 2000;61:388–395. - PubMed
    1. Bao S, Wu Q, McLendon RE, Hao Y, Shi Q, Hjelmeland AB, Dewhirst MW, Bigner DD, Rich JN. Glioma stem cells promote radioresistance by preferential activation of the DNA damage response. Nature. 2006a;444:756–760. - PubMed
    1. Bao S, Wu Q, Sathornsumetee S, Hao Y, Li Z, Hjelmeland AB, Shi Q, McLendon RE, Bigner DD, Rich JN. Stem cell-like glioma cells promote tumor angiogenesis through vascular endothelial growth factor. Cancer Res. 2006b;66:7843–7848. - PubMed
    1. Cao Y, Lathia JD, Eyler CE, Wu Q, Li Z, Wang H, McLendon RE, Hjelmeland AB, Rich JN. Erythropoietin Receptor Signaling Through STAT3 Is Required For Glioma Stem Cell Maintenance. Genes Cancer. 2010;1:50–61. - PMC - PubMed

Publication types

MeSH terms

Associated data