. 2015 Oct 12;28(4):500-514.
doi: 10.1016/j.ccell.2015.09.003.

Targeting Human Cancer by a Glycosaminoglycan Binding Malaria Protein

Affiliations

Targeting Human Cancer by a Glycosaminoglycan Binding Malaria Protein

Ali Salanti et al. Cancer Cell. .

Abstract

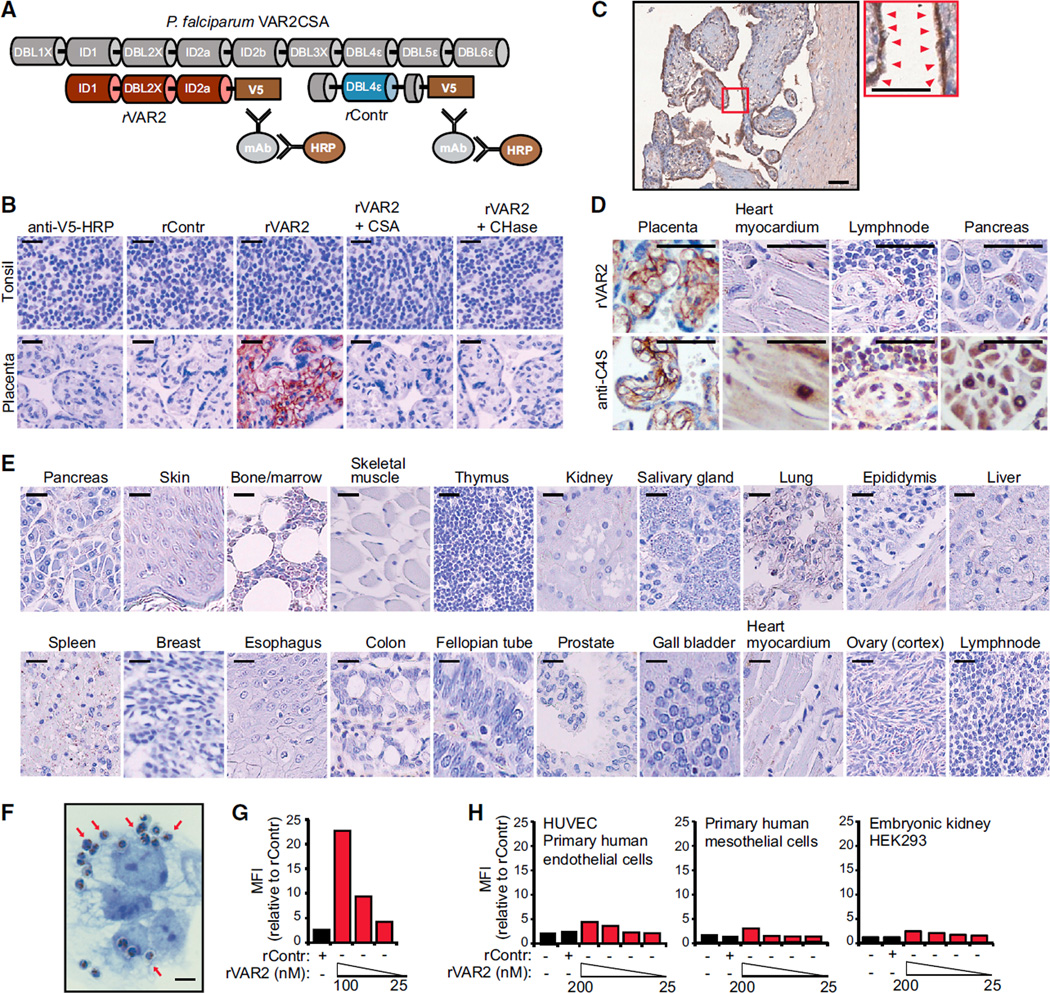
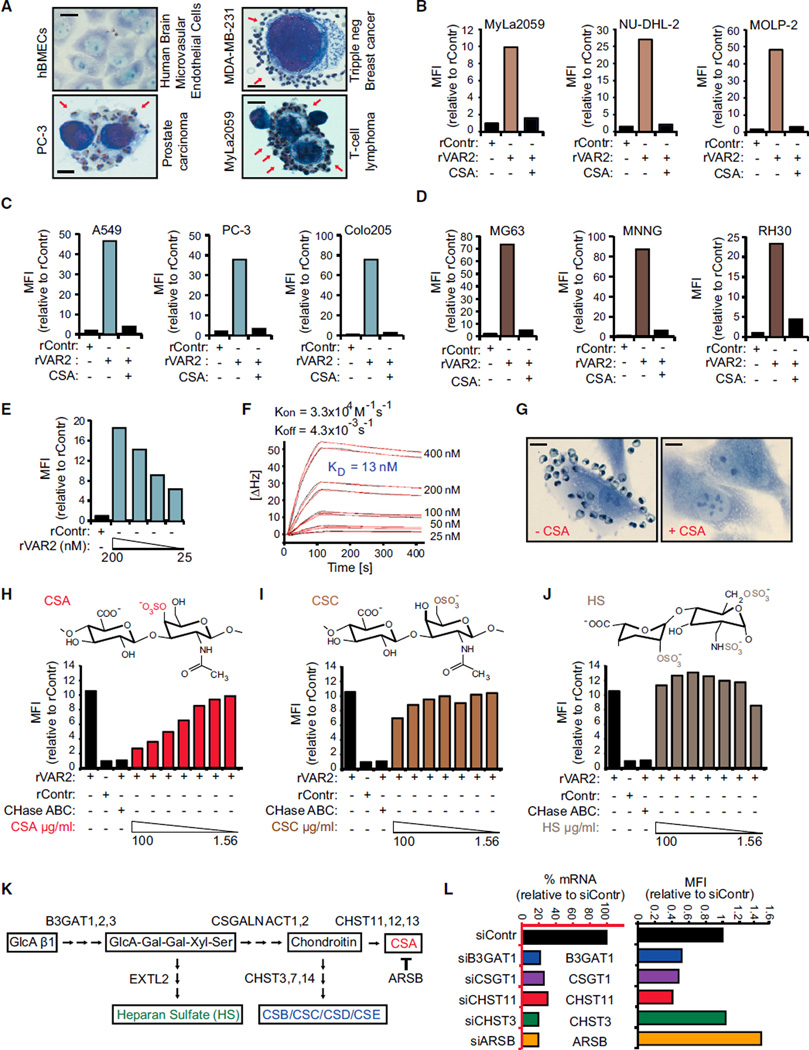
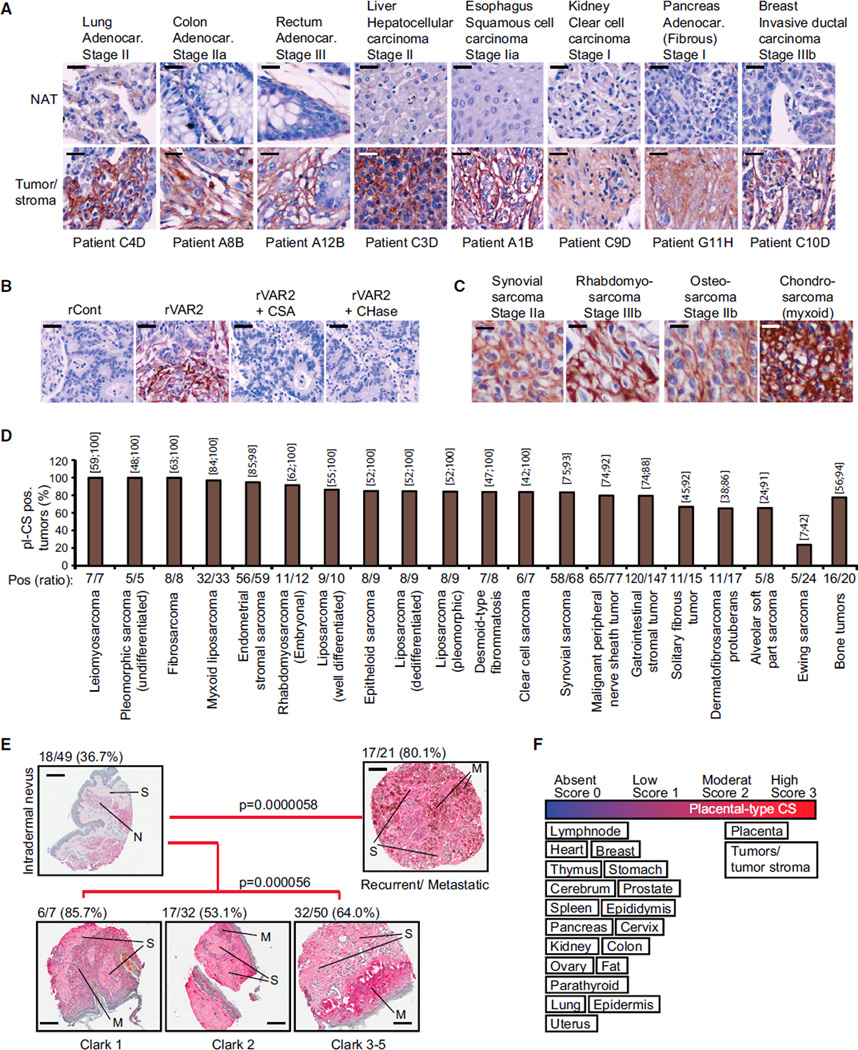
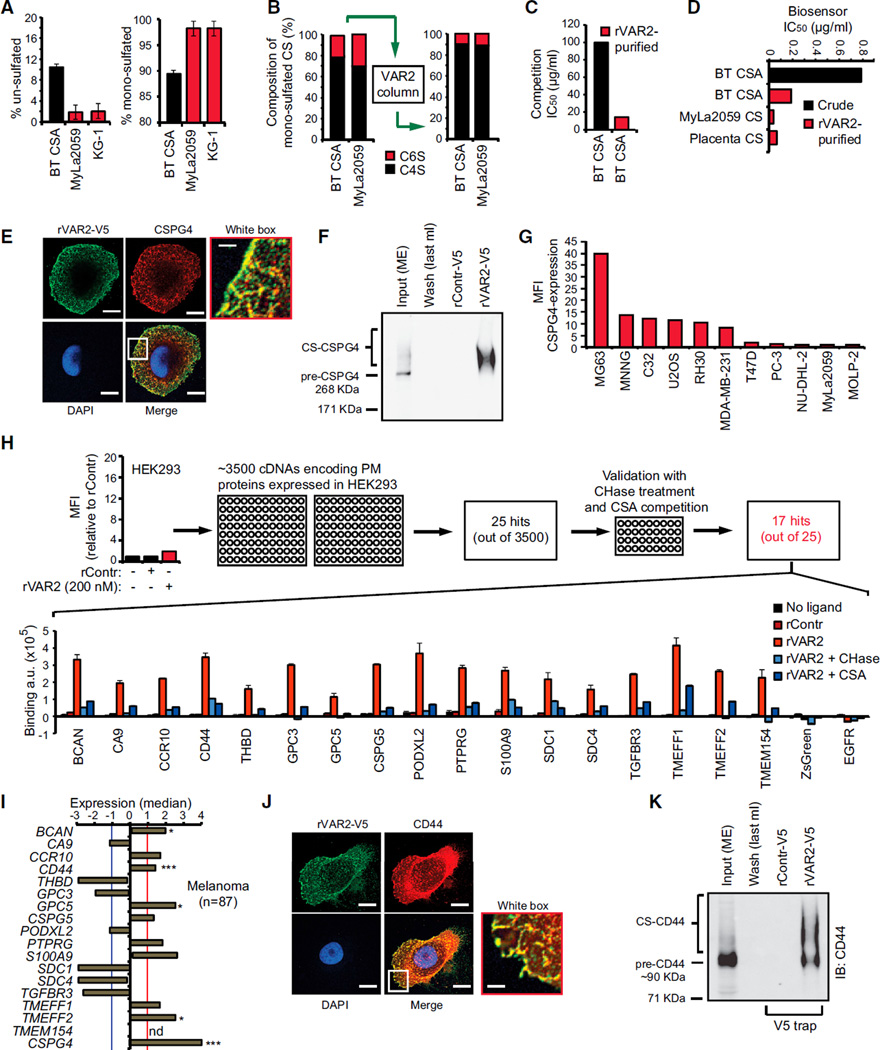
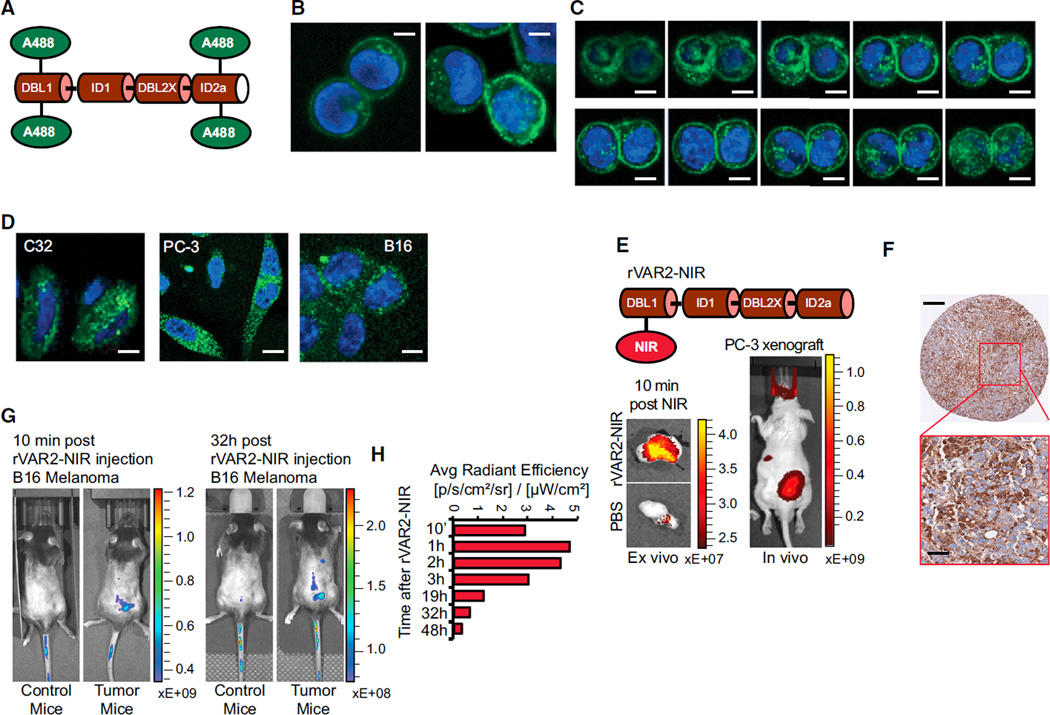
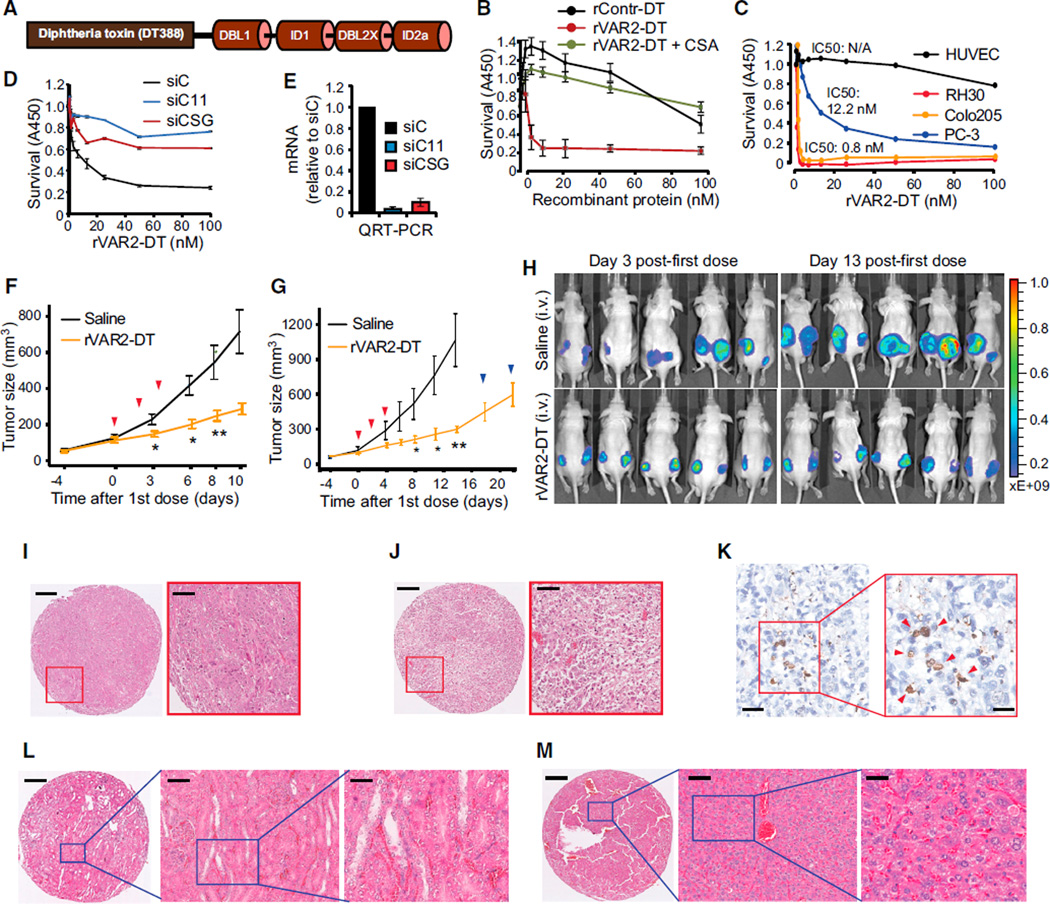
Plasmodium falciparum engineer infected erythrocytes to present the malarial protein, VAR2CSA, which binds a distinct type chondroitin sulfate (CS) exclusively expressed in the placenta. Here, we show that the same CS modification is present on a high proportion of malignant cells and that it can be specifically targeted by recombinant VAR2CSA (rVAR2). In tumors, placental-like CS chains are linked to a limited repertoire of cancer-associated proteoglycans including CD44 and CSPG4. The rVAR2 protein localizes to tumors in vivo and rVAR2 fused to diphtheria toxin or conjugated to hemiasterlin compounds strongly inhibits in vivo tumor cell growth and metastasis. Our data demonstrate how an evolutionarily refined parasite-derived protein can be exploited to target a common, but complex, malignancy-associated glycosaminoglycan modification.


Figures

Figure 1
Figure 1. rVAR2 Detects a Distinct CS Modification in Human Placenta
(A) Schematic illustration of full-length P. falciparum VAR2CSA (gray), recombinant minimal CS-binding region (red), and recombinant non-CS binding region rContr (blue). The antibodies toward the C-terminal V5 tag are used to detect rVAR2. (B) Representative images of indicated tissue specimens incubated with anti-V5 + anti-mouse-HRP alone (anti-V5-HRP) or in combination with recombinant rContr or rVAR2 with or without chondroitinase ABC (CHase ABC) or purified CSA. The scale bar represents 20 µm. (C) Human placenta tissue stained as in (B), red arrows indicate pl-CS on the syncytium. The scale bars represent 10 µm. (D) The denoted tissues stained for total CSA using enzymatic GAG end-processing and anti-C4S (2B6) antibody or for CS detected by rVAR2 as in (B). The scale bar represents 10 µm. (E) A selection of 20 normal tissues stained as in (B). The scale bar represents 20 µm. (F) Representative image of P. falciparum-infected, VAR2CSA-expressing erythrocytes bound to the plasma membrane (red arrows) of trophoblastic BeWo cells. The scale bar represents 1 µm. (G) Relative mean fluorescence intensity (MFI) of trophoblastic BeWo cells incubated with recombinant rContr or rVAR2 as indicated and detected by flow cytometry using anti-V5-FITC. (H) HUVECs, human primary mesothelial cells, and human embryonic kidney cells (HEK293) analyzed as in (G). See also Figure S1.
Figure 2
Figure 2. rVAR2 Detects pl-CS on Cancer Cells
(A) Representative images of indicated normal primary cells (hBMECs) and tumor cells (PC-3, MDA-MB-231, and MyLa2059) with adherence P. falciparum-infected, VAR2CSA-expressing human erythrocytes (red arrows). The scale bar represents 1 µm. (B–D) Relative mean fluorescence intensity (MFI) of representative hematological (B), epithelial (C), or mesenchymal (D) lineage human cancer cell lines incubated with recombinant rContr or rVAR2 in combination with soluble CSA as indicated and detected by flow cytometry using anti-V5-FITC. (E) C32 human melanoma cells incubated with recombinant rContr or indicated concentrations of recombinant rVAR2 analyzed as in (B). (F) Sensorgram showing binding between recombinant VAR2CSA and immobilized C32 cells measured in delta Hertz [ΔHz] as a function of time (s) using the indicated concentrations of recombinant protein. The black lines represent data and the red lines represent fitted curves attained by a 1:1 binding model. The affinity is given as KD values calculated from Kon and Koff. (G) Representative images of C32 melanoma cells flushed over with P. falciparum-infected human erythrocytes in absence (CSA) or presence (+CSA) of soluble CSA. The scale bar represents 1 µm. (H–J) Relative mean fluorescence intensity (MFI) of C32 melanoma cells incubated with recombinant rContr or rVAR2 in combination with chondroitinase ABC (CHase ABC), soluble CSA, (H), CSC (I), or HS (J) as indicated and detected by flow cytometry using anti-V5-FITC. (K) Schematic illustration of key enzymatic events in the CS synthesis pathway. (L) rVAR2 binding (black bars, right) and RT-PCR readout of mRNA levels (blue bars, left) of U2OS cells transfected with control (C), B3GAT1 (B3), CSGALNACT1 (CSG), CHST11 (C11), CHST3 (C3), or ARSB (AB) siRNAs. See also Figure S2 and Table S1.
Figure 3
Figure 3. Diverse Types of Human Cancer Express pl-CS
(A) Representative images of indicated patient-matched primary tumor and normal adjacent tissue (NAT) specimens stained with rVAR2-V5 and detected by anti-V5-HRP. The scale bar represents 10 µm. (B) Representative images of stage IIa breast tumors stained with rContr or rVAR2 as in (A) with or without soluble CSA or chondroitinase ABC (CHase ABC). The scale bar represents 10 µm. (C) Representative images of indicated soft-tissue and bone sarcomas stained with rContr or rVAR2 as in (A). The scale bar represents 5 µm. (D) Column graph representation of pl-CS staining intensity in the indicated soft-tissue and bone sarcoma subtypes (n = 552) processed as in (A) and scored (0–3) for binding to recombinant VAR2CSA. The columns show the percentage and exact binomial 95% confidence interval of pl-CS positive (score 2–3) tumors. (E) Representative images of a melanoma progression TMA stained with anti-V5-HRP in combination with recombinant rVAR2 and scored (0–3). The fraction of score 2–3 (moderate/high) pl-CS (pl-CS) positive tumors was identified and p values were generated by the Goodman-Kruskal-Gamma test (Nevus, N; Stroma, S; and Melanoma cells, M). The scale bar represents 40 µm. (F) Schematic representation of pl-CS expression in the indicated tissue categories. See also Figure S3 and Table S2.
Figure 4
Figure 4. Defining the rVAR2 CS Epitope
(A) Level of un-sulfated (left) and mono-sulfated (right) disaccharides of extracted CS from Sigma BT-CSA, T cell lymphoma (MyLa2059), and myeloid leukemia (KG-1) determined by liquid chromatography MS analysis. The values are given as a percentage of the total CS in the sample. (B) BT-CSA and MyLa2059 CSA were affinity purified on a custom made rVAR2 column and eluted in a NaCl gradient. The composition of the mono-sulfated CS was analyzed by tandem MS before (left) and after (right) affinity purification. (C) Binding inhibition capacity of BT-CSA before and after rVAR2 affinity purification is shown as the concentration needed to block 50% of the binding (IC50 values) between rVAR2 and the cells as measured by flow cytometry. (D) Biosensor analyses of the capacity of BT-CSA (before and after rVAR2 affinity purification) and rVAR2 affinity-purified Myla2059 and placental CS, to inhibit rVAR2 binding to immobilized CSPG. The binding inhibition is shown as the concentration needed to block 50% of the binding (IC50 values) between rVAR2 and the cells. (E) Representative picture of a C32 human melanoma cell co-stained for CS using rVAR2-V5 (green) and CSPG4 (red). The co-localization was analyzed by confocal microscopy. The scale bar represents 0.5 µm. (F) Extracted membrane proteins (Input ME) from C32 melanoma cells were subjected to anon-column pulldown on a HiT rap NHS column coupled with rVAR2-V5 or rControl-V5. The figure shows Input (ME), last 1 ml of wash of the rVAR2-V5 column, and the 0.5 M NaCl elution following concentration. The samples were analyzed for precipitation of precursor (pre-CSPG4) and CSA-conjugated CSPG4 by immunoblotting (IB:CSPG4) as indicated. (G) Relative mean fluorescence intensity (MFI) of indicated cell lines incubated with anti-CSPG4 antibody and detected by flow cytometry. (H) Relative mean fluorescence intensity (MFI) of HEK293 cells incubated with recombinant rContr or rVAR2 as indicated and detected by flow cytometry using anti-V5-FITC. The HEK293 cells were transfected with 3,500 cDNAs encoding known tumor-associated plasma membrane proteins inserted in a ZsGreen expression system and analyzed for their ability to facilitate binding to recombinant rVAR2 detected by anti-V5-Alexa647. The column graph displays quantified anti-V5-Alexa647 detection (arbitrary units, a.u.) in HEK293 cells transfected with the indicated plasma membrane proteins and left un-treated (no ligand), or treated with recombinant rContr, rVAR2 alone, or in combination with chondroitinase ABC (rVAR2 + CHase) or purified CSA (rVAR2 + CSA). (I) Median expression compared to overall average of the genes encoding the 17 proteins from (H) plus CSPG4 in primary melanoma (n = 87) patient specimens extracted from the Oncomine Riken melanoma array (*p < 0.05 and ***p < 0.001) (not determined: nd) (missing probe). The red and blue cross-lines designate the threshold for up and downregulated. (J) Representative picture of a C32 human melanoma cell co-stained for CS using rVAR2-V5 (green) and CD44 (red). The co-localization was observed by confocal microscopy. The scale bar represents 0.5 µm. (K) Extracted membrane proteins (Input ME) from C32 melanoma cells were subjected to an on-column pulldown on a HiTrap NHS column coupled with rVAR2-V5 or rControl-V5. The figure shows Input (ME), last 1 ml of wash of the rVAR2-V5 column, and the 0.5 M NaCl elution following up-concentration. The samples were analyzed for precipitation of precursor (pre-CD44) and CS-conjugated CD44 by immunoblotting (IB:CD44) as indicated. The error bars indicate ± SD. See also Figure S4 and Tables S3–S5.
Figure 5
Figure 5. rVAR2 Internalization and In Vivo Tumor Localization
(A) Schematic illustration of rVAR2 conjugated with Alexa-488 (rVAR2-A488). (B) Colo205 colon carcinoma cells analyzed by confocal microscopy 5 (left) and 30 (right) min after addition of rVAR2-FITC (green) and DAPI (blue). The scale bar represents 0.5 µm. (C) Confocal microscopy analysis of Colo205 cells as in (B) displayed as vertical depth at 30 min after addition of rVAR2-FITC. The scale bar represents 0.5 µm. (D) C32 melanoma, PC-3 prostate adenocarcinoma, and B16 murine melanoma cells analyzed as in (B) 30 min after addition of rVAR2-FITC. The scale bar represents 0.5 µm. (E) Schematic illustration of rVAR2 conjugated with NIR Alexa-750 (rVAR2-NIR) probe (upper) and in vivo (right) and ex vivo (left) detection of NIR signal in PC-3 tumor xenografts 10 min post-rVAR2-NIR injection in tail vein. (F) IHC of PC-3 tumor xenografts stained with rVAR2-V5 and detected by anti-V5-HRP. The scale bar represents 40 µm. (G) C57BL/6 mice with no tumors (Control mice) or carrying established B16 murine melanoma tumors (Tumor mice) were injected with rVAR2-NIR in the tail vein at day 10 and scanned in an IVIS Spectrum CT scanner. (H) Quantification of IVIS signal from a subcutaneous B16 tumor (right flank) after rVAR2-NIR injection at different time intervals from 10 min to 48 hr. The right flank signal is considered as background and is subtracted from the initial signal.
Figure 6
Figure 6. In Vivo Cancer Targeting Using rVAR2 Fusion Construct rVAR2-DT388
(A) Schematic figure showing the architecture of the rVAR2-DT388 fusion protein. (B) Survival of B16 melanoma cells treated with increasing concentrations (0–100 nM) of a DT-fused (rContr-DT) or rVAR2-DT with or without CSA competition as indicated and analyzed for WST1 staining 96 hr post-treatment. The error bars indicate ± SD. (C) Survival of indicated cell lines treated with increasing concentrations (0–100 nM) of rVAR2-DT. (D) PC-3 cells were transfected with control siRNA (siC) or siRNAs targeting CHST11 (siC11) or CSGALNACT1 (siCSG) and treated with the indicated concentrations (0–100 nM) of rVAR2-DT for 96 hr before analyzed for survival using methylene blue staining assay. The error bars indicate ± SD. (E) Quantitative RT-PCR of indicated mRNA levels in PC-3 cells after 72 hr post-transfection with control siRNA (siC), CSGALNACT1 siRNA (siCSG), and CHST11 siRNA (siC11). The error bars indicate ± SD. (F and G) Quantification of tumor volume over 10 days (Experiment 1, F) and 20 days (Experiment 2, G) in Foxn1nu mice xenotransplated with PC-3 cells and treated on day 0, 2, and 4 (red arrows) with either saline (black line) or 0.6 mg/kg rVAR2-DT (yellow line) (*p < 0.05 and **p < 0.01). The error bars indicate ± SEM. (H) IVIS analysis of PC-3 tumor growth in mice (from G) on day 3 and 13 post-first dose treatment with saline or rVAR2-DT as indicated. (I and J) Representative hematoxylin and eosin (H&E) images as indicated of PC-3 xenograft tumor after treatment with saline (I) or rVAR2-DT (J). The scale bar represents 40 µm. (K) Representative image of PC-3 xenograft tumor stained with TUNEL reagent (in 20× and 40× magnification as indicated). The scale bar represents 10 µm (left) and 5 µm (right). (L and M) Representative H&E images as indicated of kidney (L) and liver (M) extracted from rVAR2-DT treated mice in (G). The scale bar represents 40 µm.
Figure 7
Figure 7. In Vivo Cancer Targeting Using VDC886
(A) Structure of the hemiasterlin analog KT886. (B) MS readout confirming KT886 loading on rVAR2 through a toxin-linker functionalized with a maleimide group to enable conjugation to protein-thiols. The D0 (blue) represents un-conjugated rVAR2 and D1-7 (red) designates the number of KT886 loaded. The VDC886 carries 3.5 KT886 toxins on average. (C) Indicated human cancer cell lines were seeded in 96-well plates and treated with VDC886 in concentrations ranging from 0.01 pM to 1 µM. The column graph displays IC50 kill-values of VDC886 performance. (D) Representative H&E images as indicated of kidney, spleen, prostate, bladder, and liver extracted from mice subjected to three doses of VDC886 on alternating days (15 mg/kg). The scale bar represents 10 µm. (E) Female C.B-17/IcrHsd-Prkdc scid mice engrafted with Karpas299 non-Hodgkin’s lymphoma cells on the back were treated with 1× PBS (vehicle), naked rVAR2 (rVAR2), KT886 alone (KT886), or VDC886. The treatments were administered intravenously on day 0, 2, and 5 (red arrows) as indicated. (F) Male Foxn1nu mice were implanted subcutaneously on the back with the PC3 prostate cancer cell line in 100 µl of Matrigel (in both right and left flanks). The test articles, as in (E), were administered intravenously on day 0, 2, and 5 (red arrows) as indicated. The animals remained on study until their combined tumor burden reached 1,000 mm3 in size or they otherwise required euthanasia due to distress (humane endpoint). (G) Kaplan-Meier curve of Vehicle and VDC886 treated mice from (F). There were two of the six mice on study in the VDC886 treated group that had complete re-mission of disease (***p < 0.001). (H) 4T1 murine breast cancer cells were analyzed by flow cytometry for binding to the indicated concentrations of rVAR2 or 100 nM rContr in the absence or presence of soluble CSA. (I) The indicated concentration range of VDC886 was tested on 4T1 murine mammary cancer cells in the absence or presence of soluble CSA as indicated. (J) Detection of bone metastasis detectable by IVIS (orange arrows) in C57BL/6 mice 2–3 weeks after injected with luciferase-expressing 4T1 cells from (H) and (I) in the left ventricle of the heart. (K) Extracted bone metastasis from (J) subjected to matched H&E staining and immunohistochemical pl-CS staining using rVAR2-V5 +anti-V5-HRP as indicated. The lower image displays the sections within red boxes (from upper). The scale bar represents 1 mm (upper) and 50 µm (lower). (L) Mice as in (J) with bone metastasis visible in the same IVIS detection range (n = 18) were randomized into three groups with six mice per group (n = 6) and subjected to four doses of VDC886 (15 mg/kg), rVAR2 alone (rVAR2), or KT886 alone (KT886) in equivalent molar ratios to VDC886 on day 21, 24, 27, and 30. All groups were monitored on day 15, 22, 29, 36, 45, and 54 as indicated for number of mice (n) and number of visible metastasis (M). (M) Kaplan-Meier survival plot of (L), comparing the two control groups (rVAR2 and KT886) combined with VDC886 treated mice. The mice were sacrificed when reaching their humane endpoint. The red arrows designate dosing days. The p value was calculated with Chi2 log-rank test. The error bars represent ± SEM. See also Figure S5.

References

    1. Alkhalil A, Achur RN, Valiyaveettil M, Ockenhouse CF, Gowda DC. Structural requirements for the adherence of Plasmodium falciparum-infected erythrocytes to chondroitin sulfate proteoglycans of human placenta. J. Biol. Chem. 2000;275:40357–40364. - PubMed
    1. Baruch DI, Pasloske BL, Singh HB, Bi X, Ma XC, Feldman M, Taraschi TF, Howard RJ. Cloning the P. falciparum gene encoding PfEMP1, a malarial variant antigen and adherence receptor on the surface of parasitized human erythrocytes. Cell. 1995;82:77–87. - PubMed
    1. Baston-Büst DM, Götte M, Janni W, Krüssel JS, Hess AP. Syndecan-1 knock-down in decidualized human endometrial stromal cells leads to significant changes in cytokine and angiogenic factor expression patterns. Reprod. Biol. Endocrinol. 2010;8:133. - PMC - PubMed
    1. Beeson JG, Andrews KT, Boyle M, Duffy MF, Choong EK, Byrne TJ, Chesson JM, Lawson AM, Chai W. Structural basis for binding of Plasmodium falciparum erythrocyte membrane protein 1 to chondroitin sulfate and placental tissue and the influence of protein polymorphisms on binding specificity. J. Biol. Chem. 2007;282:22426–22436. - PubMed
    1. Casucci M, Nicolis di Robilant B, Falcone L, Camisa B, Norelli M, Genovese P, Gentner B, Gullotta F, Ponzoni M, Bernardi M, et al. CD44v6-targeted T cells mediate potent antitumor effects against acute myeloid leukemia and multiple myeloma. Blood. 2013;122:3461–3472. - PubMed

Publication types

MeSH terms