. 2015 Oct 13;10(10):e0139984.
doi: 10.1371/journal.pone.0139984. eCollection 2015.

Combined Effects of Time Spent in Physical Activity, Sedentary Behaviors and Sleep on Obesity and Cardio-Metabolic Health Markers: A Novel Compositional Data Analysis Approach

Affiliations

Combined Effects of Time Spent in Physical Activity, Sedentary Behaviors and Sleep on Obesity and Cardio-Metabolic Health Markers: A Novel Compositional Data Analysis Approach

Sebastien F M Chastin et al. PLoS One. .

Abstract

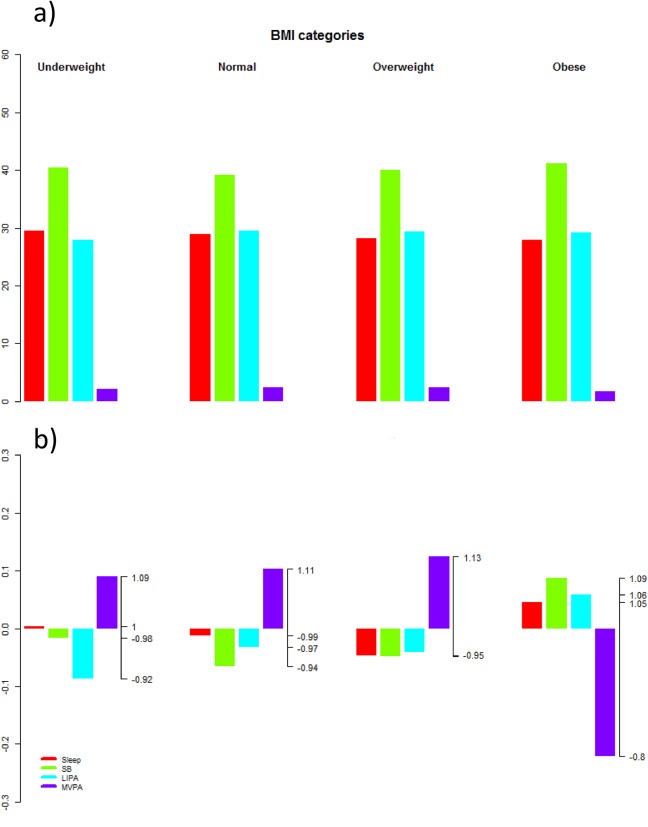
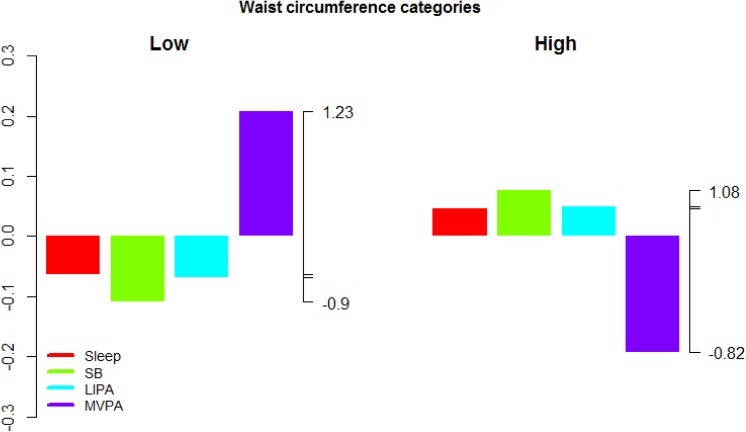
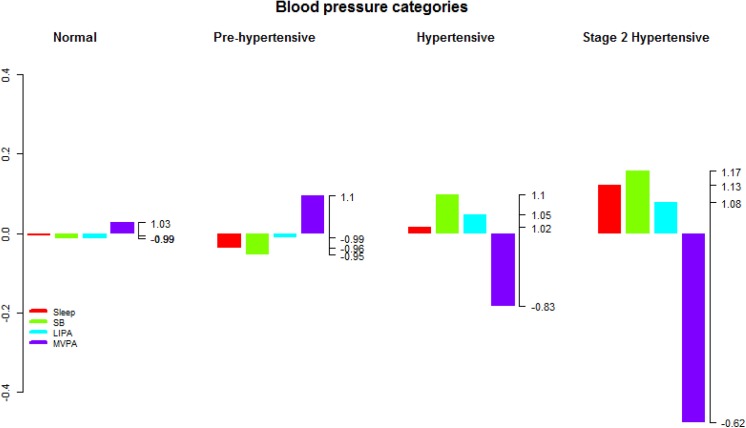
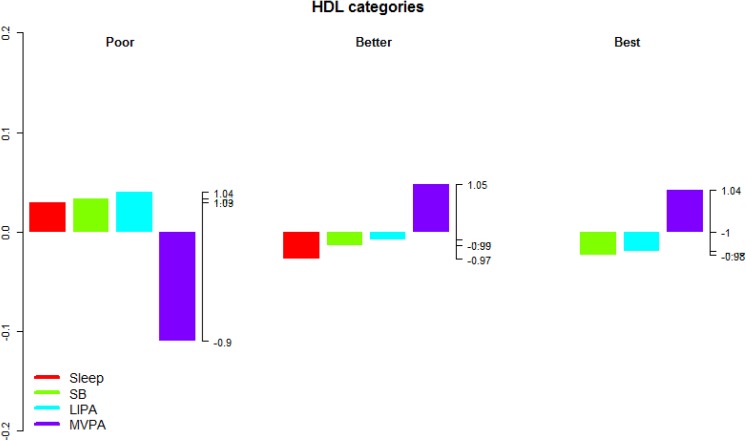
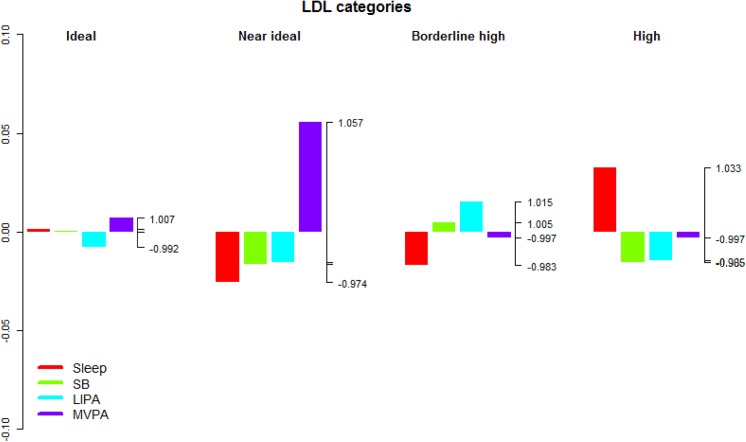
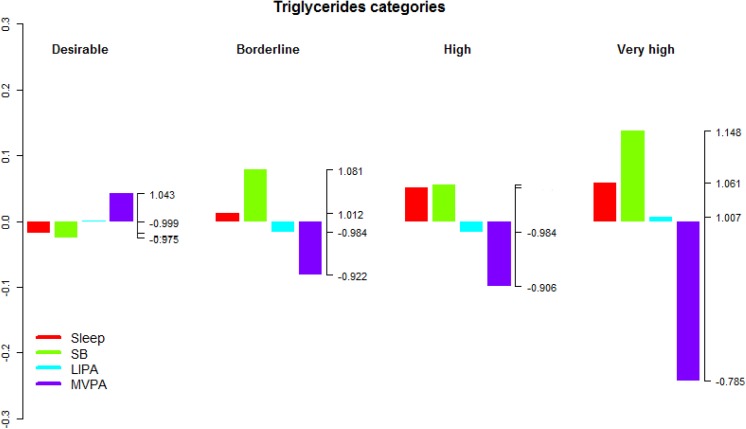
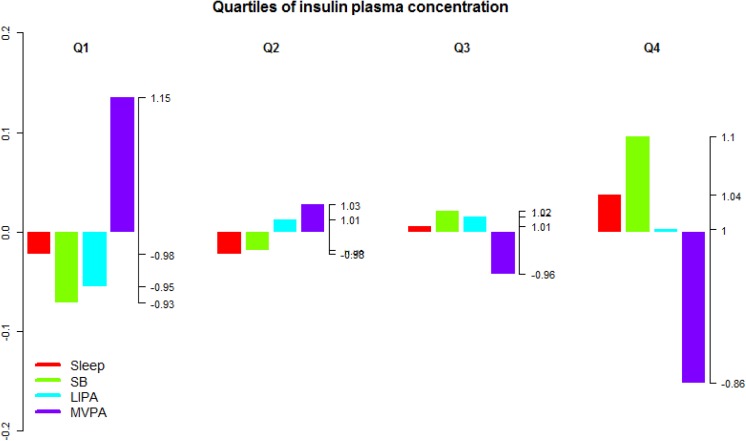
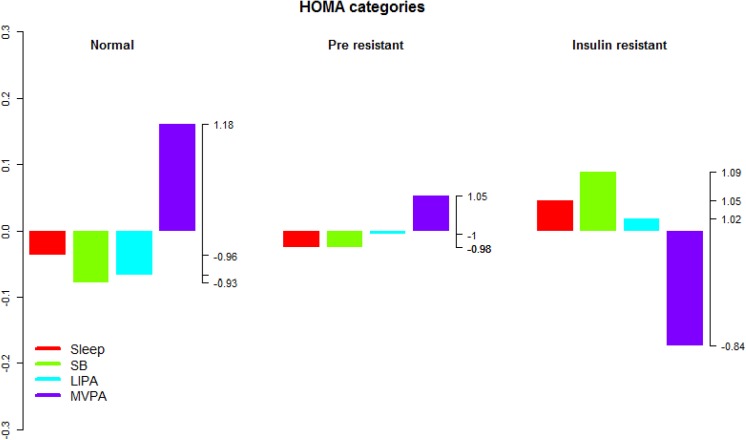
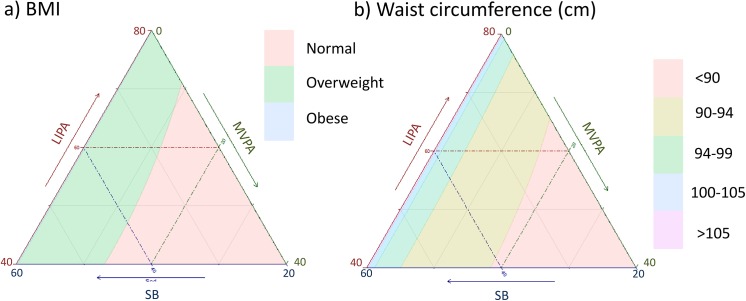
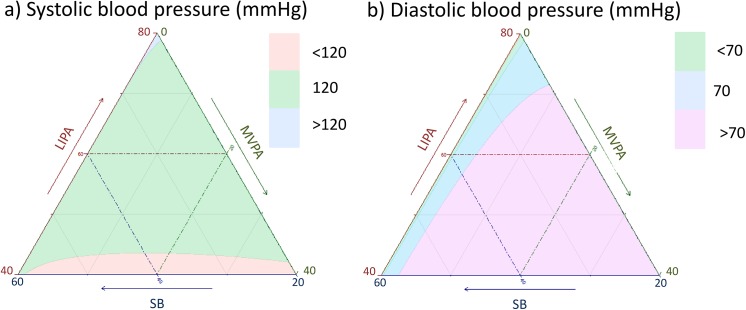
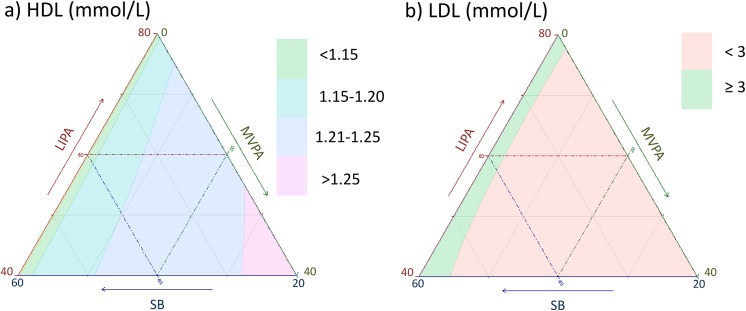
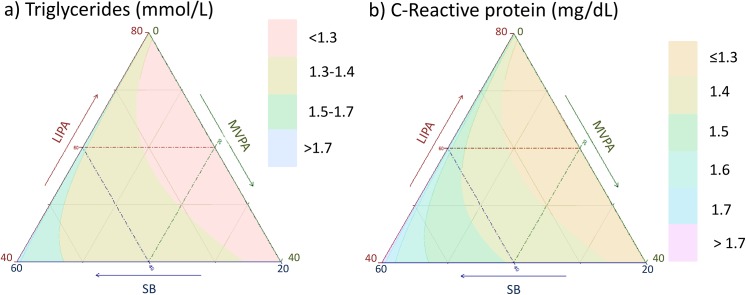
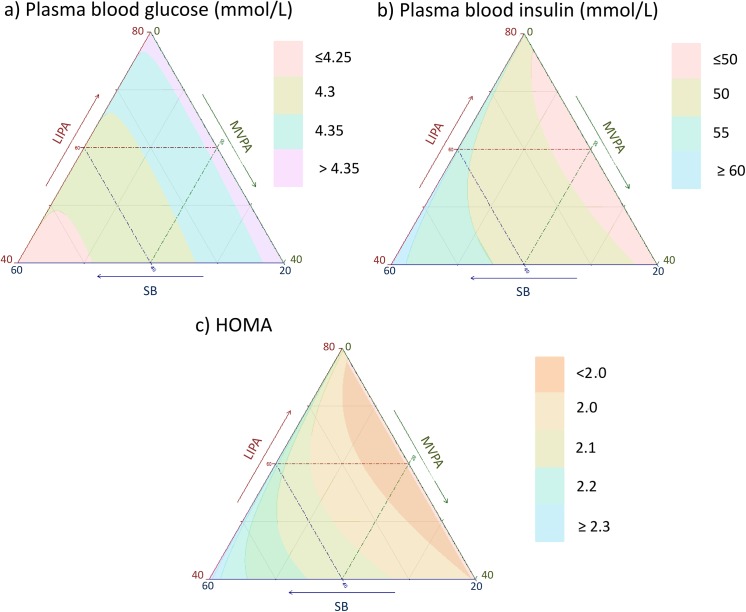
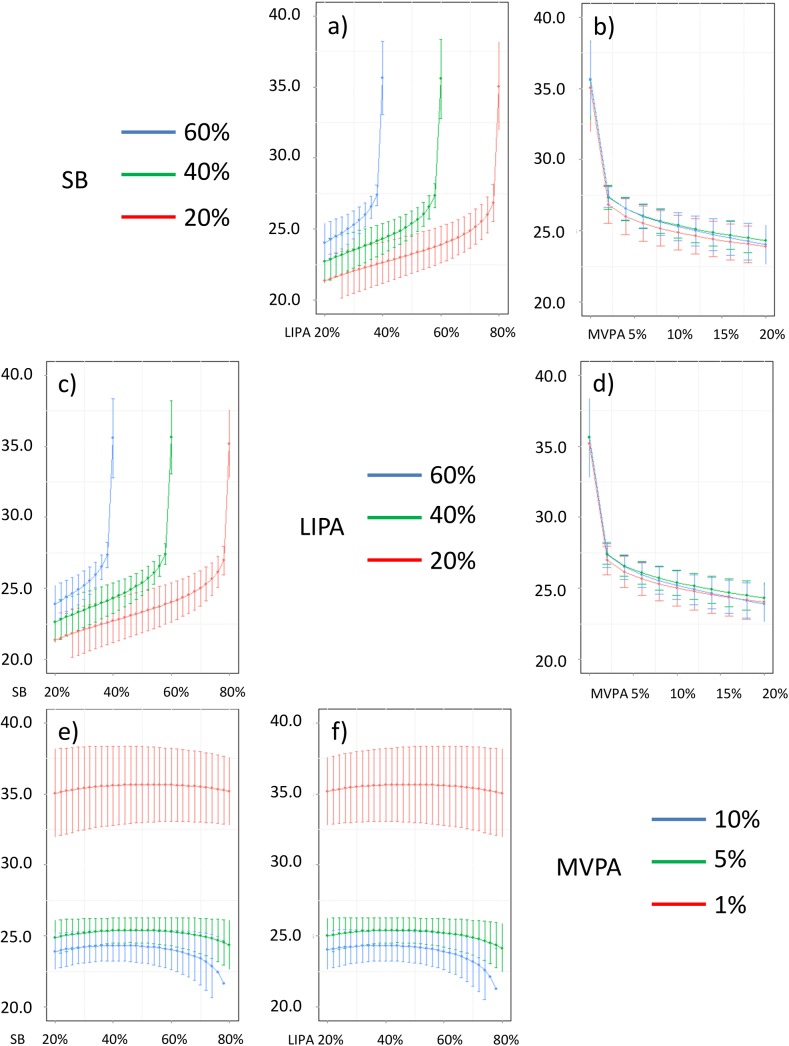
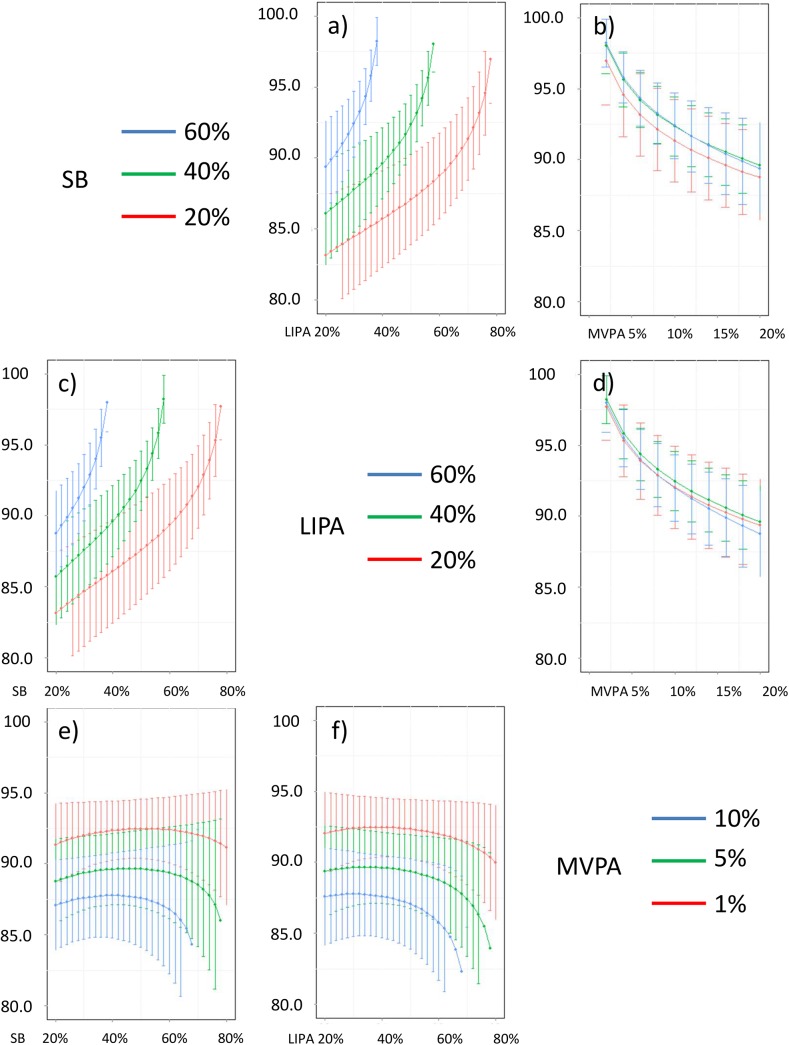
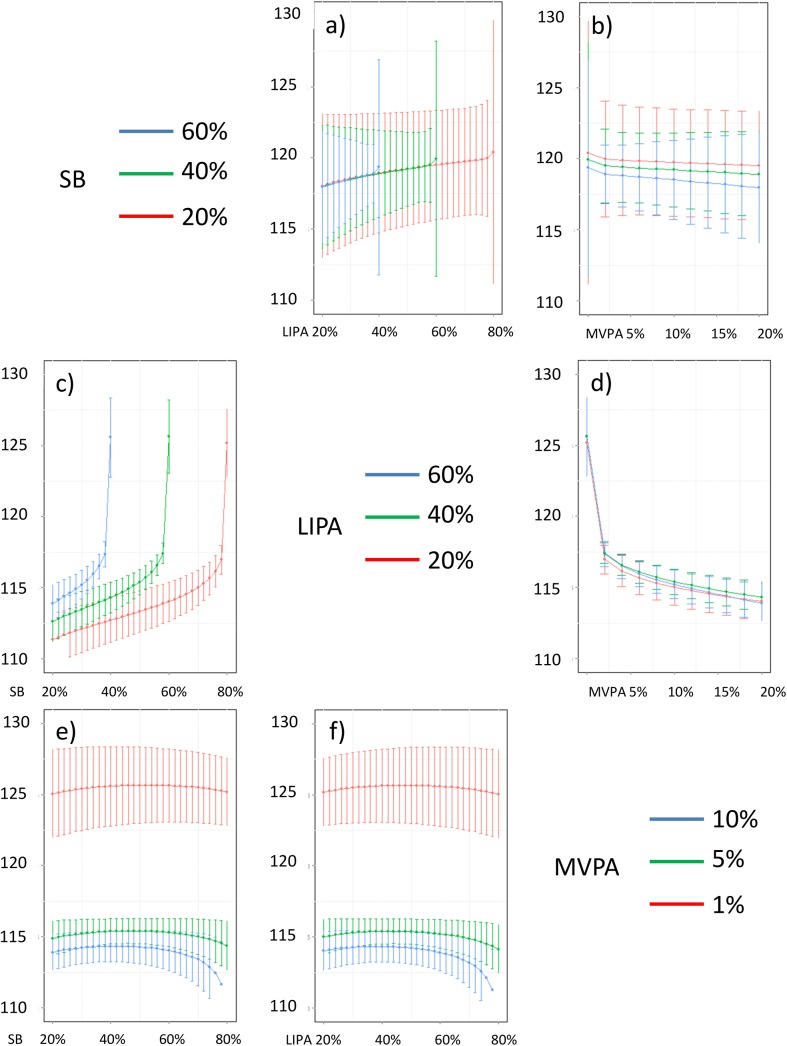
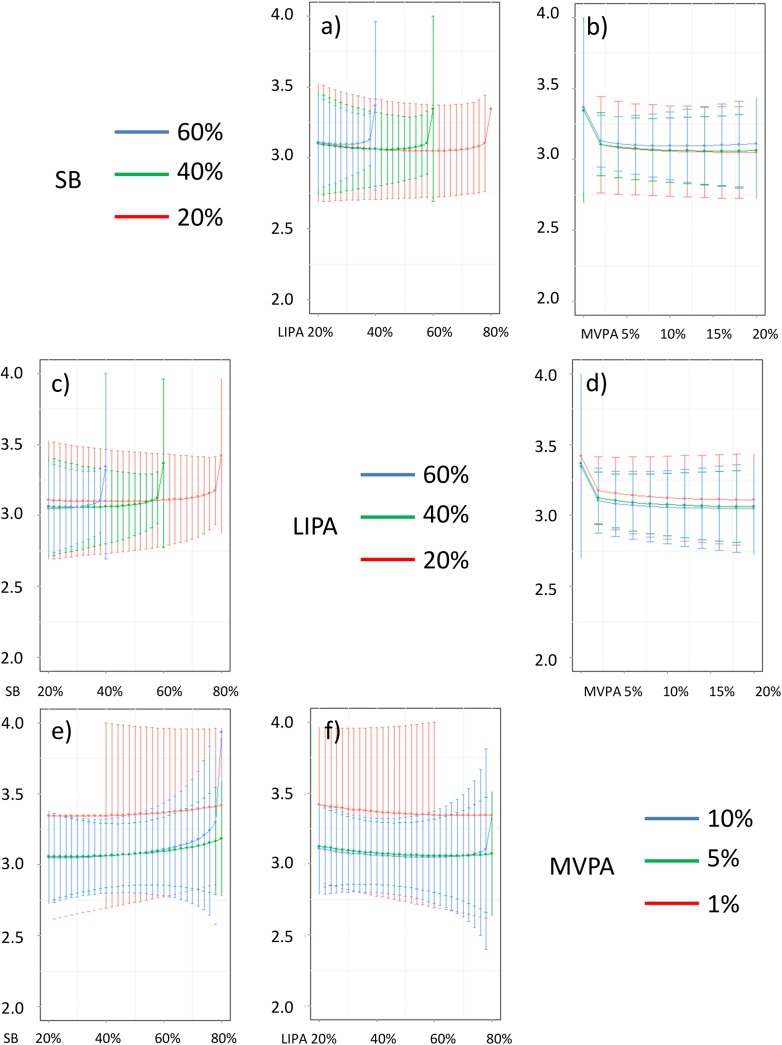
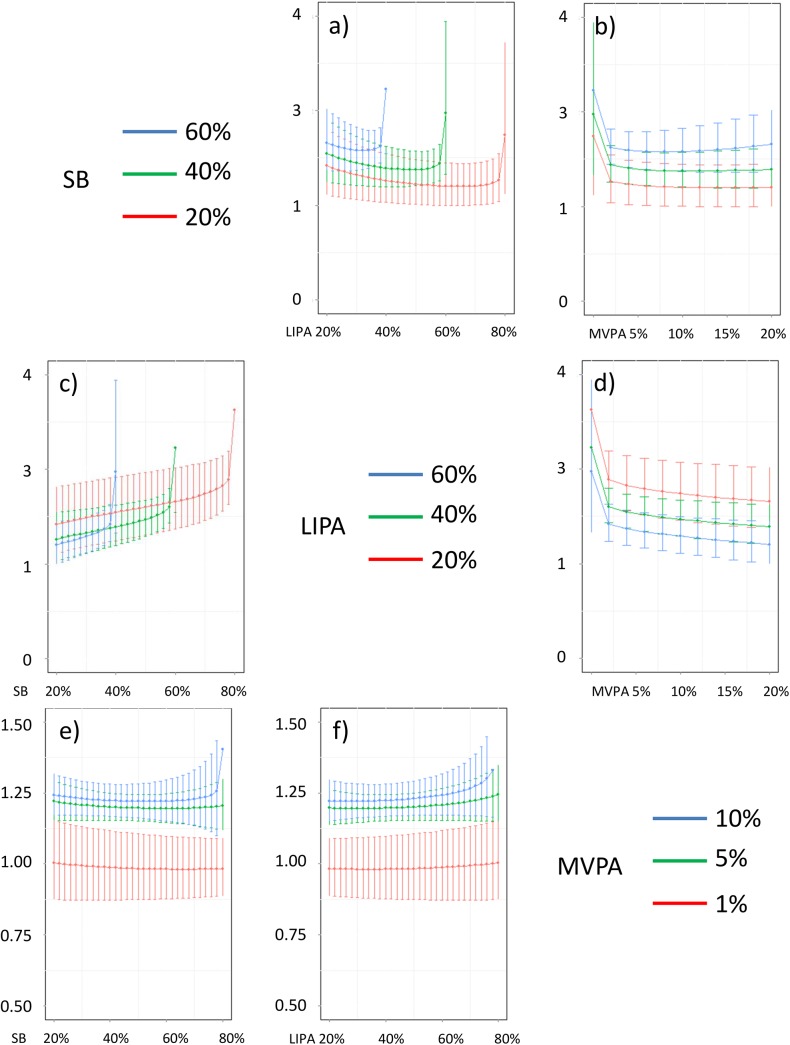
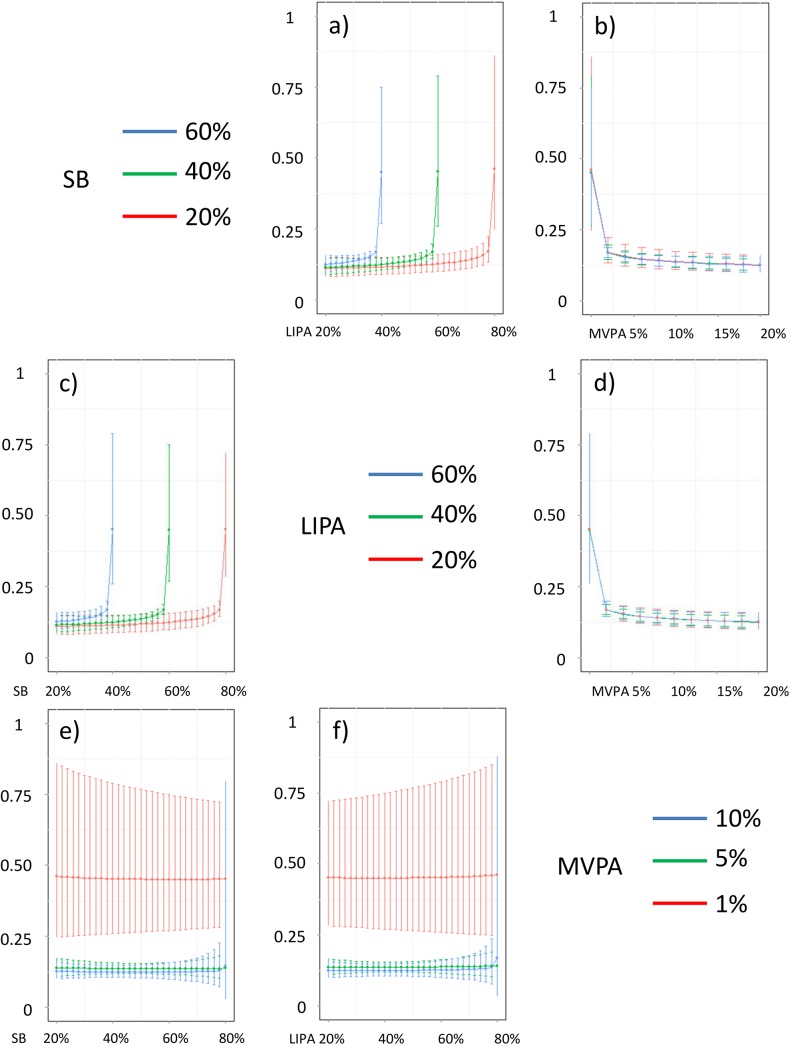
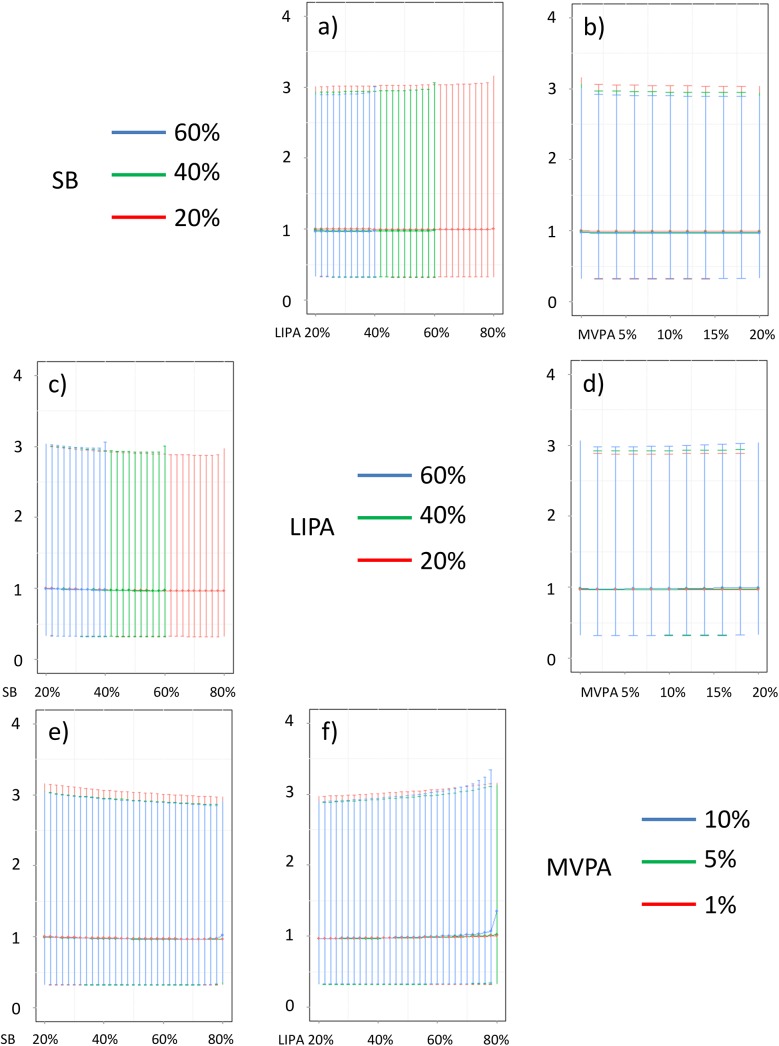
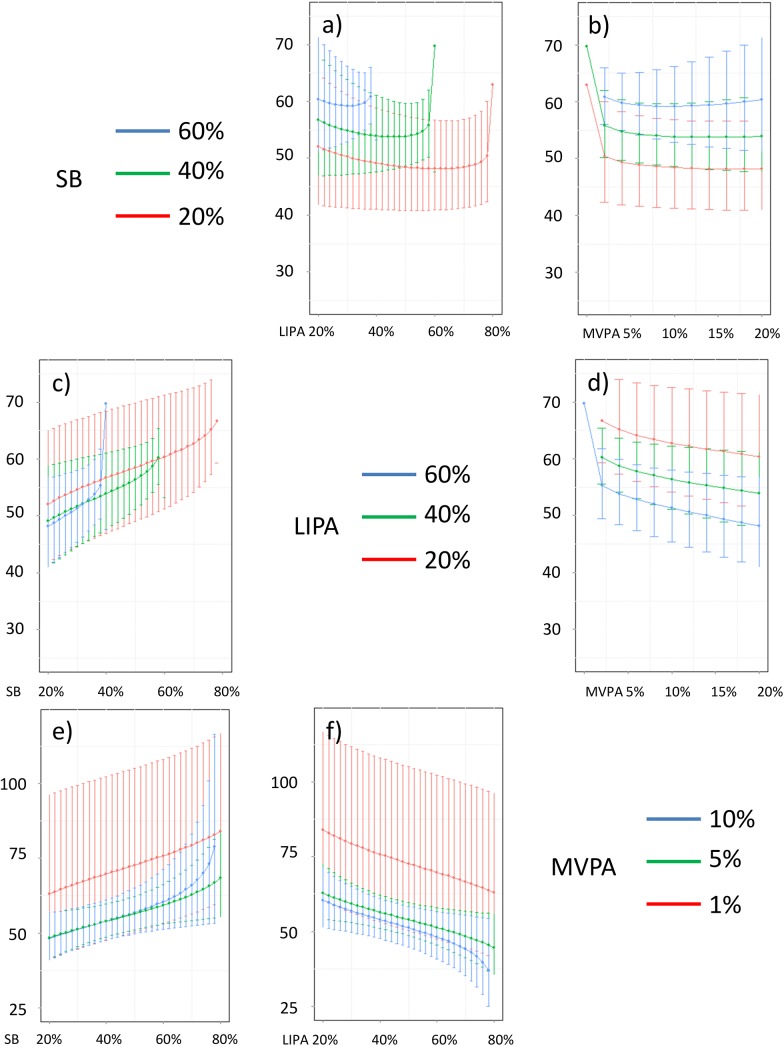
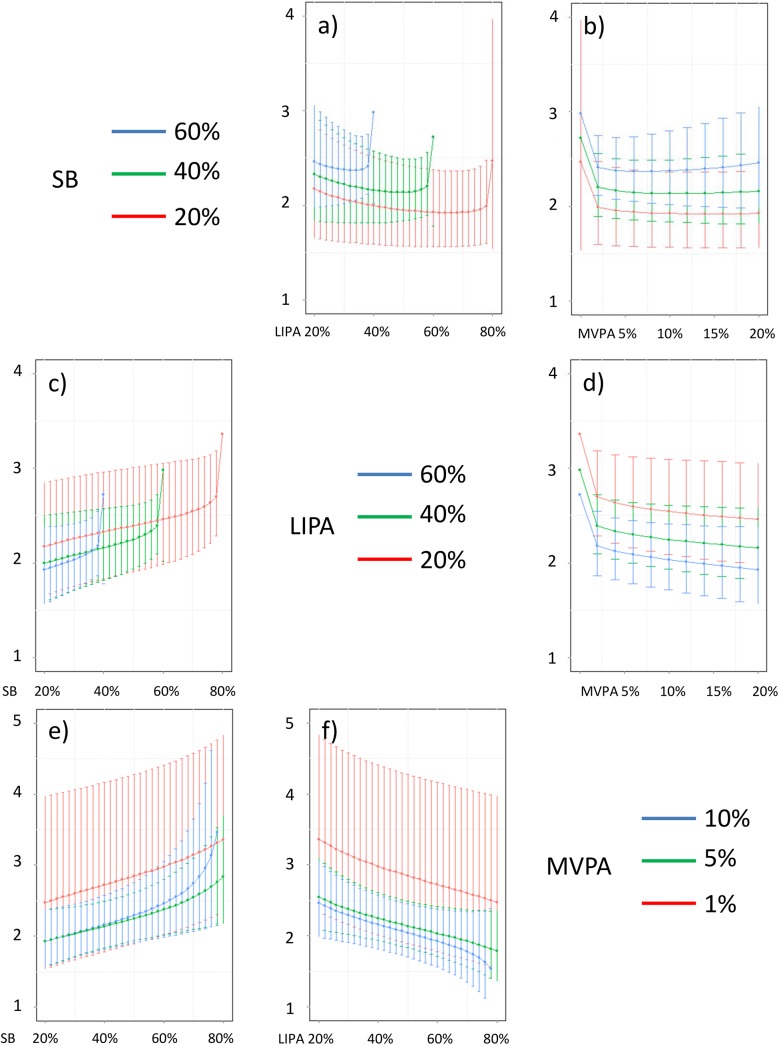
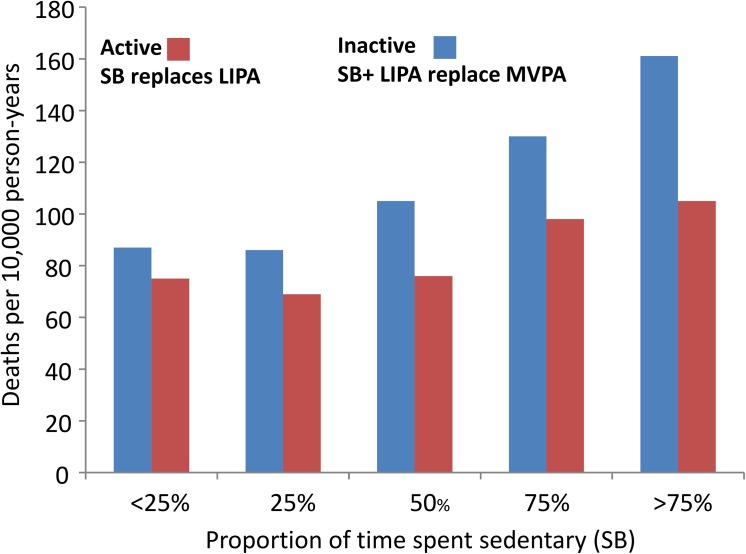
The associations between time spent in sleep, sedentary behaviors (SB) and physical activity with health are usually studied without taking into account that time is finite during the day, so time spent in each of these behaviors are codependent. Therefore, little is known about the combined effect of time spent in sleep, SB and physical activity, that together constitute a composite whole, on obesity and cardio-metabolic health markers. Cross-sectional analysis of NHANES 2005-6 cycle on N = 1937 adults, was undertaken using a compositional analysis paradigm, which accounts for this intrinsic codependence. Time spent in SB, light intensity (LIPA) and moderate to vigorous activity (MVPA) was determined from accelerometry and combined with self-reported sleep time to obtain the 24 hour time budget composition. The distribution of time spent in sleep, SB, LIPA and MVPA is significantly associated with BMI, waist circumference, triglycerides, plasma glucose, plasma insulin (all p<0.001), and systolic (p<0.001) and diastolic blood pressure (p<0.003), but not HDL or LDL. Within the composition, the strongest positive effect is found for the proportion of time spent in MVPA. Strikingly, the effects of MVPA replacing another behavior and of MVPA being displaced by another behavior are asymmetric. For example, re-allocating 10 minutes of SB to MVPA was associated with a lower waist circumference by 0.001% but if 10 minutes of MVPA is displaced by SB this was associated with a 0.84% higher waist circumference. The proportion of time spent in LIPA and SB were detrimentally associated with obesity and cardiovascular disease markers, but the association with SB was stronger. For diabetes risk markers, replacing SB with LIPA was associated with more favorable outcomes. Time spent in MVPA is an important target for intervention and preventing transfer of time from LIPA to SB might lessen the negative effects of physical inactivity.


Conflict of interest statement

Competing Interests: The authors have declared that no competing interests exist.

Figures

Fig 1
Fig 1. Ternary plots of the sample compositions of time spent in sleep, sedentary behaviors (SB), light activity (LIPA) and moderate to vigorous activity (MVPA) (black dots).
The overlapped heat map represents the distribution of the data points (the more intense the color the higher the concentration of data points). The dotted lines refer to 95% and 99% normal-based probability regions.
Fig 2
Fig 2. Composition of the day by BMI groups as a) proportion of time spent in sleep, SB, LIPA and MVPA and b) compositional analysis of the relative importance of the group mean time spent in sleep, SB, LIPA and MVPA with respect to the overall mean time composition. In b) the left axis gives the log-ratio value and the right axis displays the actual proportion relative to the mean composition (e.g. 1.25 means 1.25 times the compositional mean or a proportion higher by 25%).
Fig 3
Fig 3. Compositional analysis of the relative importance of the group mean time spent in sleep, SB, LIPA and MVPA with respect to the overall mean time composition by group of waist circumference.
The left axis gives the log-ratio value and the right axis displays the actual proportion relative to the mean composition (e.g. 1.25 means 1.25 times the compositional mean or a proportion higher by 25%). Grouping by waist circumference was carried out by gender according to the following thresholds; 102 cm for men and 88 cm for women.
Fig 4
Fig 4. Compositional analysis of the relative importance of the group mean time spent in sleep, SB, LIPA and MVPA with respect to the overall mean time composition by group of blood pressure.
The left axis gives the log-ratio value and the right axis displays the actual proportion relative to the mean composition (e.g. 1.25 means 1.25 times the compositional mean or a proportion higher by 25%). Grouping by blood pressure was according to the National Institute of Health categories.
Fig 5
Fig 5. Compositional analysis of the relative importance of the group mean time spent in sleep, SB, LIPA and MVPA with respect to the overall mean time composition by group of blood HDL concentration.
The left axis gives the log-ratio value and the right axis displays the actual proportion relative to the mean composition (e.g. 1.25 means 1.25 times the compositional mean or a proportion higher by 25%). Grouping by blood HDL concentration was according to the American Heart Association guidelines for treatment of cholesterol [58].
Fig 6
Fig 6. Compositional analysis of the relative importance of the group mean time spent in sleep, SB, LIPA and MVPA with respect to the overall mean time composition by group of blood LDL concentration.
The left axis gives the log-ratio value and the right axis displays the actual proportion relative to the mean composition (e.g. 1.25 means 1.25 times the compositional mean or a proportion higher by 25%). Grouping by blood LDL concentration was according to the American Heart Association guidelines for treatment of cholesterol [58].
Fig 7
Fig 7. Compositional analysis of the relative importance of the group mean time spent in sleep, SB, LIPA and MVPA with respect to the overall mean time composition by group of blood triglycerids concentration.
The left axis gives the log-ratio value and the right axis displays the actual proportion relative to the mean composition (e.g. 1.25 means 1.25 times the compositional mean or a proportion higher by 25%). Grouping by blood triglycerids concentration was according to the American Heart Association guidelines for treatment of cholesterol [58].
Fig 8
Fig 8. Compositional analysis of the relative importance of the group mean time spent in sleep, SB, LIPA and MVPA with respect to the overall mean time composition by group of plasma blood glucose concentration.
The left axis gives the log.ratio value and the right axis displays the actual proportion relative to the mean composition (e.g. 1.25 means 1.25 times the compositional mean or a proportion higher by 25%). Grouping by plasma blood glucose concentration was according to the American Diabetes Association guidelines.
Fig 9
Fig 9. Compositional analysis of the relative importance of the group mean time spent in sleep, SB, LIPA and MVPA with respect to the overall mean time composition by group of plasma blood insulin concentration.
The left axis gives the log-ratio value and the right axis displays the actual proportion relative to the mean composition (e.g. 1.25 means 1.25 times the compositional mean or a proportion higher by 25%). Grouping by plasma blood insulin concentration was based on quartiles.
Fig 10
Fig 10. Compositional analysis of the relative importance of the group mean time spent in sleep, SB, LIPA and MVPA with respect to the overall mean time composition by group of HOMA.
The left axis gives the log-ratio value and the right axis displays the actual proportion relative to the mean composition (e.g. 1.25 means 1.25 times the compositional mean or a proportion higher by 25%). Grouping by HOMA categories.
Fig 11
Fig 11. Estimated a) BMI and b) waist circumference as a function of composition of the waking day (16 hours) in proportion of time spent in sedentary behaviors (SB), Light (LIPA) and moderate to vigorous activity (MVPA) and 8 hours spent sleeping.
Fig 12
Fig 12. Estimated a) systolic and b) diastolic blood pressure as a function of composition of the waking day (16 hours) in proportion of time spent in sedentary behaviors (SB), Light (LIPA) and moderate to vigorous activity (MVPA) and 8 hours spent sleeping.
Fig 13
Fig 13. Estimated blood a) HDL and b) LDL cholesterol as a function of composition of the waking day (16 hours) in proportion of time spent in sedentary behaviors (SB), Light (LIPA) and moderate to vigorous activity (MVPA) and 8 hours spent sleeping.
Fig 14
Fig 14. Estimated blood a) Triglycerides and b) C-reactive proteins as a function of composition of the waking day (16 hours) in proportion of time spent in sedentary behaviors (SB), Light (LIPA) and moderate to vigorous activity (MVPA) and 8 hours spent sleeping.
Fig 15
Fig 15. Estimated fasting plasma blood a) glucose and b) insulin and c) HOMA as a function of composition of the waking day (16 hours) in proportion of time spent in sedentary behaviors (SB), Light (LIPA) and moderate to vigorous activity (MVPA) and 8 hours spent sleeping.
Fig 16
Fig 16. Estimated BMI (in kg/m2) for different composition as a function the proportion of a) LIPA and b) MVPA when SB is held constant, c) SB and d) MVPA when LIPA is held constant, e) SB and f)LIPA when MVPA is held constant.
The plots correspond to slices of Fig 11A.
Fig 17
Fig 17. Estimated waist circumference (in cm) for different composition as a function the proportion of a) LIPA and b) MVPA when SB is held constant, c) SB and d) MVPA when LIPA is held constant, e) SB and f) LIPA when MVPA is held constant.
The plots correspond to slices of Fig 11B.
Fig 18
Fig 18. Estimated systolic blood pressure (in mmHg) for different composition as a function the proportion of a) LIPA and b) MVPA when SB is held constant, c) SB and d) MVPA when LIPA is held constant, e) SB and f) LIPA when MVPA is held constant.
The plots correspond to slices of Fig 12A.
Fig 19
Fig 19. Estimated diastolic blood pressure (in mmHg) for different composition as a function the proportion of a) LIPA and b) MVPA when SB is held constant, c) SB and d) MVPA when LIPA is held constant, e) SB and f) LIPA when MVPA is held constant.
The plots correspond to slices of Fig 12B.
Fig 20
Fig 20. Estimated HDL (in mmol/L) for different composition as a function the proportion of a) LIPA and b) MVPA when SB is held constant, c) SB and d) MVPA when LIPA is held constant, e) SB and f) LIPA when MVPA is held constant.
The plots correspond to slices of Fig 13A.
Fig 21
Fig 21. Estimated LDL (in mmol/L) for different composition as a function the proportion of a) LIPA and b) MVPA when SB is held constant, c) SB and d) MVPA when LIPA is held constant, e) SB and f) LIPA when MVPA is held constant.
The plots correspond to slices of Fig 13B.
Fig 22
Fig 22. Estimated triglycerides (in mmol/L) for different composition as a function the proportion of a) LIPA and b) MVPA when SB is held constant, c) SB and d) MVPA when LIPA is held constant, e) SB and f) LIPA when MVPA is held constant.
The plots correspond to slices of Fig 14A.
Fig 23
Fig 23. Estimated CRP (in mg/dL) for different composition as a function the proportion of a) LIPA and b) MVPA when SB is held constant, c) SB and d) MVPA when LIPA is held constant, e) SB and f) LIPA when MVPA is held constant.
The plots correspond to slices of Fig 14B.
Fig 24
Fig 24. Estimated plasma glucose (in mmol/L) for different composition as a function the proportion of a) LIPA and b) MVPA when SB is held constant, c) SB and d) MVPA when LIPA is held constant, e) SB and f) LIPA when MVPA is held constant.
The plots correspond to slices of Fig 15A.
Fig 25
Fig 25. Estimated plasma insulin (in pmol/L) for different composition as a function the proportion of a) LIPA and b) MVPA when SB is held constant, c) SB and d) MVPA when LIPA is held constant, e) SB and f) LIPA when MVPA is held constant.
The plots correspond to slices of Fig 15B.
Fig 26
Fig 26. Estimated HOMA for different composition as a function the proportion of a) LIPA and b) MVPA when SB is held constant, c) SB and d) MVPA when LIPA is held constant, e) SB and f) LIPA when MVPA is held constant.
The plots correspond to slices of Fig 15C.
Fig 27
Fig 27. Mortality rate as function of proportion of time spent sedentary for active people and inactive people.
Adapted from Katzmarzyk et al., 2009. MSSE. 41(5): 998–1005. The red bars show the effect of sedentary behaviors (SB) replacing light activity (LIPA) at equal proportion of time spent in moderate to vigorous activity (MVPA). The blue bars show the effect when SB + LIPA displace MVPA.

Similar articles

Cited by

References

    1. Bansil P, Kuklina E V, Merritt RK, Yoon PW. Associations between sleep disorders, sleep duration, quality of sleep, and hypertension: results from the National Health and Nutrition Examination Survey, 2005 to 2008. J Clin Hypertens. 2011; 13: 739–743. 10.1111/j.1751-7176.2011.00500.x - DOI - PMC - PubMed
    1. Department of Health. Start active, stay active: a report on physical activity from the four home countries’ Chief Medical Officers. 2011.
    1. Haskell WL, Lee I-M, Pate RR, Powell KE, Blair SN, Franklin BA, et al. Physical activity and public health: updated recommendation for adults from the American College of Sports Medicine and the American Heart Association. Med Sci Sports Exerc. 2007; 39: 1423–1434. - PubMed
    1. Kotz CM, Levine JA. Role of nonexercise activity thermogenesis (NEAT) in obesity. Minn Med. 2005; 88: 54–57. - PubMed
    1. Owen N, Bauman A, Brown W. Too much sitting: a novel and important predictor of chronic disease risk? Br J Sports Med. 2009; 43: 81–83. 10.1136/bjsm.2008.055269 - DOI - PubMed

Publication types

MeSH terms