. 2015 Oct 13:5:15034.
doi: 10.1038/srep15034.

The first two cell-fate decisions of preimplantation mouse embryo development are not functionally independent

Affiliations

The first two cell-fate decisions of preimplantation mouse embryo development are not functionally independent

Aleksandar I Mihajlović et al. Sci Rep. .

Abstract

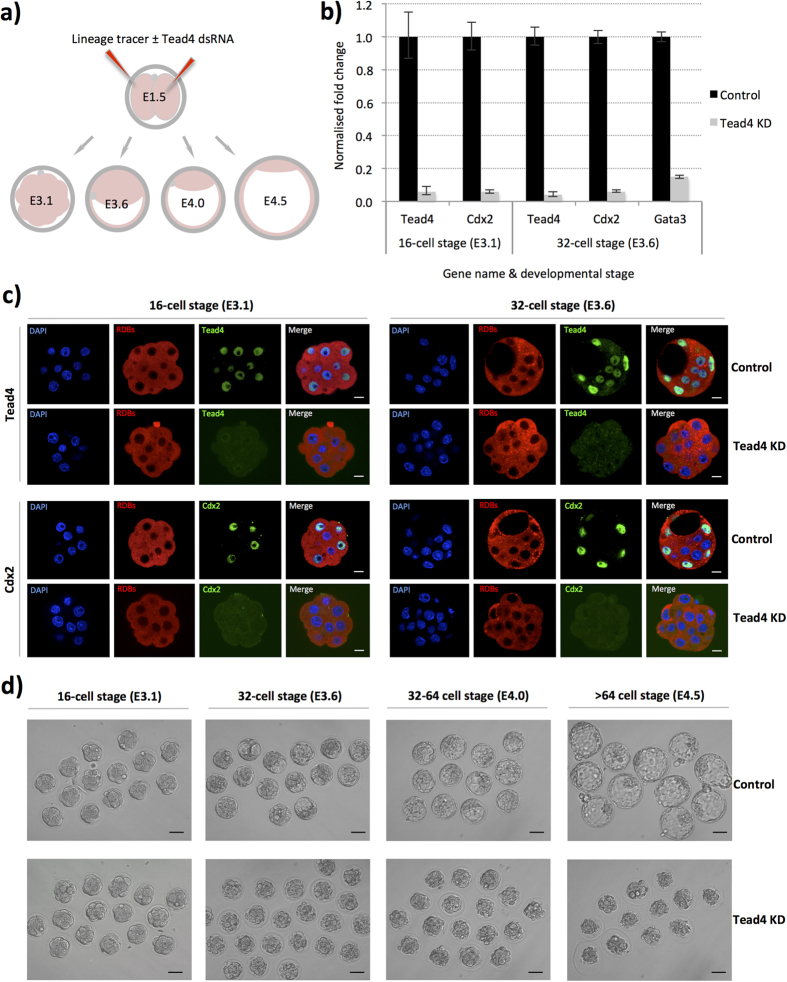
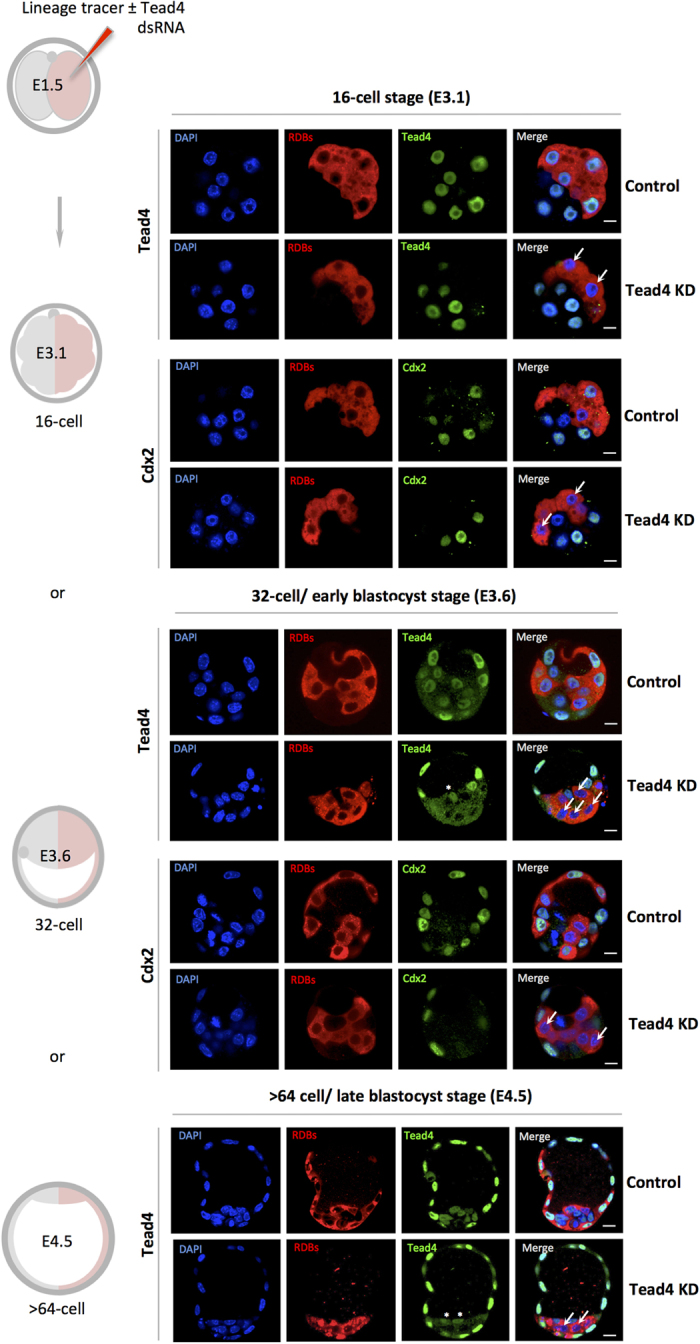
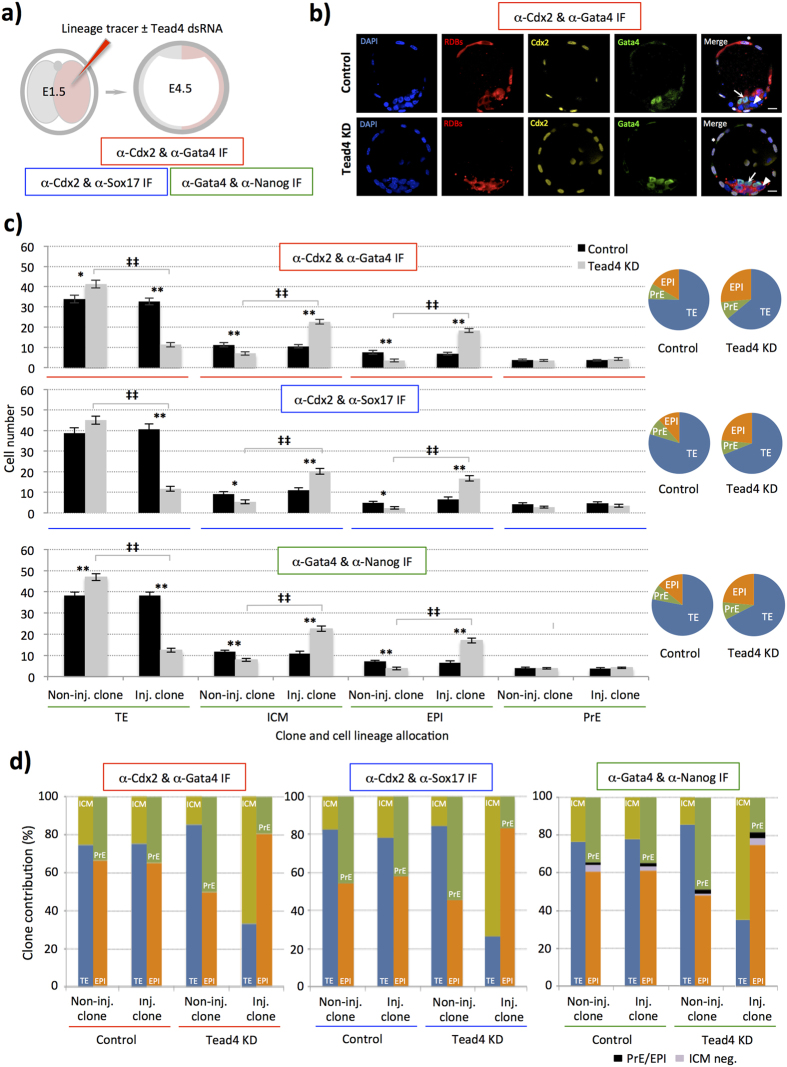
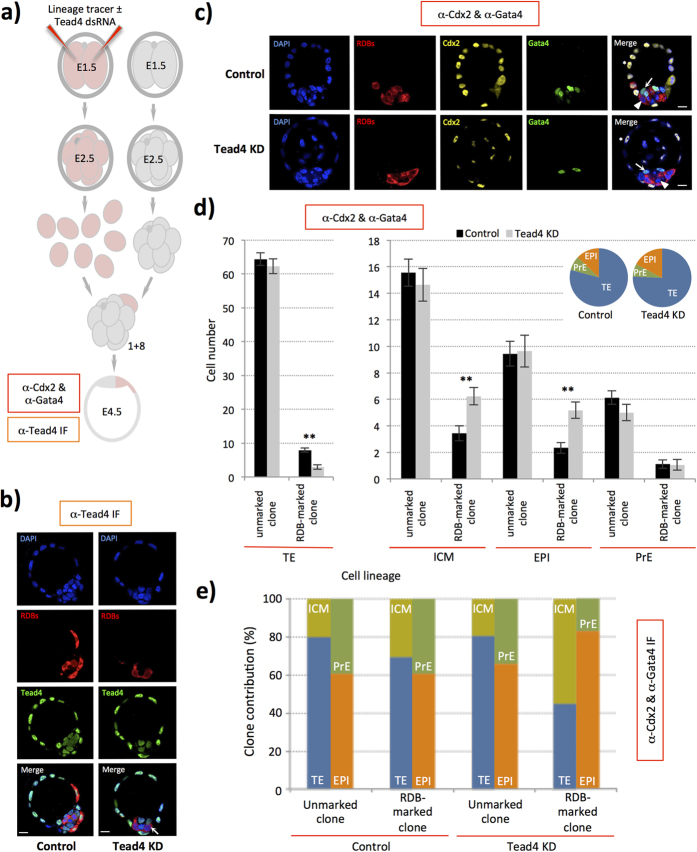
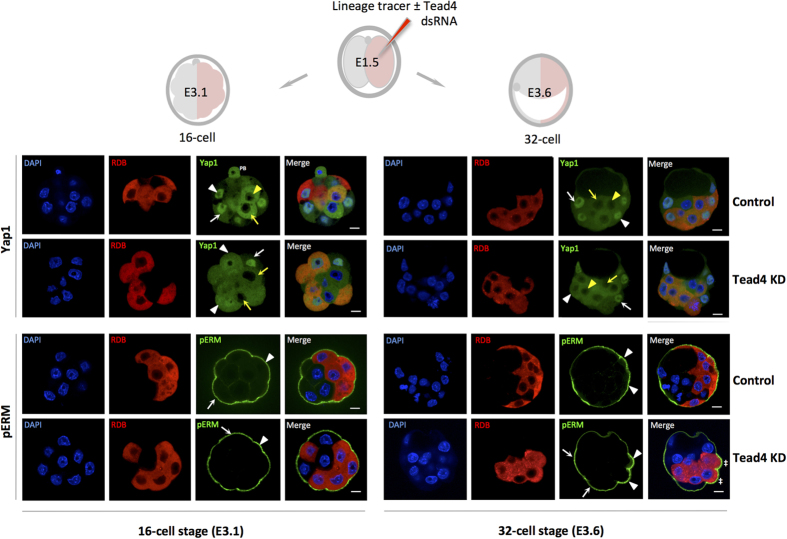
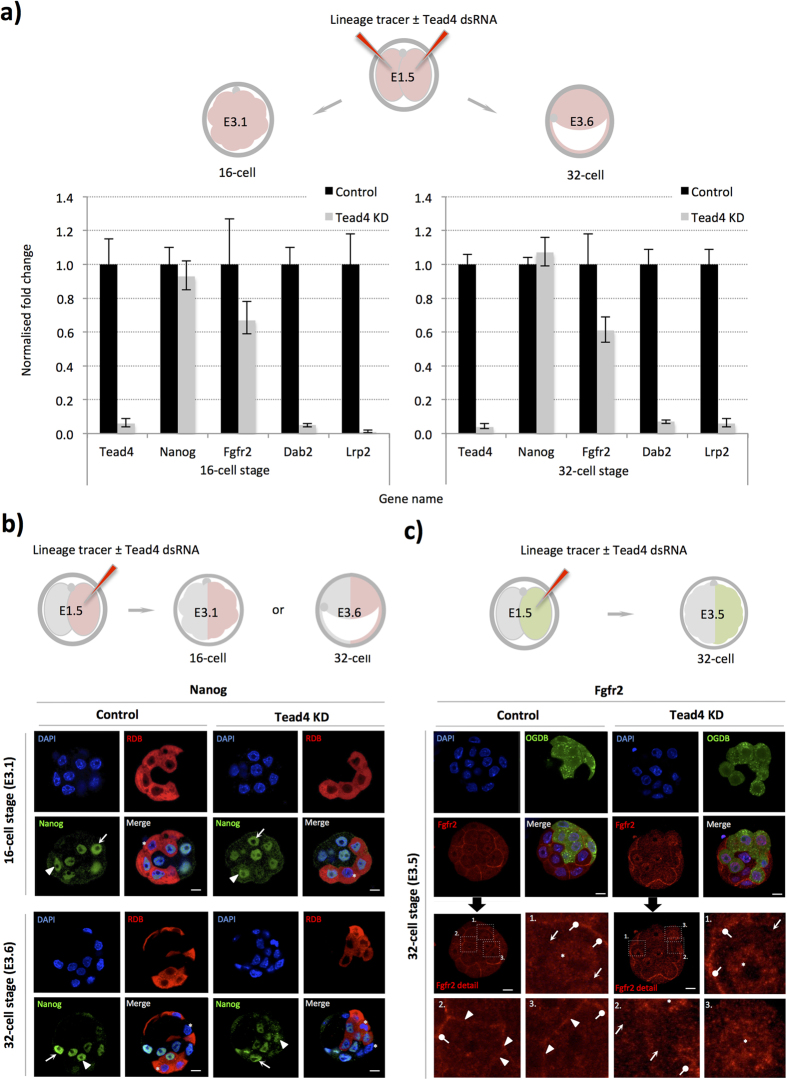
During mouse preimplantation embryo development, three distinct cell lineages are formed, represented by the differentiating trophectoderm (TE), primitive endoderm (PrE) and the pluripotent epiblast (EPI). Classically, lineage derivation has been presented as a two-step process whereby outer TE cells are first segregated from inner-cell mass (ICM), followed by ICM refinement into either the PrE or EPI. As ICM founders can be produced following the fourth or fifth cleavage divisions, their potential to equally contribute to EPI and PrE is contested. Thus, modelling the early sequestration of ICM founders from TE-differentiation after the fourth cleavage division, we examined ICM lineage contribution of varying sized cell clones unable to initiate TE-differentiation. Such TE-inhibited ICM cells do not equally contribute to EPI and PrE and are significantly biased to form EPI. This bias is not caused by enhanced expression of the EPI marker Nanog, nor correlated with reduced apical polarity but associated with reduced expression of PrE-related gene transcripts (Dab2 and Lrp2) and down-regulation of plasma membrane associated Fgfr2. Our results favour a unifying model were the three cell lineages are guided in an integrated, yet flexible, fate decision centred on relative exposure of founder cells to TE-differentiative cues.


Figures

Figure 1
Figure 1. Long dsRNA mediated Tead4 down-regulation phenocopies the zygotic Tead4−/− null TE-deficit phenotype.
(a) Schematic representation of experimental strategy. Embryos were microinjected with RDB injection marker (red) ± Tead4-dsRNA in both cells at the 2-cell stage (E1.5) and in vitro cultured until the mid-16-cell (E3.1), 32-cell (E3.6), 32–64-cell (E4.0) or >64-cell (E4.5) stages, prior to Q-RTPCR/microscopic analyses. (b) Q-RTPCR data detailing normalised average fold changes in mRNA expression of Tead4, Cdx2 and Gata3 in embryos microinjected with Tead4-dsRNA, relative to microinjection control embryos. Individual gene mRNA levels were normalised against Rpl23 and/or H2afz within control and experimental knockdown conditions and the fold change associated with Tead4 KD calculated. Errors are given as s.e.m. n = at least 2 for biological replicates and 3 for technical replicates. (c) Representative single confocal immuno-fluorescence microscopy sections of embryos microinjected with RDB injection marker ± Tead4-dsRNA immuno-stained for Tead4 or Cdx2 protein (green) and DNA co-stained with DAPI (blue). RDB microinjection marker is visible (red). Scale bars = 10 μm. (d) Bright-field micrographs of control and Tead4-dsRNA microinjected embryos at various preimplantation stage developmental time-points in in vitro culture. Note that the Tead4-KD embryos fail to initiate blastocoel formation and starting from the E4.0 time-point exhibit cell death; a phenotype consistent with that observed in zygotic genetic Tead4−/− null preimplantation embryos. Scale bars = 50 μm.
Figure 2
Figure 2. Clonal down-regulation of Tead4 expression and TE-differentiation inhibition.
A schematic of experimental strategy to effect clonal Tead4 knockdown (KD) and TE-inhibition in one-half of the embryo using microinjected RDBs ± Tead4-dsRNA (see materials and methods) is given on the left. Representative single z-plane confocal micrographs of control and Tead4-KD embryos at either the mid-16-cell (E3.1), 32-cell (E3.6) or >64-cell (E4.5) stages immuno-stained for Tead4 or Cdx2 (green) are given. Cells derived from the microinjected 2-cell stage clone are distinguishable by the co-injected RDB fluorescence (red). DNA counter-stain (blue) is also shown. In merged images the arrows denote cells exhibiting a lack of Tead4 or Cdx2 expression in the Tead4-KD microinjected cell clone, thus confirming the efficacy and the functional and clonal inhibition of TE-differentiation by Tead4-dsRNA until the late blastocyst stage (E4.5). ICM cells not from the microinjected clone, expressing Tead4 protein are marked with asterisks (in Tead4 alone micrographs). Note, in contrast to global Tead4-KD embryos (Fig. 1), such clonal Tead4-KD embryos initiate blastocoel formation in a manner indistinguishable from control microinjected embryos. Scale bars = 10 μm.
Figure 3
Figure 3. Clonal inhibition of TE-differentiation preferentially biases cells to EPI rather than PrE fates.
(a) Experimental strategy to effect clonal Tead4-KD and TE-inhibition in one-half of the embryo and assess cell lineage allocation in late blastocysts (E4.5) via immuno-fluorescence detection of marker gene expression, using; i) Cdx2 (TE) & Gata4 (late PrE) - red, ii) Cdx2 & Sox17 (early PrE)—blue, and iii) Gata4 & Nanog (EPI)—green, (n.b. inner-cells devoid of either lineage marker in i) and ii) were classified as EPI and outer cells devoid of immuno-reactivity in iii) were designated as TE). (b) Representative single z-plane confocal micrographs of microinjection control and clonal Tead4-KD late blastocyst (E4.5) embryos immuno-stained for Cdx2 (pseudo-coloured yellow) and Gata4 (green) protein expression. Progeny of the microinjected cell are distinguishable by co-injected RDB fluorescence (red). DNA is counterstained with DAPI (blue). Merged image asterisks represent exemplar cells classified in our analyses as TE, arrows as PrE cells and arrow-heads as EPI. Note similar exemplar micrographs for the alternative immuno-staining regimes are given in Supplementary Figs S3 and S4. Scale bars = 10 μm. (c) Average number of cells from either non-microinjected or microinjected cell clones contributing to late blastocyst (E4.5) lineages, in control and clonal Tead4-KD embryos, immuno-stained in each of the three regimes outlined in a). Error bars represent s.e.m; */** and ‡/‡‡ denote statistically significant differences between equivalent cell clones of control and clonal Tead4-KD embryos, or between cell clones within control and clonal Tead4-KD embryo groups, respectively (p < 0.05 and p < 0.005, 2-tailed student t-tests). The relative average percentage contribution of total cell number to each late blastocyst lineage in both control- and Tead4-KD embryos is also provided as a pie-chart. (d) Averaged percentage contribution of non-microinjected and microinjected cell clones, of control and clonal Tead4-KD embryos, immuno-stained according to the three regimes outlined in a), between the TE (blue) & ICM (yellow) and the PrE (green) & EPI (orange) of analysed late (E4.5) blastocysts. In the anti-Gata4/Nanog immuno-stained embryo groups, the contribution of ICM cells either positive or negative for both PrE and EPI marker gene expression are shown in black and violet, respectively. Overall, for control embryos n = 24, 13 & 25 and for clonal Tead4-KD embryos n = 24, 9 & 23 in each of the three immuno-staining regimes outlined in a), respectively. Note, further analysis and variant presentation of the above data is provided in Supplementary Figs S2–S4 and Supplementary Tables ST3–ST8.
Figure 4
Figure 4. TE-inhibition within small chimeric ICM clones also biases against ultimate PrE cell-fate.
(a) Experimental strategy to generate embryo chimeras containing marked TE-inhibited cells equivalent to one ninth of the embryo and to asses late blastocyst (E4.5) lineage formation, via immuno-fluorescent staining for Cdx2 and Gata4 (n.b. inner-cells devoid of either lineage marker were classified as EPI and immuno-staining using anti-Tead4 antibody was also used to confirm Tead4 KD in the marked chimeric clones). (b) Representative single z-plane confocal micrographs of control and Tead4-KD clone containing chimeras immuno-stained for Tead4 (green) expression. In the merged image, arrows denote cells not expressing detectable levels of Tead4 derived from original Tead4-KD donor blastomere (c) Further, representative single z-plane confocal micrographs of late blastocyst (E4.5) chimeras immuno-stained for Cdx2 (pseudo-coloured yellow) and Gata4 (green). Merged image asterisks represent exemplar cells classified in our analyses as belonging to the TE, arrows PrE and arrow-heads EPI. In (b,c) cells deriving from donor blastomeres, themselves originally derived from control or Tead4-dsRNA microinjected 2-cell (E1.5) stage embryos, within chimeras are distinguishable by co-injected RDB (red). DNA is counterstained (DAPI, blue). Scale bars = 10 μm. (d) Average number of cells from either RDB-marked or non-marked cell clones in TE lineage (left) and ICM, EPI and PrE lineages (right), in control and Tead4-KD-chimeras; error bars represent s.e.m and */** denote statistically significant differences between equivalent cell clones of control- and Tead4-KD-chimeras (p < 0.05 and p < 0.005, respectively - 2-tailed student t-tests). Inset pie-charts denote the relative average contribution of cells within each embryo group to each of the three late blastocyst (E4.5) lineages. (e) Averaged percentage contribution of unmarked and RDB-marked cell clones, of control and clonal Tead4-KD chimeric embryos, immuno-stained for Cdx2 and Gata4, between the TE (blue) & ICM (yellow) and the PrE (green) & EPI (orange) of analysed late blastocysts (E4.5). Overall, for control chimeras n = 30 and for clonal Tead4-KD chimeras n = 17. Note, further analysis and variant presentation of the above data is provided in Supplementary Fig. S7 and Supplementary Tables ST11 and ST12.
Figure 5
Figure 5. Clonal TE-inhibition causes outer-cell Yap1 mis-localisation and enhanced 32-cell stage apical polarity.
A schematic of experimental strategy to assay, via confocal immuno-staining, Yap1 and phospho-ezrin/radixin/moesin (pERM) expression in TE-inhibited clones (comprising half the embryos cells) at the mid-16-cell (E3.1) or 32-cell (E3.6) stages is shown (top). Lower panels; representative single confocal z-plane micrographs of control and Tead4-KD embryos immuno-stained for Yap1 (anti-sera does not discriminate between phosphorylated or non-phosphorylated forms) and pERM expression at the mid-16-cell and 32-cell stages (both in green). DNA DAPI counter-stain (blue) and RDB marked microinjected clones (red) are also shown. Arrows and arrow-heads highlight exemplar Yap1/pERM protein expression within non-microinjected and microinjected clones respectively. In Yap1 images the white arrows or arrow-heads indicate staining in outer-cells and yellow variants in inner-cells (second polar body = ‘PB’). Double crosshairs denote outer 32-cell stage cells in the Tead4-KD group exhibiting atypical morphology with enhanced apically localised pERM immuno-staining (also seen in Prkcz and Pard6b immuno-staining—Supplementary Fig. S9). Scale bars = 10 μm.
Figure 6
Figure 6. Global and clonal TE-inhibition; no enhanced Nanog expression prior to 32-cell stage but attenuated PrE-specific marker expression.
(a) The experimental strategy to down-regulate Tead4 and inhibit TE-differentiation throughout all cells of the embryo prior to Q-RTPCR analysis (upper). Normalised expression fold changes, resulting from Tead4-KD, of the stated transcripts at the mid-16-cell (E3.1) or 32-cell (E3.6) stages (lower panels). Individual gene mRNA levels were normalised against Rpl23 and/or H2afz transcript levels within control and experimental knockdown conditions prior to fold change calculation. Errors = s.e.m, n = at least 2 for biological and 3 for technical replicates (n.b. Tead4 specific data is repeated from Fig. 1 as Q-RTPCR was performed from same cDNA preparations). (b) Confocal microscopy analysis of Nanog (green) expression after clonal Tead4-KD at the mid-16-cell (E3.1) and 32-cell (E3.6) stages. Arrows and arrow-heads denote exemplar Nanog expression in non-microinjected and microinjected clones, respectively. Asterisks highlight TE cells without Nanog expression reflecting previously characterised inter-cell heterogeneity. (c) Confocal microscopy analysis of Fgfr2 (red) expression after clonal Tead4-KD at the non-cavitated 32-cell (E3.5) blastocyst stage. Representative single z-plane confocal micrographs are shown (middle panels) with the lower 4 panels detailing magnified anti-Fgfr2 immuno-stained images, according to numbered regions of interest. Arrow-heads highlight plasma membrane associated Fgfr2 between neighbouring ICM cells (control embryos) and arrows approximate equivalent regions of other neighbouring ICM cells without anti-Fgfr2 signal (illustrating heterogeneous Fgfr2 expression within control embryo ICMs). Similarly, arrows show ICM cell boundaries between cells of the microinjected clone devoid of Fgfr2 in Tead4-KD embryos. Asterisks and lollipop markers, in both control and Tead4-KD embryos, show nuclear Fgfr2 protein (especially in Tead4-KD embryos) or expression at the interface of TE and ICM cells, respectively. In both (b,c) progeny cells of microinjected clones are distinguishable by co-injected RDBs (red) or OGDBs (Oregon-green dextran beads—green). DNA was counterstained with DAPI (blue) and scale bars = 10 μm.

Similar articles

Cited by

References

    1. Rossant J. & Tam P. P. Blastocyst lineage formation, early embryonic asymmetries and axis patterning in the mouse. Development 136, 701–713, 10.1242/dev.017178 (2009). - DOI - PubMed
    1. Zernicka-Goetz M., Morris S. A. & Bruce A. W. Making a firm decision: multifaceted regulation of cell fate in the early mouse embryo. Nat Rev Genet 10, 467–477 (2009). - PubMed
    1. Schrode N. et al. Anatomy of a blastocyst: Cell behaviors driving cell fate choice and morphogenesis in the early mouse embryo. Genesis, 10.1002/dvg.22368 (2013). - DOI - PMC - PubMed
    1. Johnson M. H. & Ziomek C. A. The foundation of two distinct cell lineages within the mouse morula. Cell 24, 71–80 (1981). - PubMed
    1. Sutherland A. E., Speed T. P. & Calarco P. G. Inner cell allocation in the mouse morula: the role of oriented division during fourth cleavage. Dev Biol 137, 13–25 (1990). - PubMed

Publication types