. 2016 Mar;7(1):80-93.
doi: 10.1002/jrsm.1167. Epub 2015 Oct 13.

Automated generation of node-splitting models for assessment of inconsistency in network meta-analysis

Affiliations

Automated generation of node-splitting models for assessment of inconsistency in network meta-analysis

Gert van Valkenhoef et al. Res Synth Methods. 2016 Mar.

Abstract

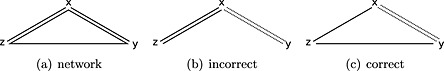
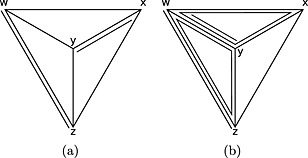
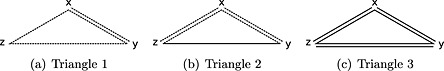
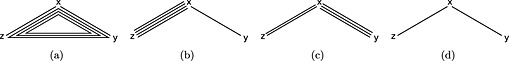
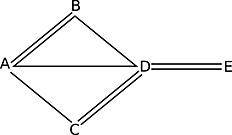
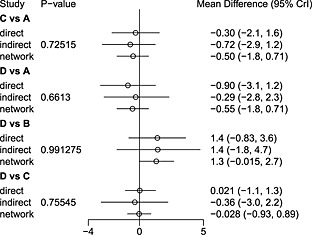
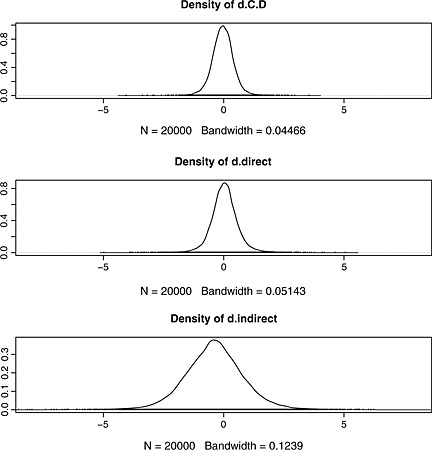
Network meta-analysis enables the simultaneous synthesis of a network of clinical trials comparing any number of treatments. Potential inconsistencies between estimates of relative treatment effects are an important concern, and several methods to detect inconsistency have been proposed. This paper is concerned with the node-splitting approach, which is particularly attractive because of its straightforward interpretation, contrasting estimates from both direct and indirect evidence. However, node-splitting analyses are labour-intensive because each comparison of interest requires a separate model. It would be advantageous if node-splitting models could be estimated automatically for all comparisons of interest. We present an unambiguous decision rule to choose which comparisons to split, and prove that it selects only comparisons in potentially inconsistent loops in the network, and that all potentially inconsistent loops in the network are investigated. Moreover, the decision rule circumvents problems with the parameterisation of multi-arm trials, ensuring that model generation is trivial in all cases. Thus, our methods eliminate most of the manual work involved in using the node-splitting approach, enabling the analyst to focus on interpreting the results.

Keywords: Bayesian modelling; meta-analysis; mixed treatment comparisons; model generation; network meta-analysis; node splitting.


Figures

Figure 1
Figure 1
Evidence structure that requires a specific choice of reference treatments if we split d x,y. In (a), the evidence network is shown with lines to represent two‐arm trials and triangles to represent three‐arm trials. In (b) and (c), two possible parameterisations of the indirect evidence when the xy comparison is split are shown as solid lines: in (b), x is the reference treatment for the multi‐arm trial, and in (c), y is. The direct evidence is shown as dotted lines.
Figure 2
Figure 2
These evidence structures illustrate networks in which defining potential inconsistency is not straightforward. Two‐arm trials are shown as lines that stop short of vertices, three‐arm trials as triangles and four‐arm trials as tetrahedrons. (a) A network with one four‐arm and two two‐arm trials, where it is unclear whether loop inconsistency can occur. (b) A more complex network with one four‐arm, two three‐arm, and two two‐arm trials where the dependencies between potential loop inconsistencies are difficult to work out.
Figure 3
Figure 3
Some evidence structures and the nodes that will be split according to the proposed decision rule. Comparisons that will be split are shown as solid lines, and those that will not as dashed lines. Three‐arm trials are shown as triangles. In (a) no comparisons will be split, in (b) only the yz comparison will be split, and in (c) all three comparisons will be split.
Figure 4
Figure 4
When splitting the yz comparison of the network shown in (a), the indirect evidence can be parameterised in 23 + 1 = 9 ways owing to the three three‐arm trials that include yz. Three such ways are shown here: (b) consistently include the xz comparison of the three‐arm trials; (c) include xy for some trials and xz for others; (d) include neither the xy nor the xz comparison.
Figure 5
Figure 5
Evidence network for the Parkinson's disease dataset. A = placebo; B = pramipexole; C = ropinirole; D = bromocriptine; E = cabergoline.
Figure 6
Figure 6
Summary of a node‐splitting analysis consisting of four separate node‐splitting models and a consistency model. A = placebo; B = pramipexole; C = ropinirole; D = bromocriptine; E = cabergoline.
Figure 7
Figure 7
Comparison of posterior densities estimated for the CD comparison from the consistency model (top), and direct (middle) and indirect (bottom) evidence from the node‐splitting model. N is the sample size, and ‘Bandwidth’ is a parameter of the kernel density estimation that is used to produce smooth density plots. The coda package automatically sets the bandwidth as a function of the standard deviation, the interquartile range and the size of the sample.

References

    1. Bucher HC, Guyatt GH, Griffith LE, Walter SD. 1997. The results of direct and indirect treatment comparisons in meta‐analysis of randomized controlled trials. Journal of Clinical Epidemiology 50(6): 683–691. DOI: - DOI - PubMed
    1. Caldwell DM, Ades AE, Higgins JPT. 2005. Simultaneous comparison of multiple treatments: combining direct and indirect evidence. BMJ 331(7521): 897–900. DOI: . - DOI - PMC - PubMed
    1. Dias S, Sutton AJ, Ades AE, Welton NJ. 2013a. A generalized linear modeling framework for pairwise and network meta‐analysis of randomized controlled trials. Medical Decision Making 33(5): 607–617. DOI: . - DOI - PMC - PubMed
    1. Dias S, Welton NJ, Caldwell DM, Ades AE. 2010. Checking consistency in mixed treatment comparison meta‐analysis. Statistics in Medicine 29(7–8, Sp. Iss. SI): 932–944. DOI: - DOI - PubMed
    1. Dias S, Welton NJ, Sutton AJ, Caldwell DM, Lu G, Ades AE. 2013b. Inconsistency in networks of evidence based on randomized controlled trials. Medical Decision Making 33(5): 641–656. DOI: - DOI - PMC - PubMed

LinkOut - more resources