

Landscape of Targeted Anti-Cancer Drug Synergies in Melanoma Identifies a Novel BRAF-VEGFR/PDGFR Combination Treatment
- PMID: 26461489
- PMCID: PMC4604168
- DOI: 10.1371/journal.pone.0140310
Landscape of Targeted Anti-Cancer Drug Synergies in Melanoma Identifies a Novel BRAF-VEGFR/PDGFR Combination Treatment
Erratum in
-
Correction: Landscape of Targeted Anti-Cancer Drug Synergies in Melanoma Identifies a Novel BRAF-VEGFR/PDGFR Combination Treatment.PLoS One. 2024 Jul 1;19(7):e0306658. doi: 10.1371/journal.pone.0306658. eCollection 2024. PLoS One. 2024. PMID: 38950005 Free PMC article.
Abstract
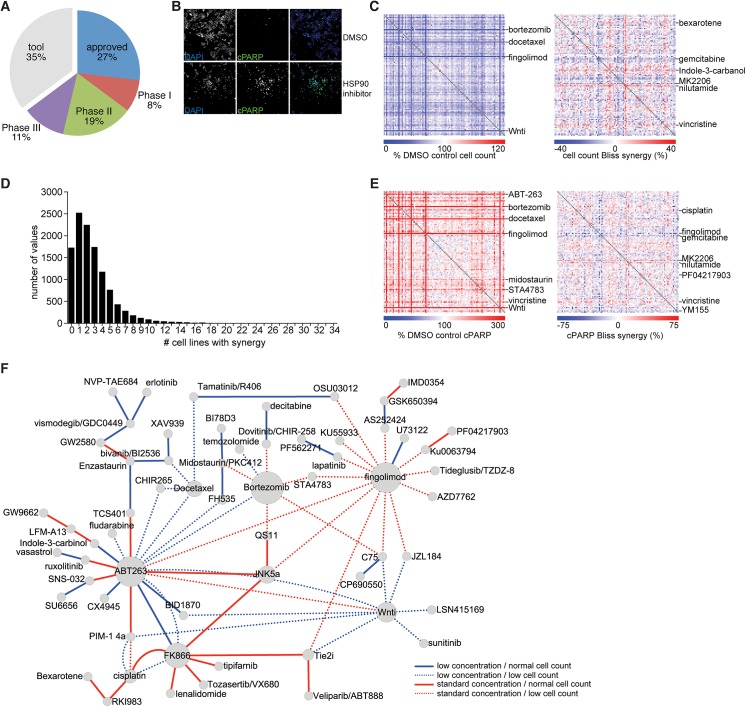
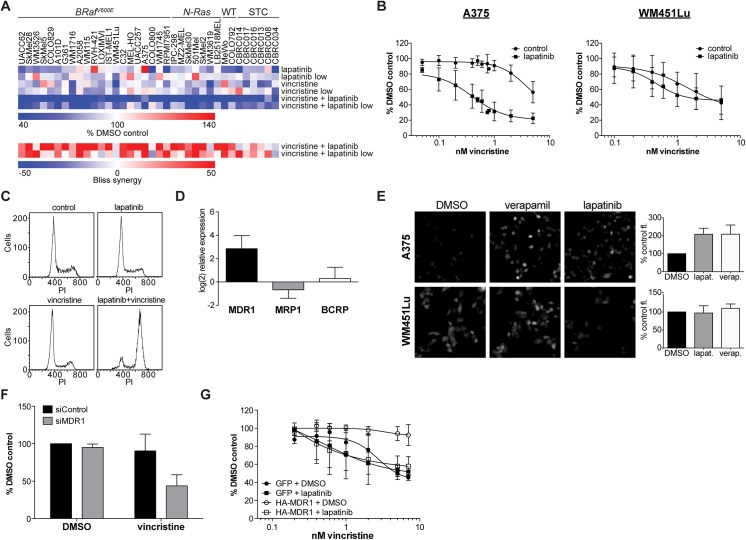
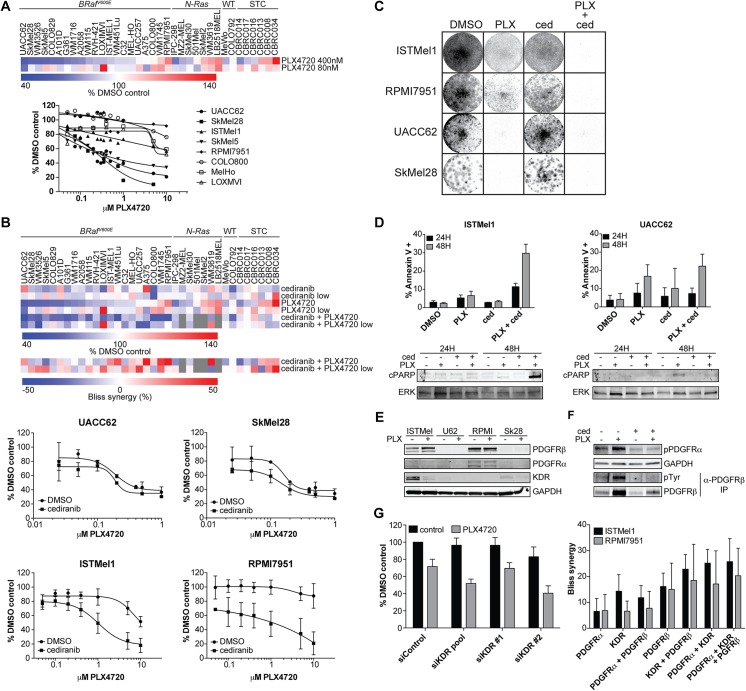
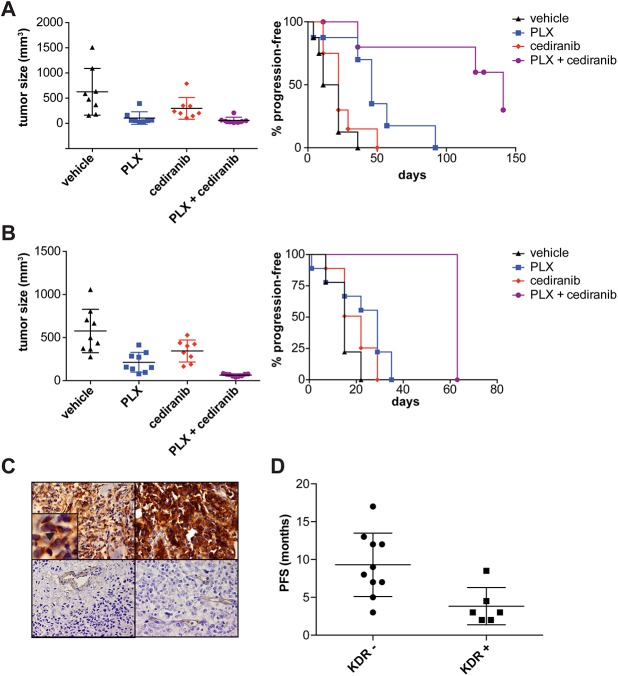
A newer generation of anti-cancer drugs targeting underlying somatic genetic driver events have resulted in high single-agent or single-pathway response rates in selected patients, but few patients achieve complete responses and a sizeable fraction of patients relapse within a year. Thus, there is a pressing need for identification of combinations of targeted agents which induce more complete responses and prevent disease progression. We describe the results of a combination screen of an unprecedented scale in mammalian cells performed using a collection of targeted, clinically tractable agents across a large panel of melanoma cell lines. We find that even the most synergistic drug pairs are effective only in a discrete number of cell lines, underlying a strong context dependency for synergy, with strong, widespread synergies often corresponding to non-specific or off-target drug effects such as multidrug resistance protein 1 (MDR1) transporter inhibition. We identified drugs sensitizing cell lines that are BRAFV600E mutant but intrinsically resistant to BRAF inhibitor PLX4720, including the vascular endothelial growth factor receptor/kinase insert domain receptor (VEGFR/KDR) and platelet derived growth factor receptor (PDGFR) family inhibitor cediranib. The combination of cediranib and PLX4720 induced apoptosis in vitro and tumor regression in animal models. This synergistic interaction is likely due to engagement of multiple receptor tyrosine kinases (RTKs), demonstrating the potential of drug- rather than gene-specific combination discovery approaches. Patients with elevated biopsy KDR expression showed decreased progression free survival in trials of mitogen-activated protein kinase (MAPK) kinase pathway inhibitors. Thus, high-throughput unbiased screening of targeted drug combinations, with appropriate library selection and mechanistic follow-up, can yield clinically-actionable drug combinations.
Conflict of interest statement
Figures
Similar articles
-
Unresponsiveness of colon cancer to BRAF(V600E) inhibition through feedback activation of EGFR.Nature. 2012 Jan 26;483(7387):100-3. doi: 10.1038/nature10868. Nature. 2012. PMID: 22281684
-
p53 Reactivation by PRIMA-1(Met) (APR-246) sensitises (V600E/K)BRAF melanoma to vemurafenib.Eur J Cancer. 2016 Mar;55:98-110. doi: 10.1016/j.ejca.2015.12.002. Epub 2016 Jan 17. Eur J Cancer. 2016. PMID: 26790143
-
Combinatorial drug screening and molecular profiling reveal diverse mechanisms of intrinsic and adaptive resistance to BRAF inhibition in V600E BRAF mutant melanomas.Oncotarget. 2016 Jan 19;7(3):2734-53. doi: 10.18632/oncotarget.6548. Oncotarget. 2016. PMID: 26673621 Free PMC article.
-
Clinical Development of BRAF plus MEK Inhibitor Combinations.Trends Cancer. 2020 Sep;6(9):797-810. doi: 10.1016/j.trecan.2020.05.009. Epub 2020 Jun 13. Trends Cancer. 2020. PMID: 32540454 Review.
-
BRAF as a target for cancer therapy.Anticancer Agents Med Chem. 2011 Mar;11(3):285-95. doi: 10.2174/187152011795347469. Anticancer Agents Med Chem. 2011. PMID: 21426297 Review.
Cited by
-
PS4DR: a multimodal workflow for identification and prioritization of drugs based on pathway signatures.BMC Bioinformatics. 2020 Jun 5;21(1):231. doi: 10.1186/s12859-020-03568-5. BMC Bioinformatics. 2020. PMID: 32503412 Free PMC article.
-
A Platform of Synthetic Lethal Gene Interaction Networks Reveals that the GNAQ Uveal Melanoma Oncogene Controls the Hippo Pathway through FAK.Cancer Cell. 2019 Mar 18;35(3):457-472.e5. doi: 10.1016/j.ccell.2019.01.009. Epub 2019 Feb 14. Cancer Cell. 2019. PMID: 30773340 Free PMC article.
-
Gene Fusions Create Partner and Collateral Dependencies Essential to Cancer Cell Survival.Cancer Res. 2021 Aug 1;81(15):3971-3984. doi: 10.1158/0008-5472.CAN-21-0791. Epub 2021 Jun 7. Cancer Res. 2021. PMID: 34099491 Free PMC article.
-
Correction: Landscape of Targeted Anti-Cancer Drug Synergies in Melanoma Identifies a Novel BRAF-VEGFR/PDGFR Combination Treatment.PLoS One. 2024 Jul 1;19(7):e0306658. doi: 10.1371/journal.pone.0306658. eCollection 2024. PLoS One. 2024. PMID: 38950005 Free PMC article.
-
Genome-wide prediction of synthetic rescue mediators of resistance to targeted and immunotherapy.Mol Syst Biol. 2019 Mar 11;15(3):e8323. doi: 10.15252/msb.20188323. Mol Syst Biol. 2019. PMID: 30858180 Free PMC article.
References
-
- Villanueva J, Vultur A, Lee JT, Somasundaram R, Fukunaga-Kalabis M, Cipolla AK, et al. Acquired resistance to BRAF inhibitors mediated by a RAF kinase switch in melanoma can be overcome by cotargeting MEK and IGF-1R/PI3K. Cancer Cell. 2010;18(6):683–95. Epub 2010/12/16. doi: S1535-6108(10)00484-8 [pii] 10.1016/j.ccr.2010.11.023 - DOI - PMC - PubMed
Publication types
MeSH terms
Substances
Grants and funding
- U54 CA163125/CA/NCI NIH HHS/United States
- U54 HG006097/HG/NHGRI NIH HHS/United States
- T32 AR007098/AR/NIAMS NIH HHS/United States
- 102696/WT_/Wellcome Trust/United Kingdom
- R01 AR043369/AR/NIAMS NIH HHS/United States
- 086357/WT_/Wellcome Trust/United Kingdom
- T32AR007098-38/AR/NIAMS NIH HHS/United States
- P01 CA163222/CA/NCI NIH HHS/United States
- 1U54HG006097-01/HG/NHGRI NIH HHS/United States
- R21CA175907/CA/NCI NIH HHS/United States
- P01CA163222/CA/NCI NIH HHS/United States
- WT_/Wellcome Trust/United Kingdom
- 1K08CA160692-01A1/CA/NCI NIH HHS/United States
- R21 CA175907/CA/NCI NIH HHS/United States
- K08 CA160692/CA/NCI NIH HHS/United States
- U54CA163125/CA/NCI NIH HHS/United States
LinkOut - more resources
Full Text Sources
Other Literature Sources
Medical
Research Materials
Miscellaneous
