. 2015 Oct 13;8(398):rs12.
doi: 10.1126/scisignal.aab3138.

Quantitative phosphoproteomics reveals new roles for the protein phosphatase PP6 in mitotic cells

Affiliations

Quantitative phosphoproteomics reveals new roles for the protein phosphatase PP6 in mitotic cells

Scott F Rusin et al. Sci Signal. .

Abstract

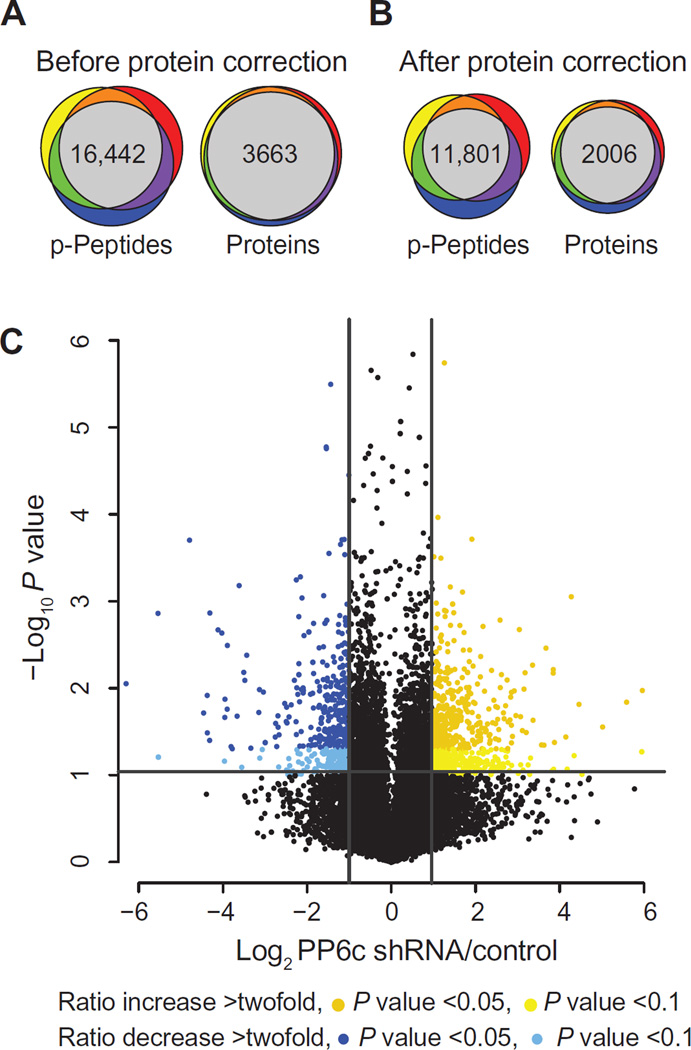
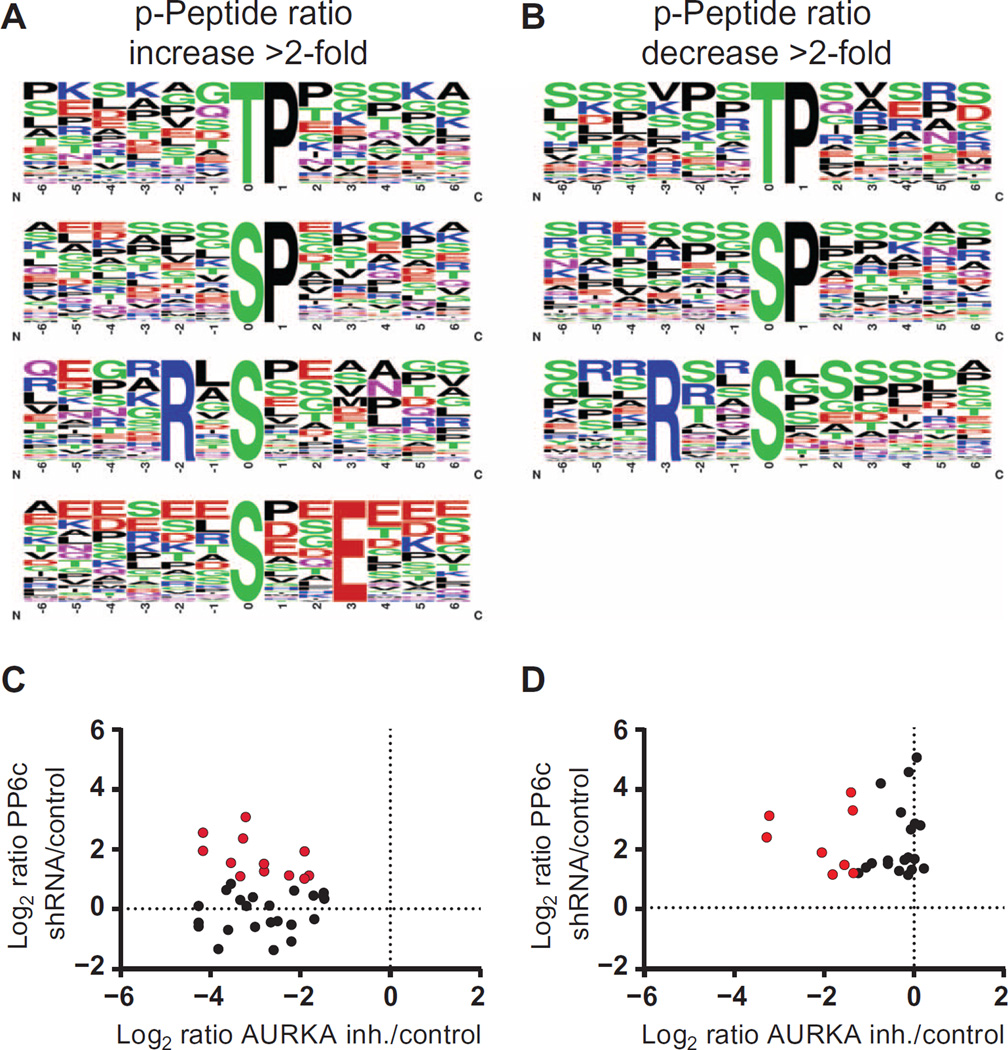
Protein phosphorylation is an important regulatory mechanism controlling mitotic progression. Protein phosphatase 6 (PP6) is an essential enzyme with conserved roles in chromosome segregation and spindle assembly from yeast to humans. We applied a baculovirus-mediated gene silencing approach to deplete HeLa cells of the catalytic subunit of PP6 (PP6c) and analyzed changes in the phosphoproteome and proteome in mitotic cells by quantitative mass spectrometry-based proteomics. We identified 408 phosphopeptides on 272 proteins that increased and 298 phosphopeptides on 220 proteins that decreased in phosphorylation upon PP6c depletion in mitotic cells. Motif analysis of the phosphorylated sites combined with bioinformatics pathway analysis revealed previously unknown PP6c-dependent regulatory pathways. Biochemical assays demonstrated that PP6c opposed casein kinase 2-dependent phosphorylation of the condensin I subunit NCAP-G, and cellular analysis showed that depletion of PP6c resulted in defects in chromosome condensation and segregation in anaphase, consistent with dysregulation of condensin I function in the absence of PP6 activity.


Figures

Fig. 1
Fig. 1. Strategy to determine PP6c–dependent phosphorylation changes in cells by quantitative phosphoproteomics
(A) Vector map of pFastBacMam-shRNA-GFP. SV40 PA term, simian virus 40 polyadenylation terminator; EGFP, enhanced GFP; CMV, cytomegalovirus promoter; Amp, ampicillin resistance gene. (B) Representative immunofluorescence micrographs of HeLa cells infected with dual PP6c shRNA- and GFP-expressing baculoviruses. Scale bar, 50 µm. GFP protein abundance was comparable for all tested PP6c shRNA and control viruses (fig. S1A). GFP protein abundance was performed in all experiments to determine infection efficiency. DAPI, 4′,6-diamidino-2-phenylindole. (C) Western blot analysis of PP6c and GFP abundance in HeLa cells infected with viruses encoding control or both PP6c-1 and PP6c-4 shRNAs (PP6c shRNA). Lamin A/C is the loading control. (D) Scheme depicting experimental strategy for determining PP6c–dependent changes in phosphorylation site occupancy upon PP6c depletion. Mitotically arrested HeLa cells infected with viruses encoding control or PP6c shRNAs were separately lysed, reduced, alkylated, and trypsin digested. Phosphopeptides (p-peptides) were enriched using titanium dioxide microspheres, heavy or light labeled by reductive dimethylation, and mixed. Phosphopeptides were separated by strong cation exchange (SCX) chromatography and analyzed by LC-MS/MS (n = 3 independent experiments). (E) Western blot analysis of PP6c abundance and AURKA pThr288 in HeLa cell lysates as described in (D). Lamin A/C is the loading control. (F) Quantification of PP6c, AURKA pThr288, and lamin A/C abundance. PP6c and AURKA pThr288 abundances were normalized to Lamin A/C. *P < 0.05, ***P < 0.001 (n = 3 independent experiments).
Fig. 2
Fig. 2. Candidate phosphorylation site substrates of PP6 in mitosis
(A) Venn diagrams depicting overlap of identified and quantified phospho-peptides and proteins in biological triplicate experiments. (B) Venn diagrams depicting overlap of identified and quantified phosphopeptides and proteins after protein correction in these experiments. In (A) and (B), each experiment is represented by a color, and gray is the overlap in all three experiments. (C) Volcano plot of log2 ratios of protein-corrected phosphopeptides from (B) plotted against the negative log10 of the P value of their fold change. We used the 298 phosphopeptides that decreased and the 408 phosphopeptides that increased because of phosphorylation abundance changes for subsequent analysis.
Fig. 3
Fig. 3. Motif analysis and comparison of candidate PP6c substrates with known AURKA phosphorylation sites
(A) Enriched phosphorylation site motifs of phosphopeptides significantly increased by twofold or more upon PP6c depletion. (B) Enriched phosphorylation site motifs of phosphopeptides significantly decreased by twofold or more upon PP6c depletion. (C) Scatter plot of phosphopeptides that were previously ascribed to AURKA activity versus their fold change upon PP6c depletion. (D) Scatter plot of phosphopeptides that contain a basophilic [RXp(S/T)] motif and increase by twofold or more upon PP6c depletion versus their fold change upon inhibition with AURKA inhibitor. In (C) and (D), red circles represent phosphorylation sites regulated upon both AURKA inhibition and PP6c depletion, and black circles represent sites regulated upon either AURKA inhibition (C) or PP6c depletion (D). Dotted black lines indicate zero coordinates.
Fig. 4
Fig. 4. Processes regulated by PP6c in mitotic cells
(A) Subnetwork depicting the connectivity of highly connected clusters in the protein-protein interaction network from phosphopeptides significantly increased in phosphorylation upon PP6c depletion in mitotically arrested cells. Proteins in the different colored clusters and their enrichment in biological processes and cellular components are shown. (B) Subnetwork depicting the connectivity of highly connected clusters in the protein-protein interaction network from phosphopeptides significantly decreased in phosphorylation upon PP6c depletion in mitotically arrested cells. Proteins in the different colored clusters and their enrichment in biological processes and cellular components are shown.
Fig. 5
Fig. 5. In vitro PP6 dephosphorylation analysis of NCAP-G
(A) Scheme depicting the experimental strategy for PP6 in vitro phosphatase assay. Purified condensin I was incubated with or without purified PP6 holoenzyme and resolved by SDS-PAGE. NCAP-G was excised and digested, and peptides were differentially labeled by reductive dimethylation, mixed, and analyzed by LC-MS/MS (n = 3 independent experiments). (B) SDS-PAGE gel of condensin I purification. (C) Relative intensities of LC-MS/MS traces of heavy- and light-labeled phosphopeptides corresponding to the singly phosphorylated Ser973/5 phosphorylation site in NCAP-G, extracted to ±2 parts per million (ppm). Phosphopeptide sequence, charge state, and ion mass-to-charge ratios are indicated. Acidic amino acids are highlighted in red. (D) Relative intensities of LC-MS/MS traces of the heavy- and light-labeled unphosphorylated peptide spanning Ser973/5, extracted to ±2 ppm. Peptide sequence, charge state, and ion mass-to-charge ratios are indicated. Acidic amino acids are highlighted in red. Blue lines in (C) and (D) represent the samples incubated with buffer, and gray lines represent the samples incubated with purified PP6c. (E) Scheme depicting experimental strategy for CK2 in vitro kinase assay. Purified and λ-phosphatase– dephosphorylated condensin I was incubated with or without purified CK2 and resolved by SDS-PAGE. NCAP-G was excised and digested, and peptides were labeled by reductive dimethylation, mixed, and analyzed by LC-MS/MS (n = 3 independent experiments). (F) Relative intensities of LC-MS/MS traces of heavy- and light-labeled phosphopeptides covering the Ser973/5 phosphorylation site in NCAP-G, extracted to ±2 ppm. Phosphopeptide sequence, charge state, and peptide ion mass-to-charge values are indicated. Acidic amino acids are highlighted in red. (G) Relative intensities of LC-MS/MS traces of the heavy- and light-labeled corresponding unphosphorylated peptide, extracted to ±2 ppm. Peptide sequence, charge state, and peptide ion mass-to-charge values are indicated. Acidic amino acids are highlighted in red. Blue lines in (F) and (G) represent the samples incubated with buffer and gray lines represent the samples incubated with purified CK2.
Fig. 6
Fig. 6. PP6-dependent defects in chromosome condensation and segregation in mitosis
(A) Effect of NCAP-G or PP6c depletion on chromosome hypercondensation. Immunofluorescence micrographs depicting representative hypercondensed or normally condensed chromosomes in chromosome spreads of HeLa cells. Scale bar, 10 µm. (B) Quantification of differences between normally condensed and hypercondensed chromosomes upon NCAP-G depletion (left) and PP6c depletion (right). (C) Effect of NCAP-G or PP6c depletion on the formation of lagging chromosomes and chromosome bridges. Immunofluorescence micrographs depicting representative images of chromosome segregation defects in anaphase in PP6c shRNA–infected HeLa cells. Scale bar, 5 µm. (D) Quantification of the number of lagging chromosomes and chromatin bridges in NCAP-G–depleted (left) or PP6c–depleted (right) HeLa cells. Quantified data are shown as means with SD. **P < 0.005; *P < 0.05, paired Student’s t test (n = 3 independent experiments).
Fig. 7
Fig. 7. Model of regulation of condensin I activity
Scheme depicting mechanism of condensin I regulation adapted from Takemoto et al. (81). In G1/S, condensin I is phosphorylated by CK2, maintaining condensin I in an inactive state. In G2, Cdk1 phosphorylates condensin I, which partially activates the DNA supercoiling activity of the complex. As cells enter mitosis and during mitosis, CK2-dependent phosphorylation sites become dephosphorylated, maximally activating condensin I. On the basis of our results, PP6c contributes to this process by dephosphorylating CK2 sites on NCAP-G.

References

    1. Barr FA, Elliott PR, Gruneberg U. Protein phosphatases and the regulation of mitosis. J. Cell Sci. 2011;124:2323–2334. - PubMed
    1. Wurzenberger C, Gerlich DW. Phosphatases: Providing safe passage through mitotic exit. Nat. Rev. Mol. Cell Biol. 2011;12:469–482. - PubMed
    1. Janssens V, Goris J. Protein phosphatase 2A: A highly regulated family of serine/ threonine phosphatases implicated in cell growth and signalling. Biochem. J. 2001;353:417–439. - PMC - PubMed
    1. Swingle M, Ni L, Honkanen RE. Small-molecule inhibitors of ser/thr protein phosphatases: Specificity, use and common forms of abuse. Methods Mol. Biol. 2007;365:23–38. - PMC - PubMed
    1. Prickett TD, Brautigan DL. The α4 regulatory subunit exerts opposing allosteric effects on protein phosphatases PP6 and PP2A. J. Biol. Chem. 2006;281:30503–30511. - PubMed

Publication types

MeSH terms

LinkOut - more resources