. 2016 Feb;15(1):28-38.
doi: 10.1111/acel.12405. Epub 2015 Oct 13.

Alternative rapamycin treatment regimens mitigate the impact of rapamycin on glucose homeostasis and the immune system

Affiliations

Alternative rapamycin treatment regimens mitigate the impact of rapamycin on glucose homeostasis and the immune system

Sebastian I Arriola Apelo et al. Aging Cell. 2016 Feb.

Abstract

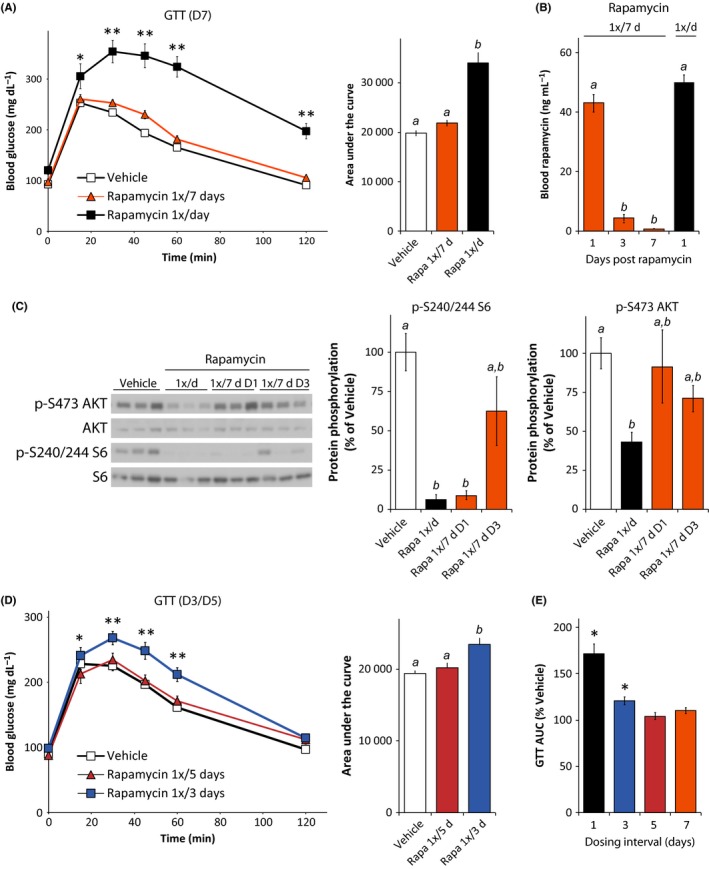
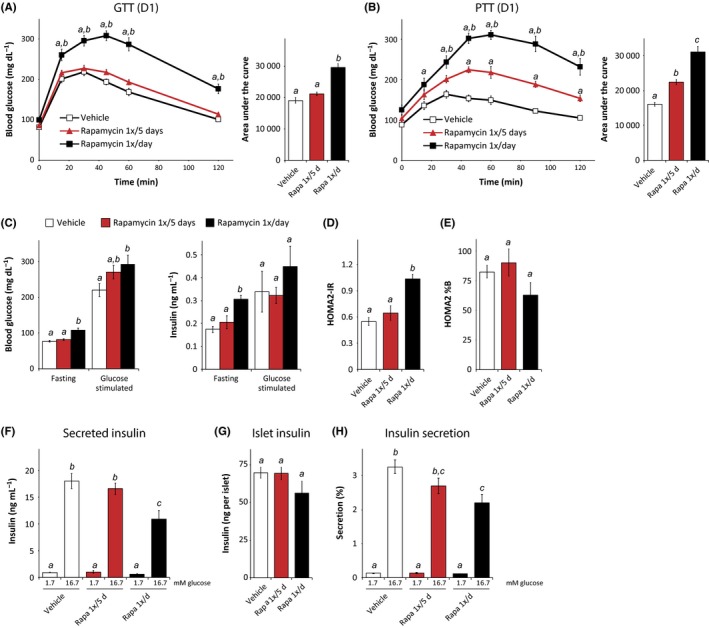
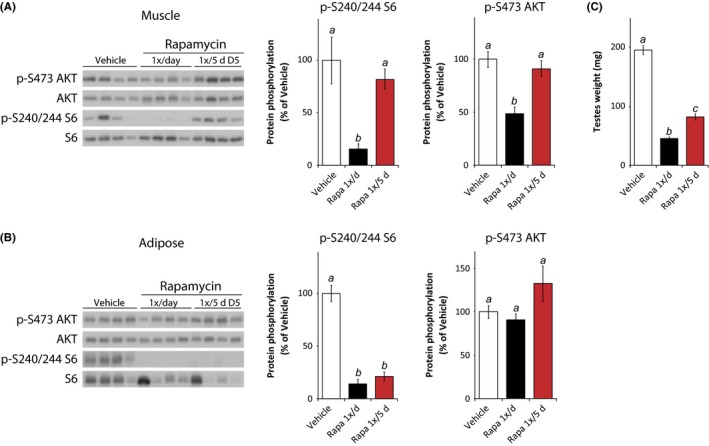
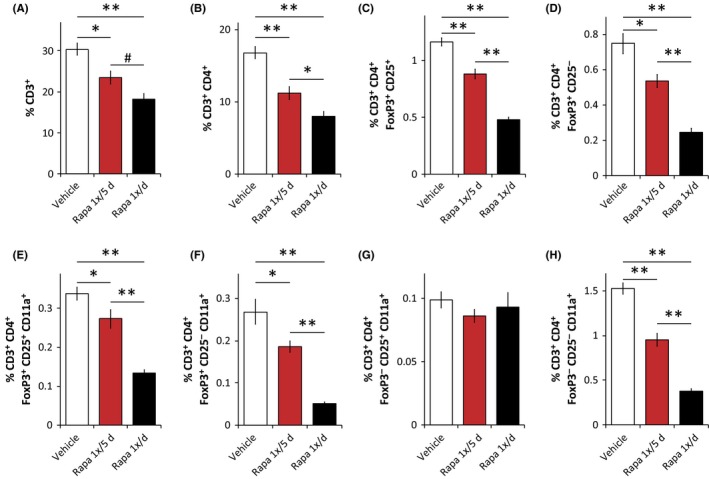
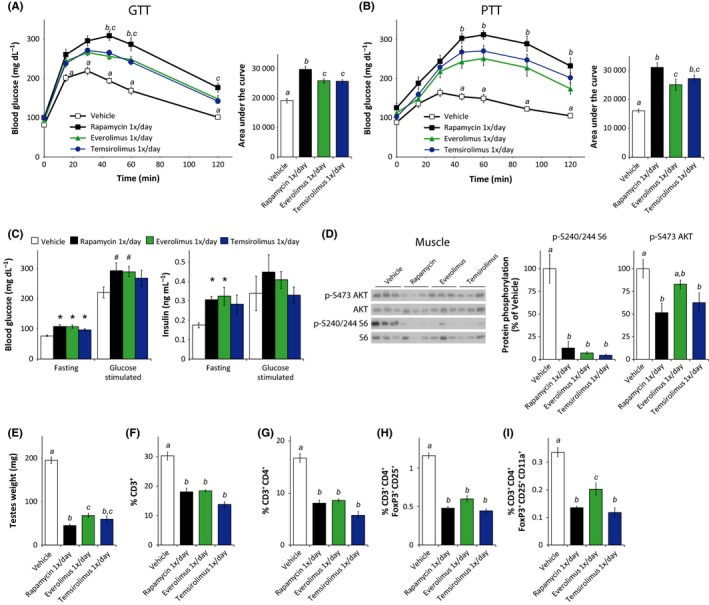
Inhibition of the mechanistic target of rapamycin (mTOR) signaling pathway by the FDA-approved drug rapamycin has been shown to promote lifespan and delay age-related diseases in model organisms including mice. Unfortunately, rapamycin has potentially serious side effects in humans, including glucose intolerance and immunosuppression, which may preclude the long-term prophylactic use of rapamycin as a therapy for age-related diseases. While the beneficial effects of rapamycin are largely mediated by the inhibition of mTOR complex 1 (mTORC1), which is acutely sensitive to rapamycin, many of the negative side effects are mediated by the inhibition of a second mTOR-containing complex, mTORC2, which is much less sensitive to rapamycin. We hypothesized that different rapamycin dosing schedules or the use of FDA-approved rapamycin analogs with different pharmacokinetics might expand the therapeutic window of rapamycin by more specifically targeting mTORC1. Here, we identified an intermittent rapamycin dosing schedule with minimal effects on glucose tolerance, and we find that this schedule has a reduced impact on pyruvate tolerance, fasting glucose and insulin levels, beta cell function, and the immune system compared to daily rapamycin treatment. Further, we find that the FDA-approved rapamycin analogs everolimus and temsirolimus efficiently inhibit mTORC1 while having a reduced impact on glucose and pyruvate tolerance. Our results suggest that many of the negative side effects of rapamycin treatment can be mitigated through intermittent dosing or the use of rapamycin analogs.

Keywords: aging; mechanistic target of rapamycin; mice; rapamycin.


Figures

Figure 1
Figure 1
Intermittent treatment with rapamycin minimizes glucose intolerance and mTORC2 inhibition. Glucose tolerance test on male C57BL/6J mice (A) treated with vehicle or with 2 mg/kg rapamycin (1×/day or 1×/7 days) for 2 weeks, performed 7 days after the last treatment of the rapamycin 1×/7 days group (D7) [n = 10 vehicle, n = 9 1×/day rapamycin, and n = 11 1×/7 days rapamycin; for GTT, *P < 0.05, **P < 0.0001 vs. all groups, Tukey–Kramer test following two‐way repeated‐measures anova; for AUC, means with the same letter are not significantly different from each other (Tukey–Kramer test following one‐way anova, P < 0.05)]. (B) Rapamycin concentration in blood from male C57Bl/6J mice treated with 2 mg/kg rapamycin (1×/day or 1×/7 days) for 8 weeks; blood from 1×/7 days mice was collected 1 day (D1), 3 days (D3), or 7 days (D7) after the more recent rapamycin injection (n = 3–6/group; means with the same letter are not significantly different from each other (Tukey–Kramer test following one‐way anova, P < 0.05). (C) Western blotting analysis and quantification of phosphorylated S6 (S240/244) and Akt (S473) phosphorylation in skeletal muscle [n = 9 vehicle, 7 1×/day rapamycin, 3 rapamycin 1×/7d D1, 6 rapamycin 1×/7d D3; means with the same letter are not significantly different from each other (Tukey–Kramer test following one‐way anova, P < 0.05)]. (D) Glucose tolerance test on mice treated intermittently with either vehicle or with 2 mg/kg rapamycin (1×/3 or 5 days) for 2 weeks, performed 3 days after the last treatment of the rapamycin 1×/3 days group and 5 days after the last treatment of the 1×/5 days group [n = 11/, for GTT, *P < 0.05 rapamycin 1×/3 days vs. rapamycin 1×/5 days, **P < 0.02 rapamycin 1×/3 days vs. all groups, Tukey–Kramer test following two‐way repeated‐measures anova; for AUC, means with the same letter are not significantly different from each other (Tukey–Kramer test following one‐way anova, P < 0.05)]. (E) Area under the curve for the glucose tolerance tests in Fig. 1A and 1D, expressed as percent of the AUC for vehicle‐treated mice in the corresponding experiment (*P < 0.001 vs. vehicle in the corresponding experiment, two‐tailed t‐test). Error bars represent standard error.
Figure 2
Figure 2
Reduced impact of intermittent rapamycin administration on glucose homeostasis. (A) Glucose and (B) pyruvate tolerance test on male C57BL/6J mice treated with vehicle or with 2 mg/kg rapamycin (1×/day or 1×/5 days) for 2 or 3 weeks, respectively [(n = 9 per treatment; for GTT/PTT, Tukey–Kramer test following two‐way repeated‐measures anova, a = P < 0.05 vs. vehicle, b = P < 0.05 vs. rapamycin 1×/5 days; for AUC, means with the same letter are not significantly different from each other (Tukey–Kramer test following one‐way anova, P < 0.05)]. (C) Fasting and glucose‐stimulated insulin secretion (GSIS) were measured by fasting mice treated for 5 weeks overnight, collecting serum, injecting 1 g/kg glucose, and collecting serum 15 min after injection [n = 9/group (glucose), 4/group (insulin), means with the same letter are not significantly different from each other (Tukey–Kramer test following one‐way anova, P < 0.05)]. (D, E) HOMA2‐IR and HOMA2%B were calculated using the fasting insulin data in C and fasting glucose data from the same mice [n = 4/group, means with the same letter are not significantly different from each other (Tukey–Kramer test following one‐way anova, P < 0.05)]. (F–H) Islets were isolated from vehicle and rapamycin (1×/day or 1×/5 days) mice treated for 8 weeks and were analyzed to determine insulin secretion in response to low (1.7 mm) and high (16.7 mm) glucose [n = 6 mice per treatment, means with the same letter are not significantly different from each other (Tukey–Kramer test following one‐way anova, P < 0.05)]. Error bars represent standard error.
Figure 3
Figure 3
Sustained impact of intermittent rapamycin on adipose mTORC1 and testes weight. (A) Muscle lysate and (B) adipose tissue lysate were analyzed by Western blotting, and the phosphorylation of S6 240/244 and AKT S473 relative to their respective total protein was quantified. Tissues were collected from mice treated with vehicle or rapamycin (1×/day or 1×/5 days) for 8 weeks, with the tissue collection scheduled such that the intermittent rapamycin treatment group was sacrificed 5 days after the previous rapamycin injection. Mice were fasted overnight and sacrificed following stimulation with 0.75 U/kg insulin for 15 min. Islets were isolated as described prior to tissue collection [n = 5–9 per treatment, means with the same letter are not significantly different from each other (Tukey–Kramer test following one‐way anova, P < 0.05)]. (C) The testes of mice in each treatment group were weighed [n = 9 per group, means with the same letter are not significantly different from each other (Tukey–Kramer test following one‐way anova, P < 0.05)]. Error bars represent standard error.
Figure 4
Figure 4
Intermittent rapamycin treatment has a reduced but significant impact on the immune system. (A–H) Flow cytometry analysis (expressed as percent of total live cells) of splenocytes from male C57BL/6J mice treated with vehicle or rapamycin (1×/day or 1×/5 days) for 8 weeks (n = 6–8 mice/group, # P < 0.052,*P < 0.05, **P < 0.0005, Tukey–Kramer test following one‐way anova). Error bars represent standard error.
Figure 5
Figure 5
Rapamycin analogs efficiently inhibit mTORC1 but show a reduced impact on glucose homeostasis and the immune system. (A) Glucose and (B) pyruvate tolerance tests on male C57BL/6J mice treated with vehicle or with 2 mg/kg rapamycin (1×/day) or equimolar amounts of everolimus or temsirolimus for 2 or 3 weeks, respectively [n = 9 per treatment; for GTT/PTT, Tukey–Kramer test following two‐way repeated‐measures anova, a = P < 0.05 vehicle vs. all groups, b = P < 0.05 rapamycin vs. everolimus, c = P < 0.05 rapamycin vs. temsirolimus. For AUC, means with the same letter are not significantly different from each other (Tukey–Kramer test following one‐way anova, P < 0.05)]. (C) Fasting and glucose‐stimulated insulin secretion (GSIS) were measured by fasting mice treated for 5 weeks overnight, collecting serum, injecting 1 g/kg glucose, and collecting serum 15 min after injection. [n = 9/group (glucose), 4/group (insulin), # P ≤ 0.08 vs. vehicle, *P ≤ 0.05 vs. vehicle, Dunnett's test following one‐way anova)]. (D) Muscle lysate was analyzed by Western blotting and the phosphorylation of S6 240/244 and AKT S473 relative to their respective total protein was quantified [n = 5–6 per treatment; means with the same letter are not significantly different from each other (Tukey–Kramer test following one‐way anova, P < 0.05)]. (E) The testes of mice in each treatment group were weighed [n = 9/group, means with the same letter are not significantly different from each other (Tukey–Kramer test following one‐way anova, P < 0.05)]. (F–I) Flow cytometry analysis (expressed as percent of total live cells) on splenocytes isolated from each treatment group [n = 3–8 mice/group, means with the same letter are not significantly different from each other (Tukey–Kramer test following one‐way anova, P < 0.05)]. The experiments presented here were conducted in parallel with the experiment presented in Figs 2, 3, 4, and the vehicle and daily (rapamycin 1×/day) data are duplicated here for ease of comparison. Error bars represent standard error.

References

    1. Anisimov VN, Zabezhinski MA, Popovich IG, Piskunova TS, Semenchenko AV, Tyndyk ML, Yurova MN, Antoch MP, Blagosklonny MV (2010) Rapamycin extends maximal lifespan in cancer‐prone mice. Am. J. Pathol. 176, 2092–2097. - PMC - PubMed
    1. Anisimov VN, Zabezhinski MA, Popovich IG, Piskunova TS, Semenchenko AV, Tyndyk ML, Yurova MN, Rosenfeld SV, Blagosklonny MV (2011) Rapamycin increases lifespan and inhibits spontaneous tumorigenesis in inbred female mice. Cell Cycle 10, 4230–4236. - PubMed
    1. Baker MD, Ezzati M, Aloisio GM, Tarnawa ED, Cuevas I, Nakada Y, Castrillon DH (2014) The small GTPase Rheb is required for spermatogenesis but not oogenesis. Reproduction 147, 615–625. - PMC - PubMed
    1. Barlow AD, Nicholson ML, Herbert TP (2013) Evidence for rapamycin toxicity in pancreatic beta‐cells and a review of the underlying molecular mechanisms. Diabetes 62, 2674–2682. - PMC - PubMed
    1. Byles V, Covarrubias AJ, Ben‐Sahra I, Lamming DW, Sabatini DM, Manning BD, Horng T (2013) The TSC‐mTOR pathway regulates macrophage polarization. Nat. Commun. 4, 2834. - PMC - PubMed

Publication types

MeSH terms