. 2015 Nov 27;290(48):28822-33.
doi: 10.1074/jbc.M115.656983. Epub 2015 Oct 13.

Dysregulation of Plasmalogen Homeostasis Impairs Cholesterol Biosynthesis

Affiliations

Dysregulation of Plasmalogen Homeostasis Impairs Cholesterol Biosynthesis

Masanori Honsho et al. J Biol Chem. .

Abstract

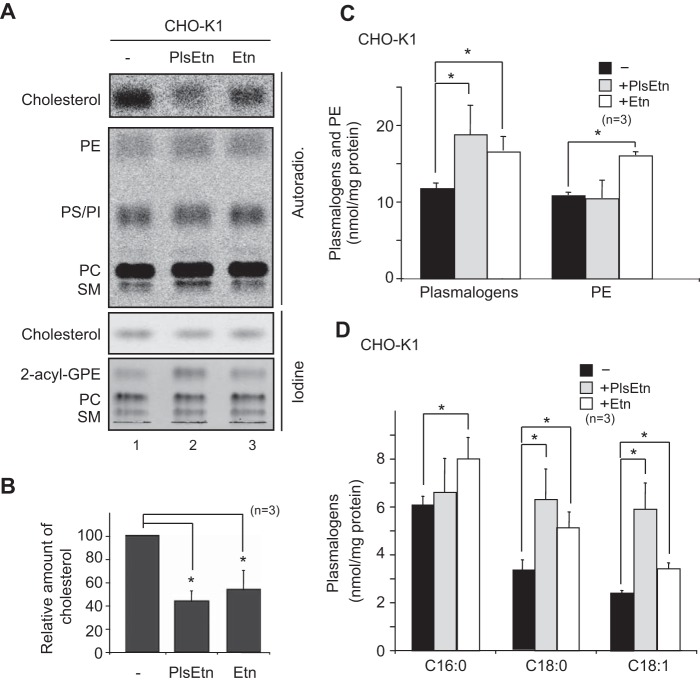
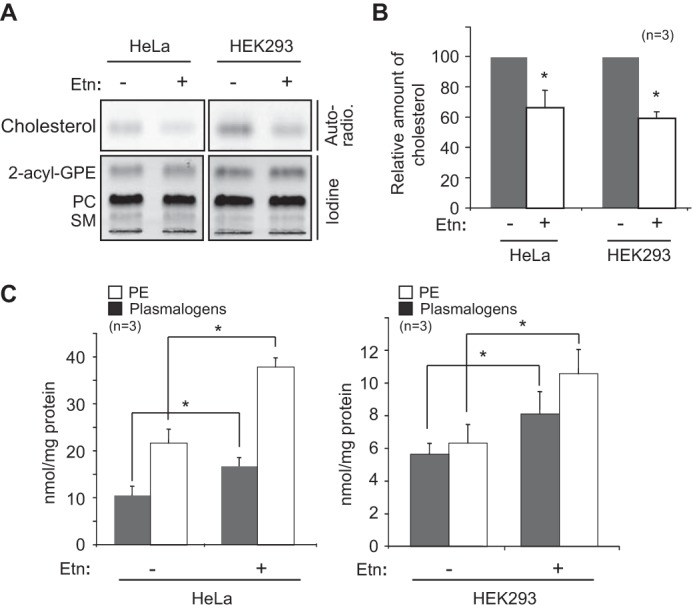
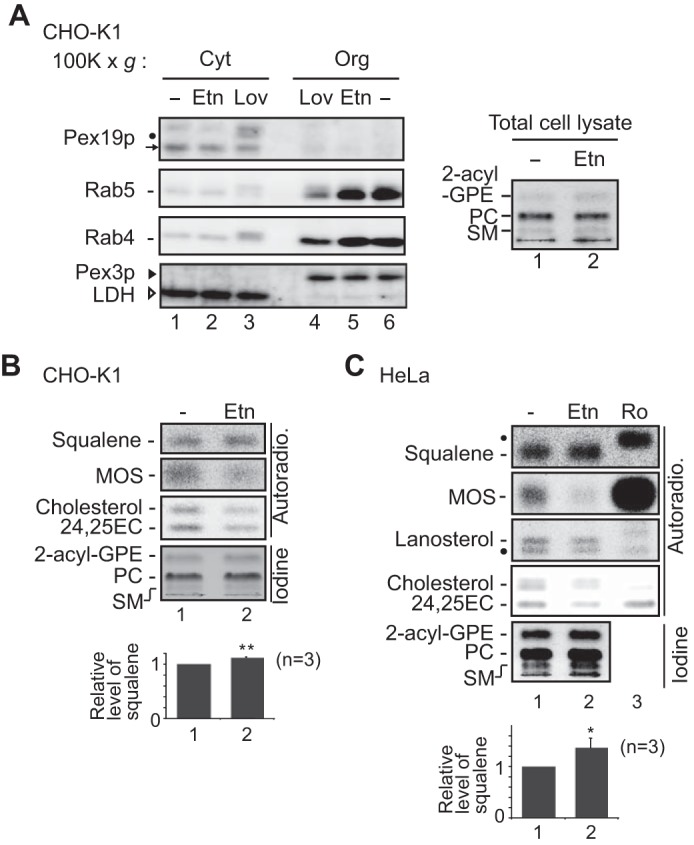
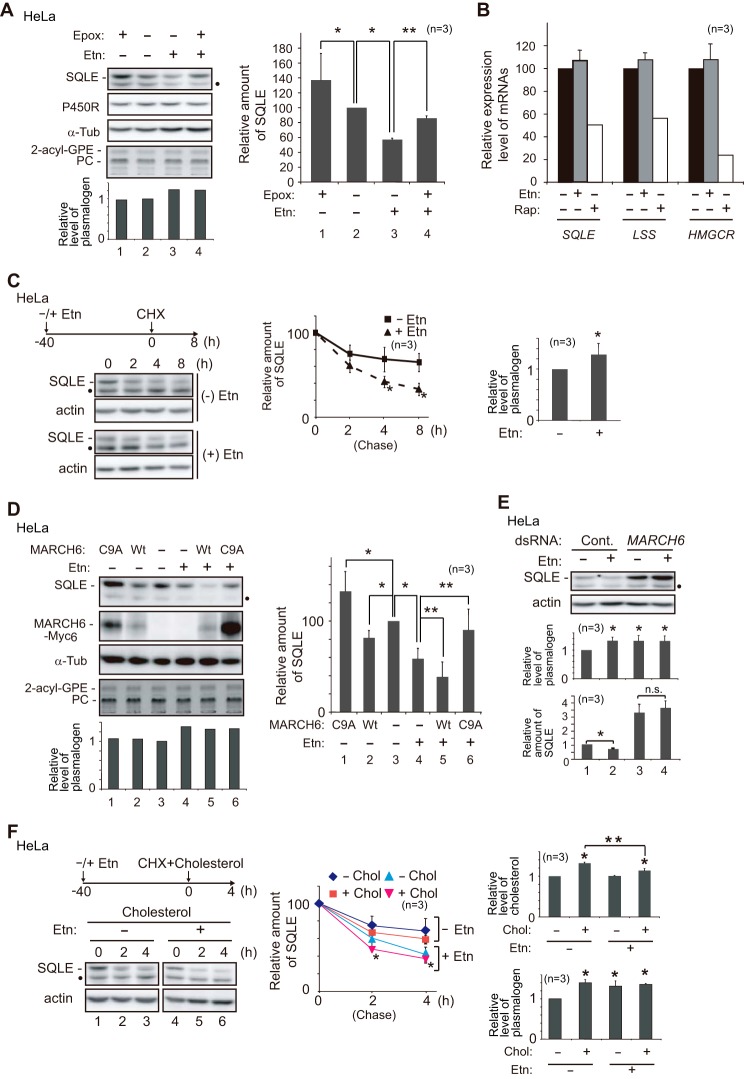
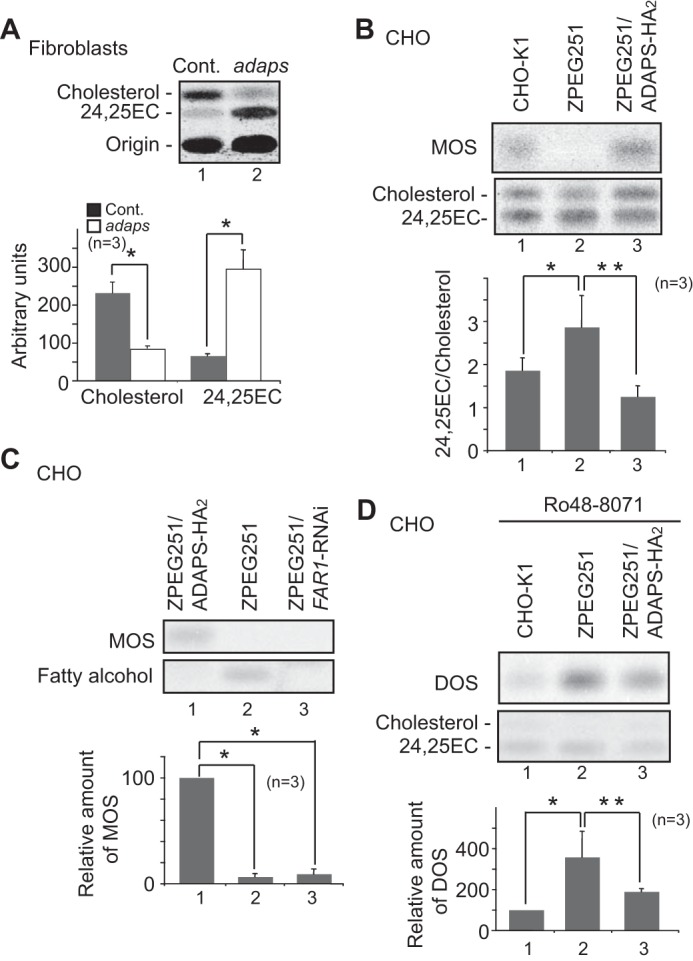
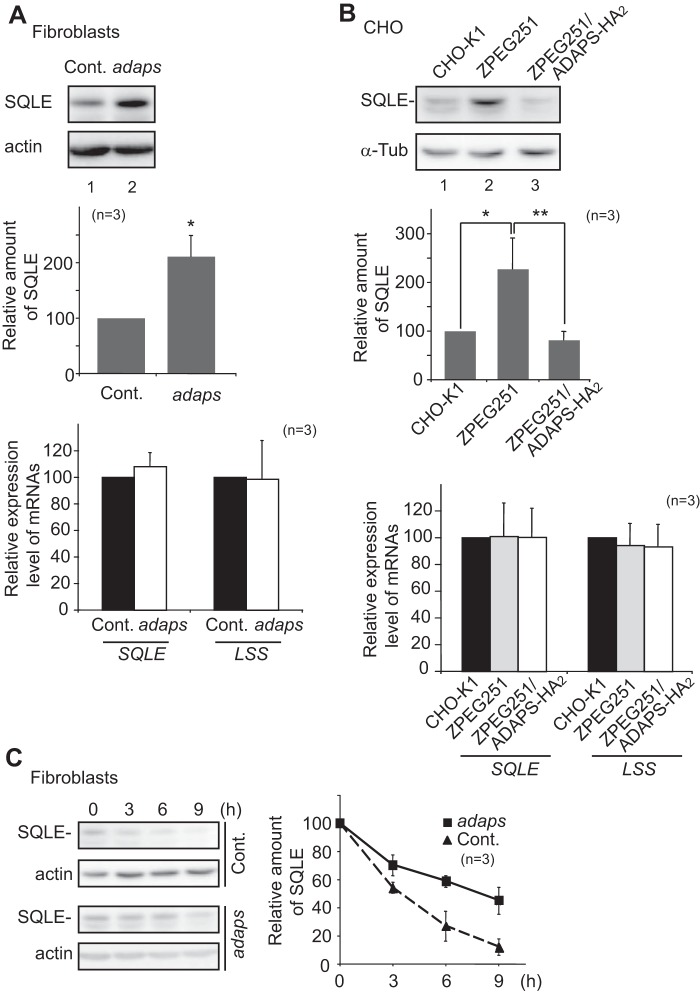
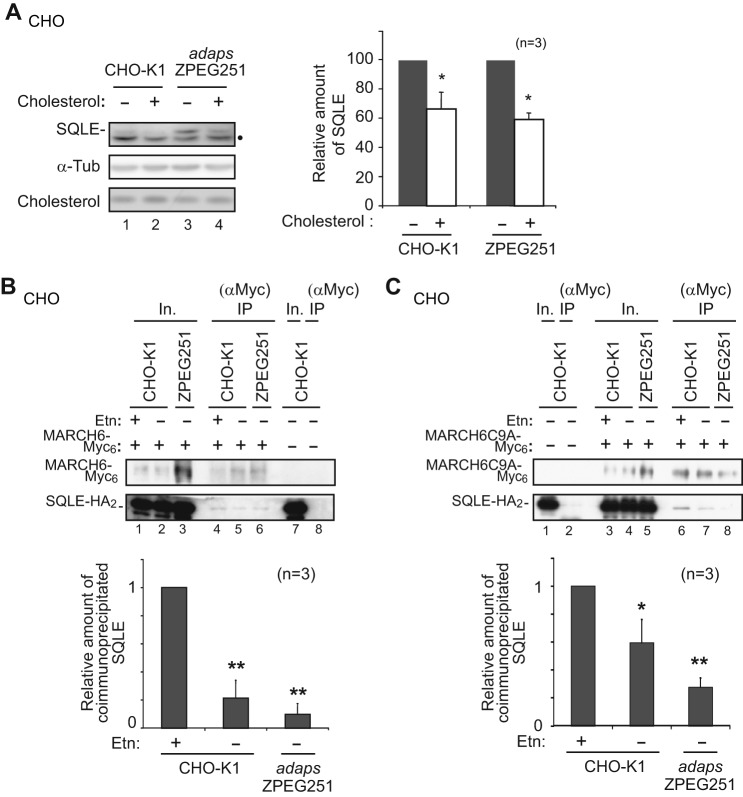
Plasmalogen biosynthesis is regulated by modulating fatty acyl-CoA reductase 1 stability in a manner dependent on cellular plasmalogen level. However, physiological significance of the regulation of plasmalogen biosynthesis remains unknown. Here we show that elevation of the cellular plasmalogen level reduces cholesterol biosynthesis without affecting the isoprenylation of proteins such as Rab and Pex19p. Analysis of intermediate metabolites in cholesterol biosynthesis suggests that the first oxidative step in cholesterol biosynthesis catalyzed by squalene monooxygenase (SQLE), an important regulator downstream HMG-CoA reductase in cholesterol synthesis, is reduced by degradation of SQLE upon elevation of cellular plasmalogen level. By contrast, the defect of plasmalogen synthesis causes elevation of SQLE expression, resulting in the reduction of 2,3-epoxysqualene required for cholesterol synthesis, hence implying a novel physiological consequence of the regulation of plasmalogen biosynthesis.

Keywords: cell metabolism; cholesterol; endoplasmic reticulum (ER); peroxisome; plasmalogen; squalen; squalene monooxygenase.


Figures

FIGURE 1.
FIGURE 1.
Elevation of cellular plasmalogens level lowers cholesterol synthesis. A, CHO-K1 cells were cultured for 43 h in the absence (−) or presence of purified plasmalogens (PlsEtn) from bovine brain or Etn, and further incubated for 5 h with [14C]acetate. The biosynthesis of lipids including cholesterol (upper panel) and phospholipids (upper middle panel) were detected with a FLA-5000 imaging analyzer. Cellular levels of cholesterol (lower middle panel), plasmalogens (2-acyl-GPE), phosphatidylcholine (PC), and sphingomyelin (SM) were detected (lower panel) with iodine vapor. Note that biosynthesis of cholesterol is reduced in cells cultured in the presence of PlsEtn or Etn (lanes 2 and 3), as compared with that under the normal culture condition (lane 1). PE, phosphatidylethanolamine; PS, phosphatidylserine; PI, phosphatidylinositol. B, relative levels of newly synthesized cholesterol are shown, where the level of cholesterol synthesis in CHO-K1 (−) was designated as 100. *, p < 0.05; Student's t test compared with CHO-K1 (−). C, lipids were extracted from CHO-K1 cells cultured as described in A and analyzed by LC-ESI-MS/MS. Total amounts of plasmalogens (left panel) and PE (right panel) from cells cultured in the absence (−, solid bar) or presence (+) of PlsEtn (gray bar) or Etn (open bar) were shown. *, p < 0.01; t test versus CHO-K1 (−). D, lipids were extracted as described in A. Total amounts of plasmalogens with alkenyl 16:0 (left panel), 18:0 (middle panel), and 18:1 (right panel) at the sn-1 position are shown. *, p < 0.05; t test versus CHO-K1.
FIGURE 2.
FIGURE 2.
Elevation of plasmalogens causes reduction of cholesterol synthesis in cell lines. A, HeLa and HEK293 cells were cultured for 48 h in the absence (−) or presence (+) of 5 or 2 μm Etn, respectively. Cells were metabolically labeled with [14C]palmitate for the last 5 h during this treatment. Biosynthesis of cholesterol (upper panel) and the level of 2-acyl-GPE (lower panel) are shown. B, synthesis of cholesterol in HeLa and HEK293 cells upon elevation of plasmalogens (open bar) is represented by taking those as 100 in mock-treated respective cells (solid bar). *, p < 0.05; t test versus a control. C, total amounts of plasmalogens (solid bar) and phosphatidylethanolamine (PE) (open bar) in HeLa (left panel) and HEK293 (right panel) cells cultured in the presence (+) or absence (−) of Etn are shown. In HeLa cells, *, p < 0.01; t test versus a control. In HEK293 cells, *, p < 0.05; t test versus a control.
FIGURE 3.
FIGURE 3.
Elevation of cellular plasmalogens suppresses the post-squalene pathway in cholesterol synthesis. A, CHO-K1 cells were cultured for 48 h with Etn (lanes 2 and 5) or treated with 10 μm lovastatin (Lov) for 5 h (lanes 3 and 4) and prepared cytosolic (Cyt) and organelle (Org) fractions. Farnesylation of Pex19p and geranylgeranylation of Rab4 and Rab5 were verified by immunoblotting with the respective antibodies. Pex3p and lactate dehydrogenase (LDH) were used for the control of fractionation. Farnesylated and unmodified Pex19p were indicated by the arrow and closed circle, respectively. Unmodified Rab4 and Rab5 were detected as a slightly slower migrating band in cytosol fractions (lane 3). Increment of plasmalogens by addition of Etn was confirmed by TLC analysis (right panel). Lanes 1 and 6, mock-treated CHO-K1 cells. B, CHO-K1 cells were cultured in the absence (lane 1) or presence (lane 2) of Etn for 43 h and further incubated with [14C]acetate for 5 h. Lipids were extracted and separated on TLC as described under “Experimental Procedures.” Squalene, MOS, cholesterol, and 24,25-EC were detected by a FLA-5000 imaging analyzer. Cellular plasmalogens (lower panel) were detected by exposing to iodine vapor. Synthesis of squalene is represented by taking as 1 that in CHO-K1 cells (lower panel. *, p < 0.05; t test versus untreated-CHO-K1 cells. C, HeLa cells were cultured for 2 h in the presence of 20 μm Ro48-8071 (Ro), an inhibitor of lanosterol synthase, or cultured for 43 h in the absence (lane 1) or presence of Etn (lane 2), and incubated for another 5 h for metabolic labeling with [14C]acetate in the presence (lane 3) or absence (lanes 1 and 2) of Ro48-8071. Lipids were extracted and analyzed as in B. Dot indicates an unidentified lipid. Synthesis of squalene is represented by taking as 1 that in HeLa cells (lower panel). *, p < 0.05; t test versus untreated-HeLa cells.
FIGURE 4.
FIGURE 4.
Increase in cellular plasmalogens reduces the levels of SQLE. A, left panel, HeLa cells were cultured with Etn (lanes 3 and 4) for 43 h and further cultured for 5 h in the presence (lanes 1 and 4) or absence (lanes 2 and 3) of 10 μm epoxomicin (Epox), an inhibitor of proteasome. Expression level of SQLE, P450 reductase (P450R), and α-tubulin (α-Tub) was assessed by immunoblotting with antibodies as indicated on the left. Cellular plasmalogens were detected with iodine vapor (lower panel) and LC-ESI-MS/MS (lower graph), respectively. The relative plasmalogen levels was represented by taking as 1 that in mock-treated HeLa cells. Dot indicates a truncated form of SQLE (12, 75). Right panel, relative expression level of SQLE was represented by taking as 100 that in mock-treated HeLa cells. *, p < 0.01; t test versus a control; **, p < 0.01: t test versus Etn. B, HeLa cells were cultured in the absence (solid bar) or presence of Etn (gray bar) for 48 h or 50 nm rapamycin, an inhibitor for mammalian target of rapamycin (mTOR) (open bar) for 18 h. Expression levels of SQLE, LSS, and HMGCR relative to RPL3 mRNA were determined by real-time PCR using total RNA. Relative expression levels of SQLE, LSS, and HMGCR are represented by taking those as 100 in mock-treated cells (n = 3). Analysis of the expression level of the respective mRNAs in the presence of rapamycin was performed (n = 1). C, left panel, HeLa cells were cultured in the absence (upper panel) or presence (lower panel) of Etn for 40 h and further incubated for 8 h in the presence of cycloheximide (CHX, 100 μg/ml) and assessed for the expression of SQLE at each time point. Middle panel, SQLE bands at each time point were quantified. Relative amounts of SQLE in the absence (square) or presence (triangle) of Etn at each time point were represented by taking as 100 that at the time point of cycloheximide addition. *, p < 0.05; t test versus SQLE level at the same time in the absence of Etn. Right panel, cellular plasmalogens were detected by LC-ESI-MS/MS and relative plasmalogen levels at the time point of cycloheximide addition were shown. *, p < 0.05; t test versus a control. Dot indicates a truncated form of SQLE. D, left panel, HeLa cells transfected with mock vector (−), an E3 ligase, MARCH9-Myc6(Wt), or a MARCH mutant, MARCH6C9A-Myc6 (C9A) were divided into two dishes and cultured for 2 days in the absence (−) or presence (+) of Etn. Expression level of SQLE, MARCH6, and tubulin and plasmalogen levels were analyzed as in A. Dot indicates a truncated form of SQLE. Right panel, the relative expression level of SQLE was represented by taking as 100 that in mock-treated HeLa cells. *, p < 0.05; t test versus a control, **, p < 0.05: t test versus Etn without MARCH6 expression. PC, phosphatidylcholine. E, HeLa cells treated with either control or dsRNA against MARCH6 were cultured for 48 h in the presence (+) or absence (−) of Etn. The expression levels of SQLE and actin were assessed by immunoblotting with specific antibodies as indicated on the left (upper panel). Dot indicates a truncated form of SQLE. Cellular plasmalogens were detected as in A and relative plasmalogen levels were represented by taking as 1 that in control dsRNA-treated HeLa cells (middle panel). The relative expression level of SQLE (lower panel) was represented by taking as 1 that in control dsRNA-treated HeLa cells (lane 1). *, p < 0.05; t test versus a control dsRNA-treated HeLa cells. n.s., not significant. F, left panel, HeLa cells were cultured as described in C, except that the cells were further incubated for 4 h in the presence of cycloheximide (CHX, 100 μg/ml) plus cholesterol (Chol) (20 μg/ml). The cells were assessed for the level of SQLE at each time point. Dot indicates a truncated form of SQLE. Middle panel, relative amounts of SQLE in the absence (square) or presence (red triangle) of Etn at each time point were represented by taking as 100 that at the time point of cycloheximide and cholesterol addition (+Chol). The relative expression level of SQLE in the absence (diamond) or presence (blue triangle) of Etn without adding cholesterol (−Chol) was obtained from C. *, p < 0.05; t test versus SQLE level at the same time point indicated by a square. Right panel, cellular cholesterol (upper panel) and plasmalogens (lower panel) were determined by the enzymatic method and LC-ESI-MS/MS, respectively. Relative cholesterol levels at the time point of cycloheximide addition and after culturing for 4 h in the presence of cholesterol were represented by taking 1 that in HeLa cells at the time point of cycloheximide addition. Plasmalogen level was likewise represented. *, p < 0.05; t test versus a control. **, p < 0.05; t test versus cholesterol loading-HeLa cells.
FIGURE 5.
FIGURE 5.
Synthesis of sterols in plasmalogen-deficient cells. A, fibroblasts derived from a healthy control (Cont.) and a patient defective in ADAPS (adaps) were metabolically labeled for 5 h with [14C]acetate and assessed for sterol synthesis. Origin indicates the spots where the extracted lipids were placed on TLC (upper panel). Synthesis levels of 24,25-EC and cholesterol in control (solid bar) and adaps-deficient (open bar) fibroblasts were shown (lower panel). *, p < 0.01; t test versus control fibroblasts. B, synthesis of MOS (upper panel) and sterols (middle panel) in CHO-K1, adaps ZPEG251, and ZPEG251/ADAPS-HA2 were analyzed. Note that synthesis of cholesterol and MOS was specifically abrogated in ZPEG251. The ratio of 24,25-EC to cholesterol is presented (lower panel). *, p < 0.01; t test versus CHO-K1. **, p < 0.01; t test versus ZPEG251. C, ZPEG251/ADAPS-HA2, ZPEG251, and ZPEG251 that had been treated with double-strand RNA against FAR1 were metabolically labeled with [14C]acetate and analyzed by autoradiography for synthesis of MOS (upper panel) and accumulation of fatty alcohol (middle panel). Relative amount MOS was represented by taking as 100 that in ZPEG251/ADAPS-HA2 (lower panel). *, p < 0.01; t test versus ZPEG251/ADAPS-HA2. D, CHO-K1, ZPEG251, and ZPEG251/ADAPS-HA2 were treated with 20 μm Ro48-8071 for 2 h and metabolically labeled with [14C]acetate in the presence of the inhibitor. Synthesis of DOS (upper panel) and sterols (middle panel) was analyzed. Relative amount of DOS was represented by taking as 100 that in CHO-K1 (lower panel). *, p < 0.01; t test versus CHO-K1. **, p < 0.01; t test versus ZPEG251.
FIGURE 6.
FIGURE 6.
Expression level of SQLE is elevated in the absence of plasmalogens. A, expression level of SQLE was assessed by immunoblotting in fibroblasts derived from a control (Cont.) and a patient defective in ADAPS (adaps) (upper panel). Actin was used as a loading control. Relative expression levels of SQLE were represented by taking as 100 that in control fibroblasts (middle panel). *, p < 0.05; t test versus control. Transcription levels of SQLE and LSS in control (Cont., solid bar) and ADAPS-defective fibroblasts (adaps, open bar) were assessed by real-time PCR (lower panel). Relative expression levels of SQLE and LSS are represented by taking that as 100 in control fibroblasts. B, expression level of SQLE was assessed as in A in CHO-K1, ZPEG251, and ZPEG251/ADAPS-HA2 (upper panel). Tubulin (α-Tub) was used as a loading control. The relative expression level of SQLE was represented by taking as 100 that in CHO-K1 (middle panel). *, p < 0.01; t test versus CHO-K1. **, p < 0.01; t test versus ZPEG251. Relative expression levels of SQLE and LSS to the housekeeping gene PBGD (porphobilinogen deaminase) (12, 23) was analyzed by real-time PCR using total RNA prepared from CHO-K1 (solid bar), adaps ZPEG251 (gray bar), and ZPEG251/ADAPS-HA2 (open bar) (lower panel). Relative expression levels of SQLE and LSS are represented by taking that as 100 in CHO-K1 cells (n = 3). C, SQLE is more stable in adaps fibroblasts. Control (Cont.) and ADAPS-defective (adaps) fibroblasts were cultured for 9 h in the presence of cycloheximide (100 μg/ml) and assessed for the expression level of SQLE at each time point (left panel). Relative amounts of SQLE in control (triangle) and ADAPS-defective (square) fibroblasts at each time point were represented by taking as 100 that at the time point of cycloheximide addition (right panel).
FIGURE 7.
FIGURE 7.
Plasmalogens modulate the interaction of SQLE with MARCH6. A, CHO-K1 and adaps ZPEG251 were cultured for 16 h in the presence of cholesterol (20 μg/ml) and assessed for the expression level of SQLE by immunoblotting (left panel). Tubulin (α-Tub) was used as a loading control. Dot indicates a truncated form of SQLE. Cellular free cholesterol was detected with iodine vapor (left lower panel) and by the enzymatic method (Table 1). Right panel, relative amount of full-length SQLE upon elevation of cholesterol (open bar) is represented by taking those as 100 in mock-treated respective cells (solid bar). *, p < 0.05; t test versus respective cells cultured in the absence of cholesterol. B, upper panel, SQLE-HA2 was coexpressed with mock vector (lanes 7 and 8) or MARCH6-Myc6 (lanes 1–6) in CHO-K1 (lanes 1, 2, 4, 5, 7, and 8) or adaps ZPEG251 (lanes 3 and 6), cultured for 43 h in the presence (lanes 1 and 4) or absence (lanes 2, 3, and 5–8) of Etn, and further cultured for 5 h in the presence of 10 μm epoxomycin. Cell lysates were subjected to coimmunoprecipitation (IP) using rabbit anti-Myc antibody as indicated at the top. MARCH6-Myc6 and SQLE-HA2 were detected with monoclonal antibodies to Myc and HA tags, respectively. Input (In.), 1% of cell lysates used for immunoprecipitation. Lower panel, coimmunoprecipitation of MARCH6-Myc6 with SQLE-HA2 was assessed and represented as a ratio of SQLE-HA2 versus MARCH6-Myc6 by taking as 1 that in CHO-K1 treated with Etn. **, p < 0.01; t test versus Etn. C, upper panel, SQLE-HA2 was coexpressed with mock vector (lanes 1 and 2) or MARCH6C9A-Myc6 (lanes 3–8) in CHO-K1 (lanes 1–4, 6, and 7) and adaps ZPEG251 (lanes 5 and 8), and cultured for 2 days in the presence (lanes 3 and 6) or absence (lanes 1, 2, 4, 5, 7, and 8) of Etn. Input (In.), 1% of cell lysates used for immunoprecipitation. Lower panel, interaction of MARCH6C9A-Myc6 with SQLE-HA2 was verified as in B. *, p < 0.05; t test versus Etn. **, p < 0.01; t test versus Etn.

Similar articles

Cited by

References

    1. Steinberg S. J., Dodt G., Raymond G. V., Braverman N. E., Moser A. B., and Moser H. W. (2006) Peroxisome biogenesis disorders. Biochim. Biophys. Acta 1763, 1733–1748 - PubMed
    1. Braverman N. E., and Moser A. B. (2012) Functions of plasmalogen lipids in health and disease. Biochim. Biophys. Acta 1822, 1442–1452 - PubMed
    1. Munn N. J., Arnio E., Liu D., Zoeller R. A., and Liscum L. (2003) Deficiency in ethanolamine plasmalogen leads to altered cholesterol transport. J. Lipid Res. 44, 182–192 - PubMed
    1. Teigler A., Komljenovic D., Draguhn A., Gorgas K., and Just W. W. (2009) Defects in myelination, paranode organization and Purkinje cell innervation in the ether lipid-deficient mouse cerebellum. Hum. Mol. Genet. 18, 1897–1908 - PMC - PubMed
    1. Cheng J. B., and Russell D. W. (2004) Mammalian wax biosynthesis. I. identification of two fatty acyl-coenzyme a reductases with different substrate specificities and tissue distributions. J. Biol. Chem. 279, 37789–37797 - PMC - PubMed

Publication types

MeSH terms