

Growth differentiation factor 15 as a useful biomarker for mitochondrial disorders
- PMID: 26463265
- PMCID: PMC5057301
- DOI: 10.1002/ana.24506
Growth differentiation factor 15 as a useful biomarker for mitochondrial disorders
Abstract
Objective: The diagnosis of mitochondrial disorders (MDs) is occasionally difficult because patients often present with solitary, or a combination of, symptoms caused by each organ insufficiency, which may be the result of respiratory chain enzyme deficiency. Growth differentiation factor 15 (GDF-15) has been reported to be elevated in serum of patients with MDs. In this study, we investigated whether GDF-15 is a more useful biomarker for MDs than several conventional biomarkers.
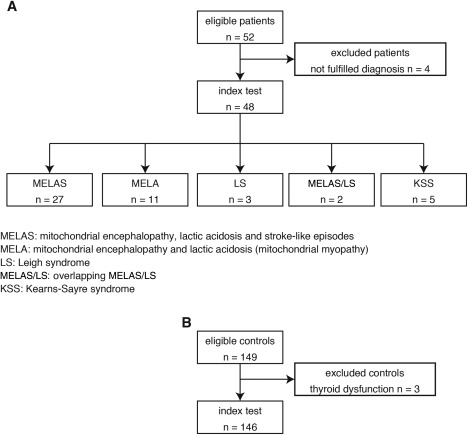
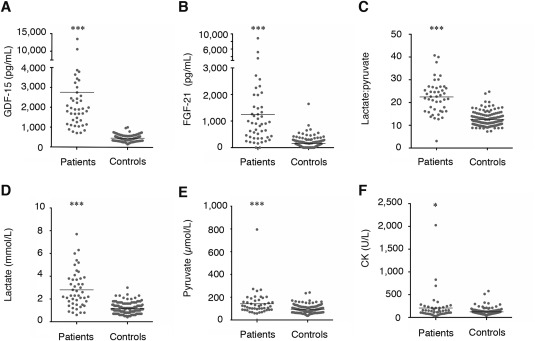
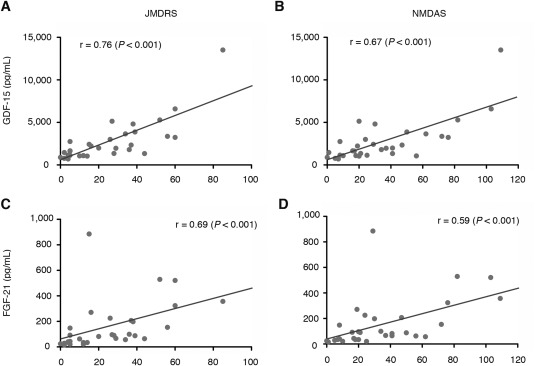
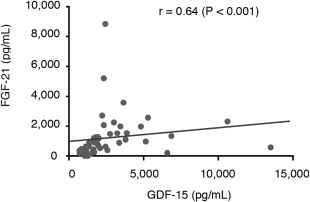
Methods: We measured the serum levels of GDF-15 and fibroblast growth factor 21 (FGF-21), as well as other biomarkers, in 48 MD patients and in 146 healthy controls in Japan. GDF-15 and FGF-21 concentrations were measured by enzyme-linked immunosorbant assay and compared with lactate, pyruvate, creatine kinase, and the lactate-to-pyruvate ratio. We calculated sensitivity and specificity and also evaluated the correlation based on two rating scales, including the Newcastle Mitochondrial Disease Rating Scale (NMDAS).
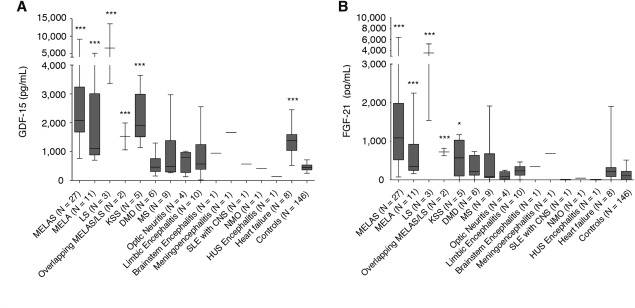
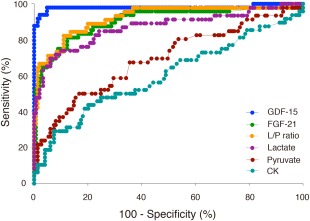
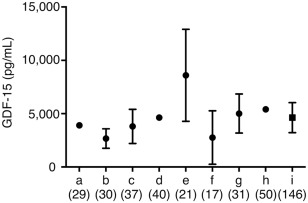
Results: Mean GDF-15 concentration was 6-fold higher in MD patients compared to healthy controls (2,711 ± 2,459 pg/ml vs 462.5 ± 141.0 pg/mL; p < 0.001). Using a receiver operating characteristic curve, the area under the curve was significantly higher for GDF-15 than FGF-21 and other conventional biomarkers. Our date suggest that GDF-15 is the most useful biomarker for MDs of the biomarkers examined, and it is associated with MD severity.
Interpretation: Our results suggest that measurement of GDF-15 is the most useful first-line test to indicate the patients who have the mitochondrial respiratory chain deficiency.
© 2015 The Authors Annals of Neurology published by Wiley Periodicals, Inc. on behalf of American Neurological Association.
Figures
Similar articles
-
A comparison of current serum biomarkers as diagnostic indicators of mitochondrial diseases.Neurology. 2016 May 24;86(21):2010-5. doi: 10.1212/WNL.0000000000002705. Epub 2016 Apr 27. Neurology. 2016. PMID: 27164684 Free PMC article.
-
GDF-15 Is Elevated in Children with Mitochondrial Diseases and Is Induced by Mitochondrial Dysfunction.PLoS One. 2016 Feb 11;11(2):e0148709. doi: 10.1371/journal.pone.0148709. eCollection 2016. PLoS One. 2016. PMID: 26867126 Free PMC article.
-
The Mitochondrial Biomarkers FGF-21 and GDF-15 in Patients with Episodic and Chronic Migraine.Cells. 2021 Sep 18;10(9):2471. doi: 10.3390/cells10092471. Cells. 2021. PMID: 34572118 Free PMC article.
-
FGF-21 as a Potential Biomarker for Mitochondrial Diseases.Curr Med Chem. 2018;25(18):2070-2081. doi: 10.2174/0929867325666180111094336. Curr Med Chem. 2018. PMID: 29332568 Review.
-
Biomarkers for mitochondrial energy metabolism diseases.Essays Biochem. 2018 Jul 20;62(3):443-454. doi: 10.1042/EBC20170111. Print 2018 Jul 20. Essays Biochem. 2018. PMID: 29980631 Review.
Cited by
-
Adaptation to mitochondrial stress requires CHOP-directed tuning of ISR.Sci Adv. 2021 May 26;7(22):eabf0971. doi: 10.1126/sciadv.abf0971. Print 2021 May. Sci Adv. 2021. PMID: 34039602 Free PMC article.
-
Plasma GDF-15 concentration is not elevated in open-angle glaucoma.PLoS One. 2021 May 28;16(5):e0252630. doi: 10.1371/journal.pone.0252630. eCollection 2021. PLoS One. 2021. PMID: 34048486 Free PMC article.
-
Dynamic derangement in amino acid profile during and after a stroke-like episode in adult-onset mitochondrial disease: a case report.J Med Case Rep. 2019 Oct 21;13(1):313. doi: 10.1186/s13256-019-2255-9. J Med Case Rep. 2019. PMID: 31630688 Free PMC article.
-
Late-onset thymidine kinase 2 deficiency: a review of 18 cases.Orphanet J Rare Dis. 2019 May 6;14(1):100. doi: 10.1186/s13023-019-1071-z. Orphanet J Rare Dis. 2019. PMID: 31060578 Free PMC article.
-
Further Evidence of Accelerated Aging in Bipolar Disorder: Focus on GDF-15.Transl Neurosci. 2018 Mar 23;9:17-21. doi: 10.1515/tnsci-2018-0004. eCollection 2018. Transl Neurosci. 2018. PMID: 29607212 Free PMC article.
References
-
- Haas RH, Parikh S, Falk MJ, et al. Mitochondrial disease: a practical approach for primary care physicians. Pediatrics 2007;120:1326–1333. - PubMed
-
- Munnich A, Rotig A, Chretien D, et al. Clinical presentation of mitochondrial disorders in childhood. J Inherit Metab Dis 1996;19:521–527. - PubMed
-
- Davis RL, Liang C, Edema‐Hildebrand F, et al. Fibroblast growth factor 21 is a sensitive biomarker of mitochondrial disease. Neurology 2013;81:1819–1826. - PubMed
-
- Liang C, Ahmad K, Sue CM. The broadening spectrum of mitochondrial disease: shifts in the diagnostic paradigm. Biochim Biophys Acta 2014;1840:1360–1367. - PubMed
Publication types
MeSH terms
Substances
LinkOut - more resources
Full Text Sources
Other Literature Sources
Medical
Molecular Biology Databases
Research Materials
Miscellaneous
