Review
. 2016 Dec;22(6):579-592.
doi: 10.1177/1073858415610541. Epub 2015 Oct 13.

Building an RNA Sequencing Transcriptome of the Central Nervous System

Affiliations
Review

Building an RNA Sequencing Transcriptome of the Central Nervous System

Xiaomin Dong et al. Neuroscientist. 2016 Dec.

Abstract

The composition and function of the central nervous system (CNS) is extremely complex. In addition to hundreds of subtypes of neurons, other cell types, including glia (astrocytes, oligodendrocytes, and microglia) and vascular cells (endothelial cells and pericytes) also play important roles in CNS function. Such heterogeneity makes the study of gene transcription in CNS challenging. Transcriptomic studies, namely the analyses of the expression levels and structures of all genes, are essential for interpreting the functional elements and understanding the molecular constituents of the CNS. Microarray has been a predominant method for large-scale gene expression profiling in the past. However, RNA-sequencing (RNA-Seq) technology developed in recent years has many advantages over microarrays, and has enabled building more quantitative, accurate, and comprehensive transcriptomes of the CNS and other systems. The discovery of novel genes, diverse alternative splicing events, and noncoding RNAs has remarkably expanded the complexity of gene expression profiles and will help us to understand intricate neural circuits. Here, we discuss the procedures and advantages of RNA-Seq technology in mammalian CNS transcriptome construction, and review the approaches of sample collection as well as recent progress in building RNA-Seq-based transcriptomes from tissue samples and specific cell types.

Keywords: RNA-sequencing; alternative splicing; central nervous system; gene expression; noncoding RNA; transcriptome complexity.


Conflict of interest statement

Declaration of Conflicting Interests The author(s) declared no potential conflict of interest with respect to the research, authorship, and/or publication of this article.

Figures

Figure 1
Figure 1
Comparison of RNA-Seq and microarray analyses of differentially expressed genes across eight neural cell types. (A) High Spearman’s rank correlations between gene expression data from RNA-Seq and microarray platforms was observed across different cell types. (B–E) Comparing differentially expressed genes identified by RNA-Seq and microarray in astrocytes, neurons, oligodendrocytes, and microglia. Adapted from Zhang and others (2014) with permission and modifications.
Figure 2
Figure 2
Different approaches for reducing cellular heterogeneity for CNS transcriptome characterization.
Figure 3
Figure 3
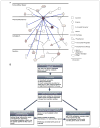
A systems-based analysis framework for identifying potentially crucial genes in the global gene network. (A) A schematic diagram of gene expression network. The connected edges of a potentially key gene are highlighted in blue. (B) The workflow for the analysis framework in identifying potentially important genes. Adapted from Chen and others (2013) with permission and modifications.
Figure 4
Figure 4
Validation of cell-type enriched genes from RNA-Seq results by qRT-PCR and in situ hybridization. (A) 34 of the selected 40 newly identified cell-type enriched genes were validated by qRT-PCR using Fluidigm BioMark microfluidic technology. Warmer colors represent higher abundance transcripts, and cooler colors represent lower abundance transcripts. Black indicates no amplification. (B) Fold enrichment plots for Atp13a4, Cpne7, Fam70b, Tmem88b, and Rcsd1 compared to housekeeping gene Gapdh. (C–G) In situ hybridization showing the colocalization of novel cell-type specific genes with classical cell markers. Left, image of the cortex and hippocampus at low magnification. Scale bar, 200 μm. Right, image of the cortex at high magnification. Scale bar, 50 μm. Adapted from Zhang and others (2014) with permission and modifications.
Figure 5
Figure 5
Tissue– or cell-type–specific regulation of cassette exons. (A) Comparison of cell-type–specific known and novel cassette exons across different cell types. MO, myelinating oligodendrocyte; NFO, newly formed oligodendrocyte; OPC, oligodendrocyte precursor cells. (B) RNA map correlating Rbfox binding position with Rbfox-dependent neuron-specific exon inclusion (red) and exclusion (blue). (C) The number of known and novel cassette exons in which splicing was changed by conditional depletion of Ptbp2. (D) An RNA map correlating Ptbp2 binding position with Ptbp2-dependent exon inclusion (red) and exclusion (blue). Adapted from Yan and others (2015) with permission and modifications.
Figure 6
Figure 6
(A) Sequence traces of cell-type specific expression of PKM1 and PKM2 transcripts. The blue exon in neurons and yellow exons in astrocytes are mutually exclusive. (B) Confirmation of cell-type specific expression of PKM1 and PKM2 transcripts by PCR using primers targeting exons unique to PKM1, unique to PKM2, and common exons. Adapted from Zhang and others (2014) with permission and modifications.
Figure 7
Figure 7
Brain Cell RNA-Seq browser (http://jiaqianwulab.org/resource.htm). Sequence traces are shown for various brain cell classes. An example of alternatively spliced exons is surrounded by a dotted line.

References

    1. Bareyre FM, Schwab ME. Inflammation, degeneration and regeneration in the injured spinal cord: insights from DNA microarrays. Trends Neurosci. 2003;26(10):555–63. - PubMed
    1. Barres BA, Hart IK, Coles HS, Burne JF, Voyvodic JT, Richardson WD, et al. Cell death and control of cell survival in the oligodendrocyte lineage. Cell. 1992;70(1):31–46. - PubMed
    1. Birney E, Stamatoyannopoulos JA, Dutta A, Guigo R, Gingeras TR, Margulies EH, et al. Identification and analysis of functional elements in 1% of the human genome by the ENCODE pilot project. Nature. 2007;447(7146):799–816. - PMC - PubMed
    1. Brazma A, Hingamp P, Quackenbush J, Sherlock G, Spellman P, Stoeckert C, et al. Minimum information about a microarray experiment (MIAME)—toward standards for microarray data. Nat Genet. 2001;29(4):365–71. - PubMed
    1. Cabili MN, Trapnell C, Goff L, Koziol M, Tazon-Vega B, Regev A, et al. Integrative annotation of human large intergenic noncoding RNAs reveals global properties and specific subclasses. Genes Dev. 2011;25:1915–27. - PMC - PubMed

Publication types