. 2016 Jan;4(1):61-71.
doi: 10.1158/2326-6066.CIR-15-0055. Epub 2015 Oct 13.

T-cell Exhaustion in Multiple Myeloma Relapse after Autotransplant: Optimal Timing of Immunotherapy

Affiliations

T-cell Exhaustion in Multiple Myeloma Relapse after Autotransplant: Optimal Timing of Immunotherapy

David J Chung et al. Cancer Immunol Res. 2016 Jan.

Abstract

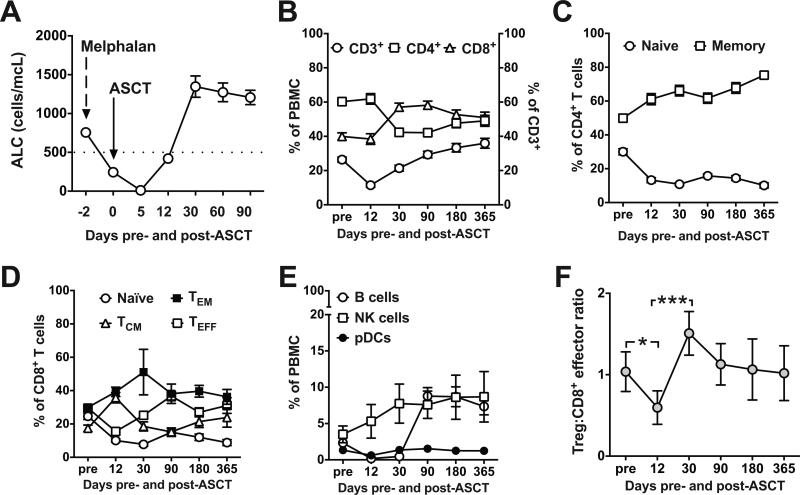
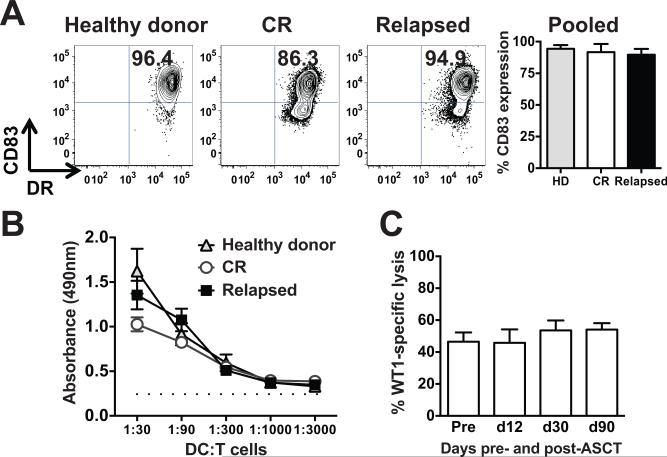
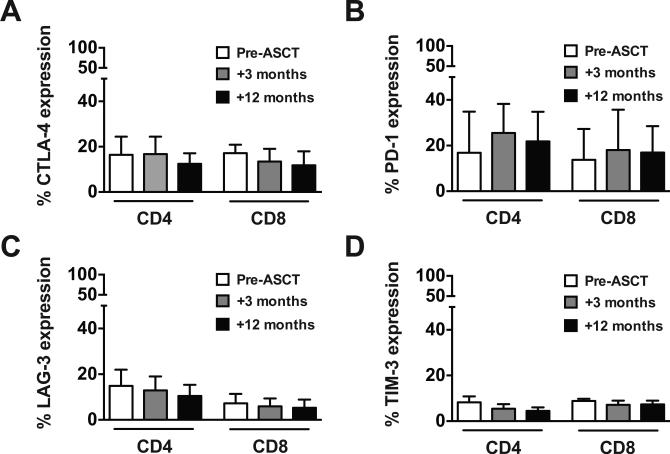
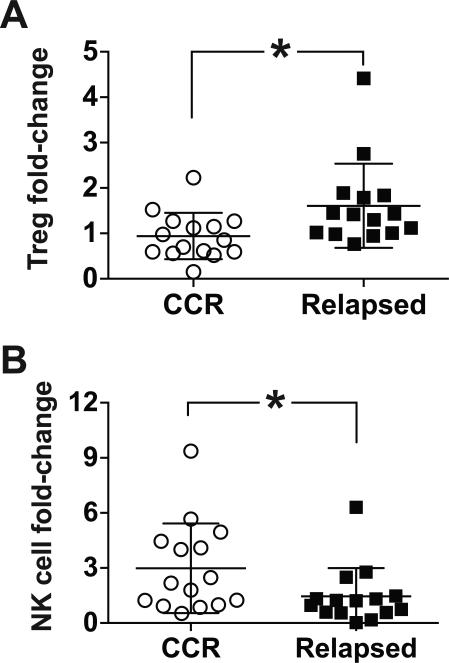
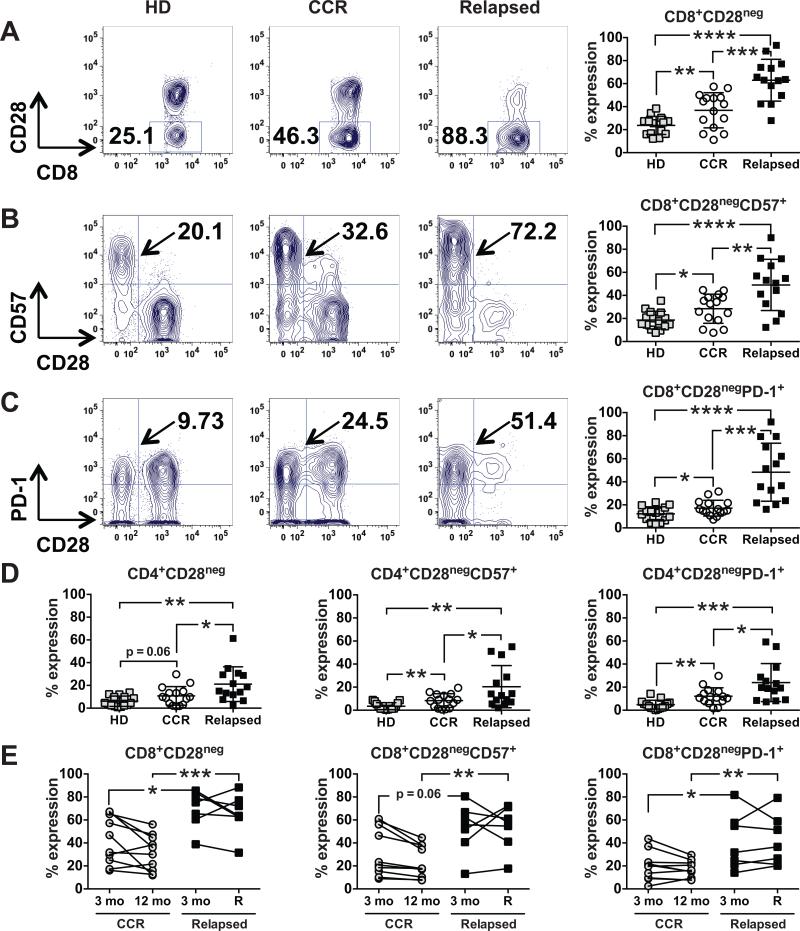
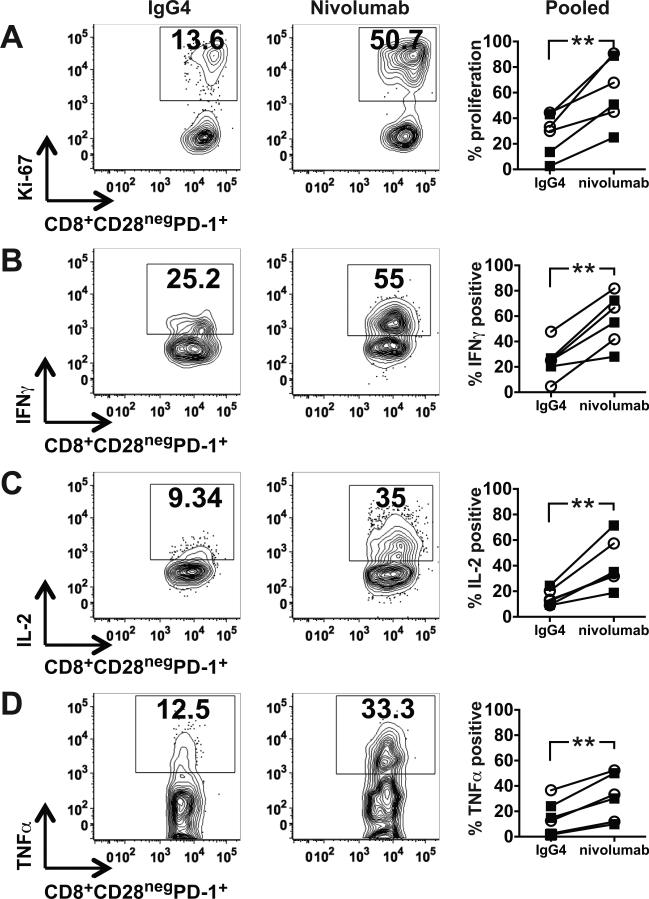
Multiple myeloma is the most common indication for high-dose chemotherapy and autologous stem cell transplantation (ASCT), and lenalidomide maintenance after transplant is now standard. Although lenalidomide doubles progression-free survival, almost all patients eventually relapse. Posttransplant immunotherapy to improve outcomes after ASCT therefore has great merit but first requires delineation of the dynamics of immune reconstitution. We evaluated lymphocyte composition and function after ASCT to guide optimal timing of immunotherapy and to identify potential markers of relapse. Regulatory T cells (Treg) decline as CD8(+) T cells expand during early lymphocyte recovery after ASCT, markedly reducing the Treg:CD8(+) effector T-cell ratio. These CD8(+) T cells can respond to autologous dendritic cells presenting tumor antigen in vitro as early as day +12 after transplant, becoming antigen-specific cytolytic T-lymphocyte effectors and thereby demonstrating preservation of cellular reactivity. CD4(+) and CD8(+) T cells express the negative regulatory molecules, CTLA-4, PD-1, LAG-3, and TIM-3, before and after ASCT. A subpopulation of exhausted/senescent CD8(+) T cells, however, downregulates CD28 and upregulates CD57 and PD-1, characterizing immune impairment and relapse after ASCT. Relapsing patients have higher numbers of these cells at +3 months after transplant, but before detection of clinical disease, indicating their applicability in identifying patients at higher risk of relapse. PD-1 blockade also revives the proliferation and cytokine secretion of the hyporesponsive, exhausted/senescent CD8(+) T cells in vitro. Collectively, these results identify T-cell exhaustion/senescence as a distinguishing feature of relapse and support early introduction of immunotherapy to stimulate antitumor immunity after ASCT.


Figures

Figure 1
Figure 1. Patterns of lymphocyte reconstitution and regulatory T cell-to-CD8+ effector ratio in MM patients after ASCT
(A) Absolute lymphocyte count (ALC) was calculated before high-dose melphalan conditioning, on the day of stem cell infusion, and after ASCT on days +12, 30, 60, and 90. Dotted line indicates lower limit of normal ALC. (B-F) PBMCs were analyzed by flow cytometry for each lymphocyte subpopulation before (pre; 1-7 days before melphalan) and at the indicated time points after ASCT. (B) Total T cells: CD3+ (○) cells are plotted against the LEFT Y axis. CD4+ (□) and CD8+ (Δ) T cells are plotted against the RIGHT Y axis. (C) CD4+ T cells: naïve (CD45RA+; ○) and memory (CD45RO+; □). (D) CD8+ T cells: naïve (CCR7+CD45ROneg; ○), central memory (CCR7+CD45RO+; Δ), effector memory (CCR7negCD45RO+; ■), and effector (CCR7negCD45ROneg; □). (E) B cells (CD19+; ○), NK cells (CD3negCD56+CD16neg and CD3negCD56dimCD16+; □, and plasmacytoid dendritic cells (pDC; CD123+DR+CD11cneg; ●). (F) Regulatory T cell (Treg; CD3+CD4+CD25bright CD127neg) to CD3+CD8+CD25+ effector T cell ratios. For all panels (A-F), pooled data (mean ± SD) from 55 patients are shown. *P < .05 and ***P < .001.
Figure 2
Figure 2. Dendritic cells generated from MM patients after ASCT induce autologous antigen-specific CTLs
(A) Cytokine-matured, monocyte-derived dendritic cells (moDCs) generated from PBMCs from healthy donors, patients in CR after ASCT, and patients who relapsed after ASCT were compared for expression of the maturation marker, CD83. Representative dot plots of mature moDCs from each group are shown, along with pooled data (mean ± SD, n = 3 independent experiments). (B) Mature moDCs generated from these same three groups were added as stimulators in graded doses to a fixed number of allogeneic T cell responders from healthy volunteers (allo-MLRs). DC:T ratios ranged from 1:30 to 1:3000. T cell proliferation was measured by a flow cytometry-based colorimetric assay (triplicate means ± SEM, n = 3 independent experiments). Dotted line depicts background proliferation of T cells alone without stimulation. (C) MoDCs generated from peripheral blood obtained on day +90 after ASCT were electroporated with WT1 mRNA, terminally matured and activated by a combination of inflammatory cytokines (24), and then added in serial doses to triplicate microwells each containing 1 × 10⁵ autologous T cells obtained pre- and post- ASCT (days +12, 30, and 90), in the presence of exogenous recombinant human IL-15 for 7 days. Antigen-specific target cell lysis by CTLs stimulated by these WT1 mRNA-electroporated moDCs was evaluated using a flow cytometry-based assay. Target cells were 697 cells (HLA-A*0201+, WT1+ cell line). SKLY-16 cells (HLA-A*0201+, WT1neg cell line) served as a negative control. Specific lysis is plotted against the Y axis, comparing the lysis activity of T cells from the indicated time points pre- and post-ASCT, after stimulation by WT1 mRNA-electroporated moDCs (triplicate means ± SEM, n = 3 independent experiments).
Figure 3
Figure 3. ASCT does not alter T cell expression of inhibitory receptors
PBMCs were analyzed by flow cytometry for expression of the inhibitory receptors CTLA-4 (A), PD-1 (B), LAG-3 (C), and TIM-3 (D) on CD4+ and CD8+ T cells before (white bar), and 3-months (gray bar) and 12-months (black bar) after ASCT. Pooled data (mean ± SD) from 10 patients are shown.
Figure 4
Figure 4. Regulatory T cell and NK cell trends in non-relapsed and relapsed patients after ASCT
(A-B) PBMCs from patients who remained in a continuous CR one year after ASCT (CCR; n = 15) and patients who initially achieved a CR but relapsed beyond 3 months after ASCT (Relapsed; n = 14) were compared for Treg (CD3+CD4+CD25brightCD127neg) and NK cell (CD3negCD56+CD16neg plus CD3negCD56dimCD16+) content. The percentage of Tregs or NK cells was determined by flow cytometry at 3 and 12-months post-ASCT, or at the time of relapse. Interval fold-change was calculated by comparing Treg (A) or NK cell (B) numbers at the 12-month or relapse time point with values from the 3-month time point when all patients were in a CR. Pooled data (mean ± SD) are shown. *P < .05.
Figure 5
Figure 5. CD8+ T cell exhaustion/senescence is a prominent feature of relapse after ASCT
(A-C) PBMCs from healthy donors (HD, □ß; n = 15), patients in a continuous CR one year after ASCT (CCR, ○; n = 15), and patients who initially achieved CR but relapsed beyond 3 months after ASCT (Relapsed, ■; n = 14) were compared by flow cytometry for (A) CD8+CD28neg, (B) CD8+CD28negCD57+, and (C) CD8+CD28negPD-1+ T cells. Representative dot plots from one patient from each group are shown, with pooled data (mean ± SD) in the far right column for each group. (D) PBMCs from the same three groups in A-C were analyzed for CD4+CD28neg, CD4+CD28negCD57+, and CD4+CD28negPD-1+ T cells. Pooled data (mean ± SD) are shown. (E) Interval changes in CD8+CD28neg, CD8+CD28negCD57+, and CD8+CD28negPD-1+ T cells were assessed by flow cytometry at 3 and 12 months post-ASCT for patients in a CCR one year after ASCT (○; n = 10) and at 3 months and at the time of relapse for patients who initially achieved a CR but relapsed beyond 3 months after ASCT (■; n = 7). *P < .05, **P < .01, ***P < .001, and ****P < .0001.
Figure 6
Figure 6. PD-1 inhibition stimulates the proliferation and cytokine secretion of exhausted/senescent CD8+ T cells in vitro
(A-D) Mature monocyte-derived dendritic cells generated from PBMCs from healthy donors were added as stimulators to T cells from patients in a continuous CR (CCR) one year after ASCT or T cells from patients who initially achieved CR but relapsed beyond 3 months after ASCT, at a 1:30 ratio with nivolumab or IgG4 isotype control in alloMLRs. After 5 days, cells were harvested, and CD8+CD28negPD-1+ T cells were assessed by flow cytometry for (A) proliferation by Ki-67 expression, and secretion of (B) IFNγ, (C) IL2, and (D) TNFα. Representative dot plots from one patient are shown, with pooled data (mean ± SD) from six patients, three in CCR (○) and three relapsed (■), in the far right column for each parameter. **P < .01.

References

    1. Kapoor P, Kumar SK, Dispenzieri A, Lacy MQ, Buadi F, Dingli D, et al. Importance of achieving stringent complete response after autologous stem-cell transplantation in multiple myeloma. J Clin Oncol. 2013;31(36):4529–35. - PMC - PubMed
    1. Lonial S, Anderson KC. Association of response endpoints with survival outcomes in multiple myeloma. Leukemia. 2014;28(2):258–68. - PMC - PubMed
    1. McCarthy PL, Owzar K, Hofmeister CC, Hurd DD, Hassoun H, Richardson PG, et al. Lenalidomide after stem-cell transplantation for multiple myeloma. N Engl J Med. 2012;366(19):1770–81. - PMC - PubMed
    1. Attal M, Lauwers-Cances V, Marit G, Caillot D, Moreau P, Facon T, et al. Lenalidomide maintenance after stem-cell transplantation for multiple myeloma. N Engl J Med. 2012;366(19):1782–91. - PubMed
    1. Palumbo A, Cavallo F, Gay F, Di Raimondo F, Ben Yehuda D, Petrucci MT, et al. Autologous transplantation and maintenance therapy in multiple myeloma. N Engl J Med. 2014;371(10):895–905. - PubMed

Publication types