. 2015 Oct 13;108(1):djv289.
doi: 10.1093/jnci/djv289. Print 2016 Jan.

Reactivation of p53 by a Cytoskeletal Sensor to Control the Balance Between DNA Damage and Tumor Dissemination

Affiliations

Reactivation of p53 by a Cytoskeletal Sensor to Control the Balance Between DNA Damage and Tumor Dissemination

Cecilia Herraiz et al. J Natl Cancer Inst. .

Abstract

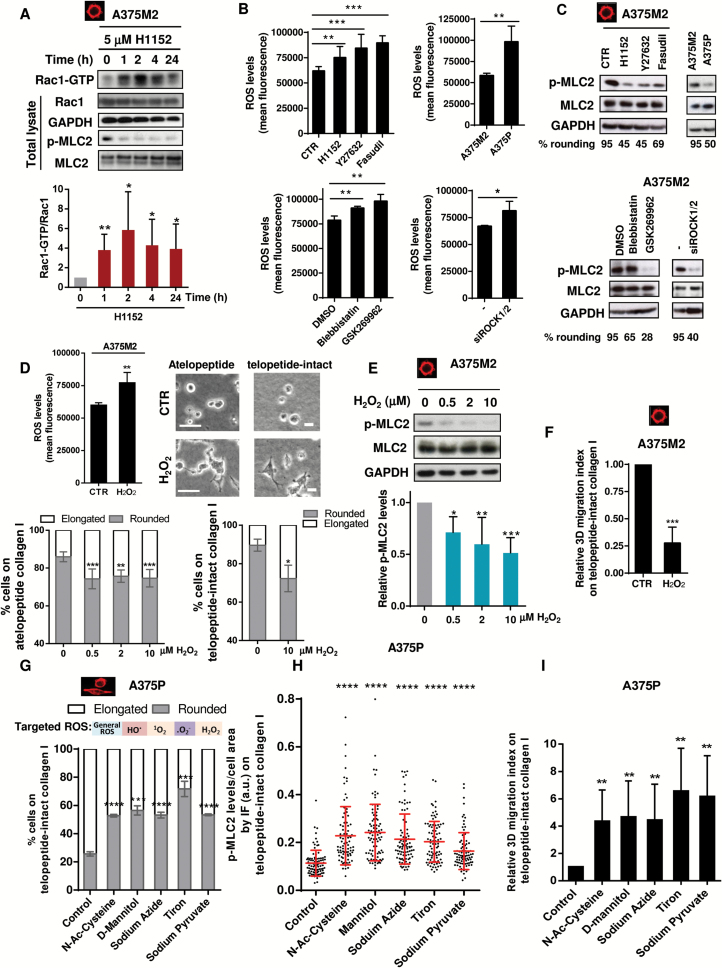
Background: Abnormal cell migration and invasion underlie metastasis, and actomyosin contractility is a key regulator of tumor invasion. The links between cancer migratory behavior and DNA damage are poorly understood.

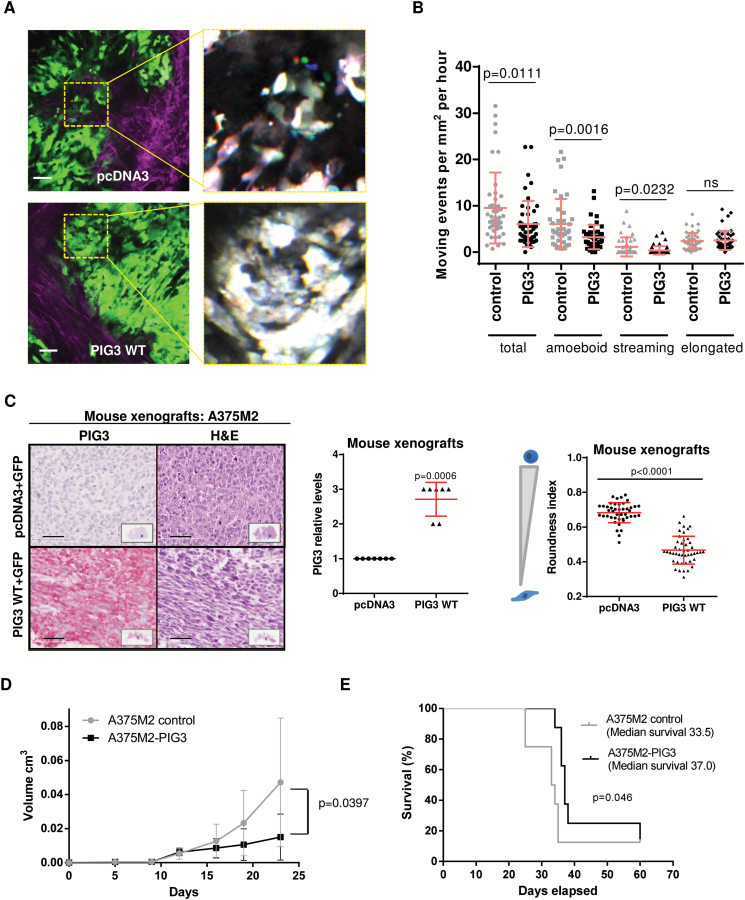
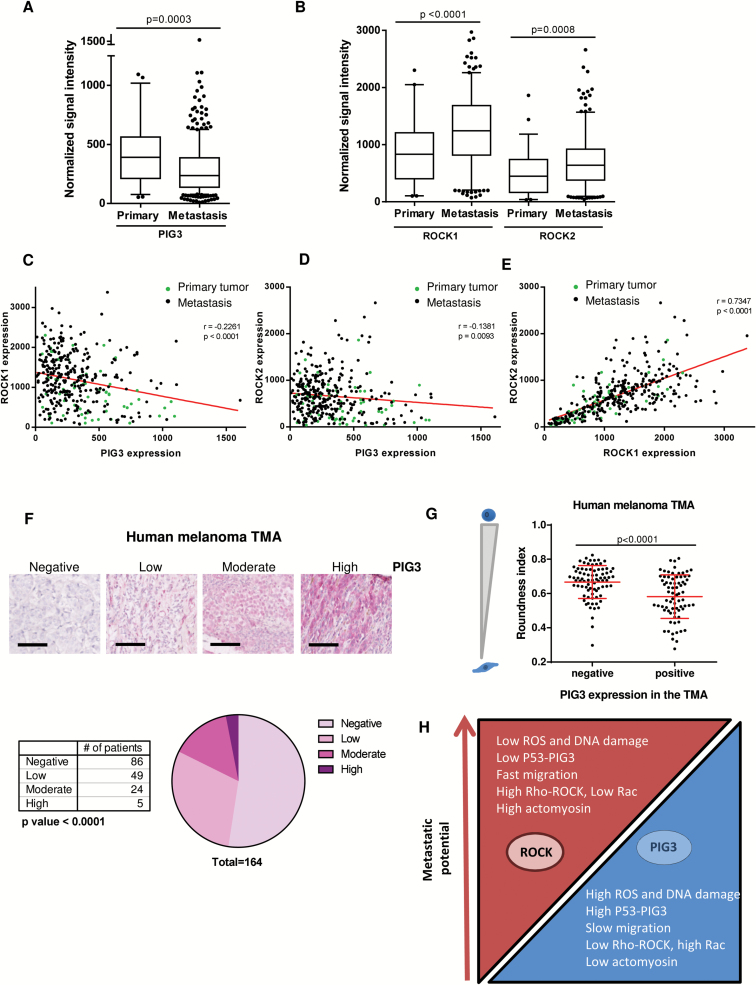
Methods: Using 3D collagen systems to recapitulate melanoma extracellular matrix, we analyzed the relationship between the actomyosin cytoskeleton of migrating cells and DNA damage. We used multiple melanoma cell lines and microarray analysis to study changes in gene expression and in vivo intravital imaging (n = 7 mice per condition) to understand how DNA damage impacts invasive behavior. We used Protein Tissue Microarrays (n = 164 melanomas) and patient databases (n = 354 melanoma samples) to investigate the associations between markers of DNA damage and actomyosin cytoskeletal features. Data were analyzed with Student's and multiple t tests, Mann-Whitney's test, one-way analysis of variance, and Pearson correlation. All statistical tests were two-sided.

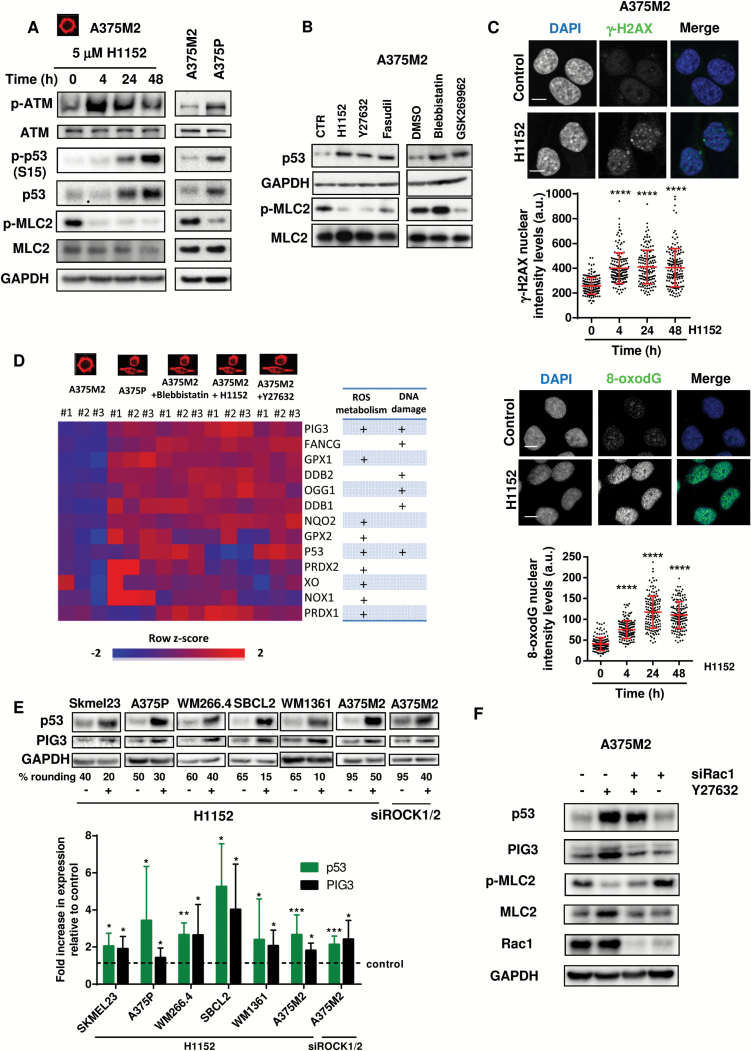
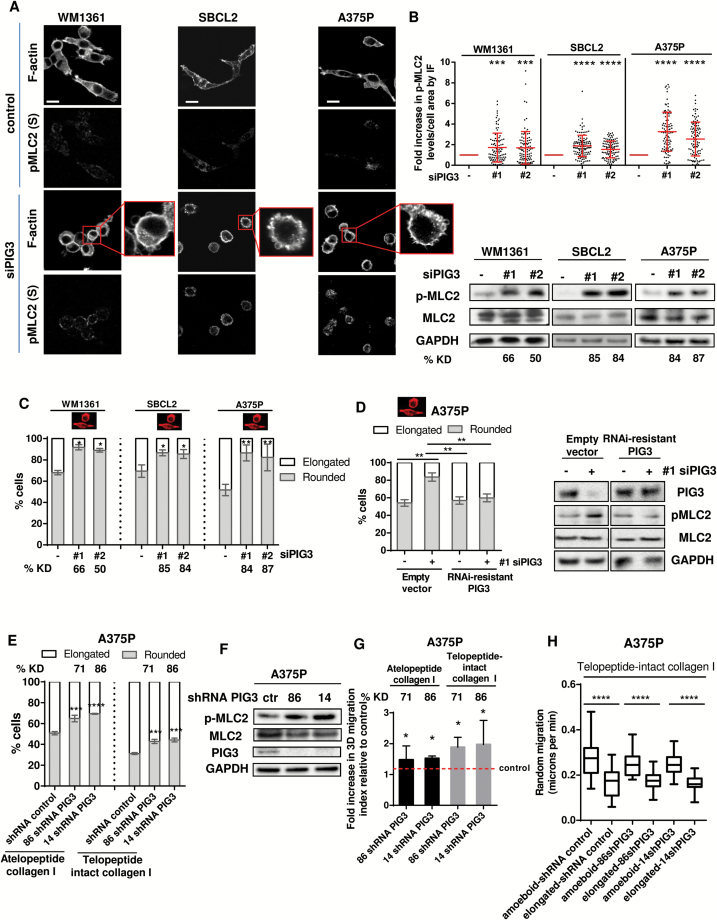
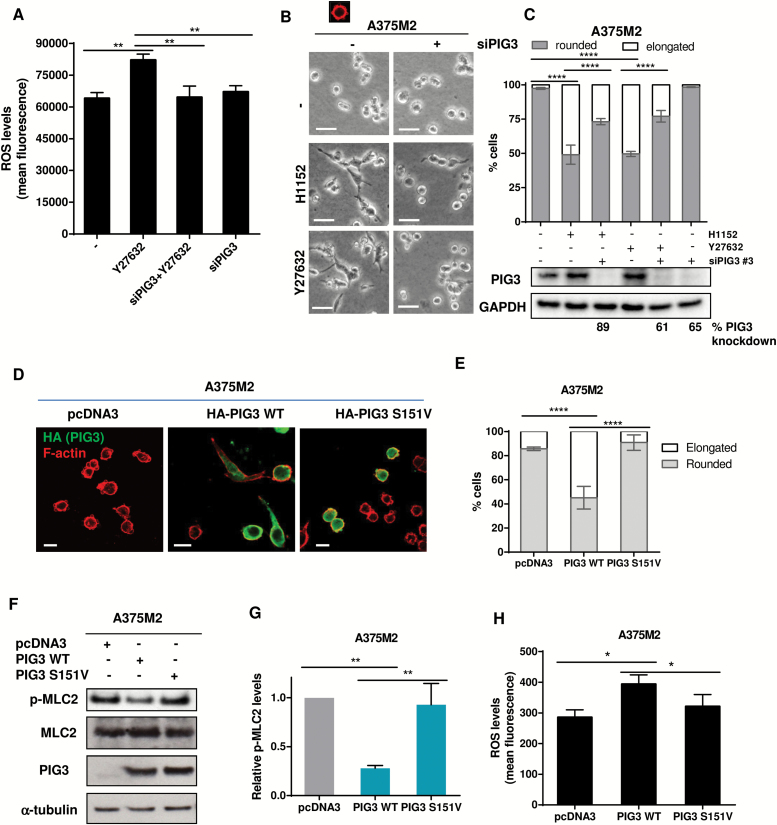
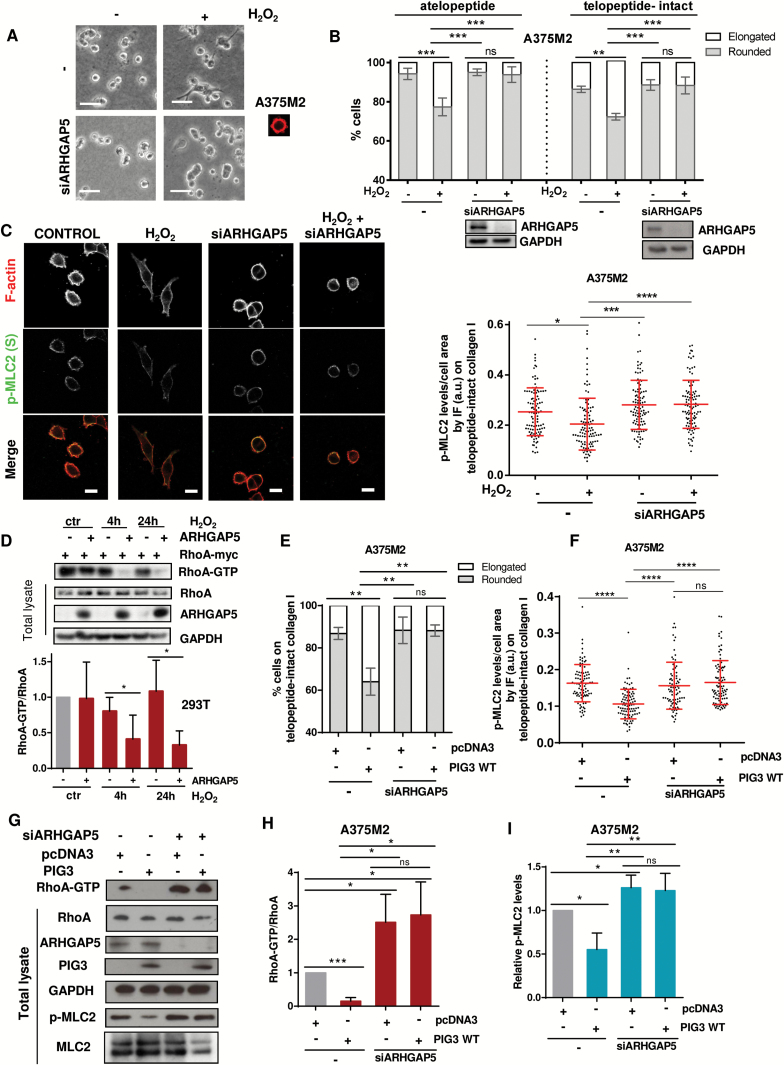
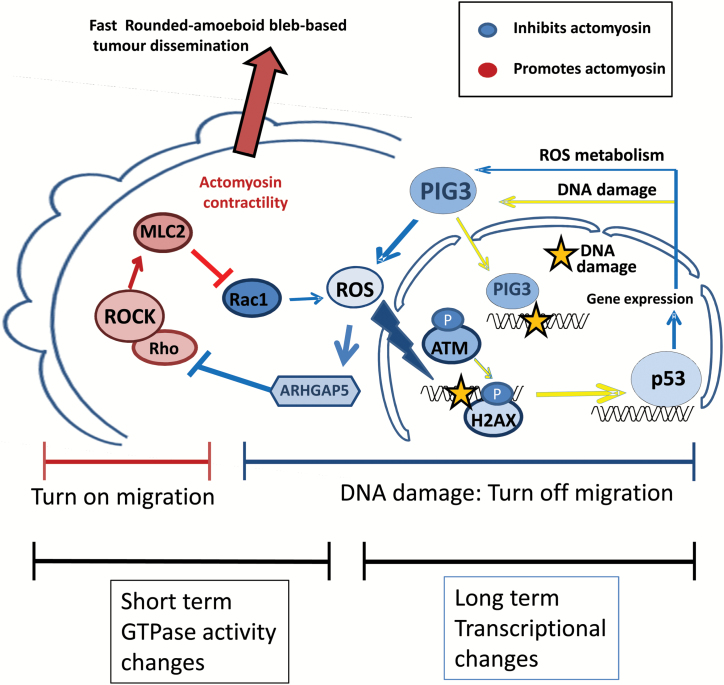
Results: Melanoma cells with low levels of Rho-ROCK-driven actomyosin are subjected to oxidative stress-dependent DNA damage and ATM-mediated p53 protein stabilization. This results in a specific transcriptional signature enriched in DNA damage/oxidative stress responsive genes, including Tumor Protein p53 Inducible Protein 3 (TP53I3 or PIG3). PIG3, which functions in DNA damage repair, uses an unexpected catalytic mechanism to suppress Rho-ROCK activity and impair tumor invasion in vivo. This regulation was suppressed by antioxidants. Furthermore, PIG3 levels decreased while ROCK1/2 levels increased in human metastatic melanomas (ROCK1 vs PIG3; r = -0.2261, P < .0001; ROCK2 vs PIG3: r = -0.1381, P = .0093).

Conclusions: The results suggest using Rho-kinase inhibitors to reactivate the p53-PIG3 axis as a novel therapeutic strategy; we suggest that the use of antioxidants in melanoma should be very carefully evaluated.


Figures

Figure 1.
Figure 1.
Actomyosin contractility and oxidative stress. A) A375M2 cells were treated with 5 μM H1152 for different times from one hour to 24 hours, and Rac1 activation was assessed by pulldown. Representative immunoblot (top) and quantification (bottom) of Rac1-GTP in pulldown samples and of total Rac1 in total lysate (n = 6, error bars are ±SD, two-sided Student’s t test was used to generate P values, *P < .05, **P < .01). B) ROS measurement of A375M2, ROCK-inhibited A375M2 (H1152, 5 μM, Y27632, 10 μM, Fasudil, 10 μM, and GSK269962, 1 μM), A375P cells, contractility-inhibited A375M2 (blebbistatin, 20 μM), and ROCK1/2-depleted A375M2 cells after incubation with DCFH-DA (20 μM). Values are represented as relative mean fluorescence (n = 5, error bars are ±SD, two-sided Student’s t test was used to generate P values, *P < .05, **P < .01, ***P < .001). C) Representative immunoblots of myosin light chain II phosphorylation (p-MLC2) levels of cells (n = 5). D) ROS measurement of A375M2 cells treated with 10 μM H2O2 for 24 hours is shown in the top left panel. CTR = control (n = 5, error bars are ±SD, two-sided Student’s t test was used to generate P values, **P < .01). Top right panel: representative bright-field images of A375M2 cells on top of atelopeptide bovine and telopeptide-intact rat tail collagen I incubated with 10 μM H2O2 for 24 hours. Scale bar = 20 μm. Bottom left panel: cell morphology A375M2 cells on top of atelopeptide bovine collagen I treated with increasing concentrations of H2O2 for 24 hours (n = 6, error bars are ±SD, two-sided one-way analysis of variance (ANOVA) with Tukey′s post hoc test was used to generate P values, **P < .01, ***P < .001). Bottom right panel: cell morphology A375M2 cells on telopeptide-intact collagen I incubated with 10 μM H2O2 for 24 hours (n = 3, error bars are ±SD, two-sided Student’s t test was used to generate P values, *P < .05). E) Representative immunoblot (top) and quantification (bottom) of MLC2 phosphorylation after treatment with increasing concentrations of H2O2 for 24 hours (n = 7, error bars are ±SD, two-sided one-way ANOVA with Tukey’s post hoc test was used to generate P values, *P < .5, **P < .01, ***P < .001). F) 3D migration into telopeptide-intact rat tail collagen I of A375M2 cells after stimulation with 10 μM H2O2 (n = 5, error bars are ±SD, two-sided Student’s t test was used to generate P values, ***P < .001. G) Cell morphology of A375P cells treated with the ROS scavengers N-acetyl cysteine, mannitol, sodium azide, tiron, and sodium pyruvate for 24 hours on top of telopeptide-intact rat tail collagen I (n = 3, error bars are ±SD, two-sided Student’s t test was used to generate P values, ***P < .001, ****P < .0001). H) Quantification of p-MLC2 fluorescence signal relative to the cell area of confocal images in A375P cells after incubation with the ROS inhibitors N-acetyl cysteine, mannitol, sodium azide, tiron, and sodium pyruvate on telopeptide-intact rat tail collagen I. Dots represent single cells from three independent experiments, and values are normalized to the cell area (n = 3 experiments; N = 90 cells, error bars are ±SD, two-sided one-way ANOVA with Tukey’s post hoc test was used to generate P values, ****P < .0001). I) 3D migration into telopeptide-intact rat tail collagen I of A375P cells treated with ROS scavengers N-acetyl cysteine, mannitol, sodium azide, tiron, and sodium pyruvate (n = 6, error bars are ±SD, two-sided Student’s t test was used to generate P values, **P < .01). See also Supplementary Figure 1 (available online).
Figure 2.
Figure 2.
Actomyosin contractility and DNA damage. A) Immunoblots for p-ATM, p-p53 (S15), p53, and p-MLC2 of A375M2 and A375P cells treated with ROCK inhibitor H1152 (5 μM) for the indicated time points (n = 5, representative blots are shown). B) Immunoblots for p53 and p-MLC2 levels of A375M2 cells treated with ROCK inhibitors H1152 (5 μM), Y27632 (10 μM), Fasudil (10 μM), and actomyosin inhibitor blebbistatin (20 μM) and ROCK inhibitor GSK269962 (1 μM) (n = 5, representative blots are shown). C) Top panel: representative confocal images (top) of γ-H2AX (green) immunostaining in A375M2 cells treated with ROCK inhibitor H1152. DAPI was used to stain DNA (blue). Scale bar = 10 μm. Quantification of the nuclear levels in arbitrary units (a.u.) of γ-H2AX in A375M2 upon ROCK inhibition (H1152) from three independent experiments is shown below (n = 3 experiments; N = 150 nuclei, error bars are ±SD, two-sided one-way analysis of variance (ANOVA) with Tukey’s post hoc test was used to generate P values, ****P < .0001). Bottom panel: representative confocal images (top) of 8-oxodG (green) immunostaining in A375M2 cells treated with ROCK inhibitor H1152. DAPI was used to stain DNA (blue). Scale bar = 10 μm. Quantification of the nuclear levels in arbitrary units (a.u.) of 8-oxodG in A375M2 upon ROCK inhibition (H1152) from three independent experiments is shown below (n = 3 experiments; N = 150 nuclei, error bars are ±SD, two-sided one-way ANOVA with Tukey’s post hoc test was used to generate P values, ****P < .0001). D) Heat map of ROS-regulating gene expression following inhibition of actomyosin contractility in A375M2 cells—conditions shown are A375M2 cells, A375P cells, A375M2 cells treated with blebbistatin, H1152, or Y27632. Blue indicates under expression, red overexpression, and intensity of color indicates relative change. Rows were colored using a z-score derived from a gene’s expression across all samples (row z-score). A table indicating the involvement of these genes in ROS metabolism and/or DNA damage is shown on the right. E) Representative immunoblots (top) and quantification (bottom) of p53 and PIG3 levels in human wild-type TP53 melanoma Skmel23 (n = 5), A375P (n = 10), WM266.4 (n = 5), SBCL2 (n = 5), WM1361 (n = 13), and A375M2 cells after treatment with ROCK inhibitor H1152 (5 μM) for 24 hours (n = 10) or after abrogation of ROCK1 and ROCK2 with siRNA for 72 hours (n = 7) in A375M2 cells (error bars are ±SD, two-sided Student’s t test was used to generate P values, *P < .05, **P < .01, ***P < .001). F) Representative immunoblots for p53, PIG3, p-MLC2, and Rac1 of A375M2 cells after depletion of Rac1 for 72 hours and ROCK inhibition treatment with Y27632 (10 μM) for 24 hours (n = 4). See also Supplementary Table 1 and 2 and Supplementary Figure 2 (available online).
Figure 3.
Figure 3.
3D migration and PIG3 in melanoma. A) Representative confocal images of p-MLC2 (Ser19) and F-actin immunostaining in PIG3-depleted WM1361, SBCL2, and A375P cells on atelopeptide bovine collagen I. Scale bar = 20 μm. Inset shows cell blebbing in PIG3-depleted cells (n = 3, representative blots are shown). B) Quantification of p-MLC2 immunofluorescence (IF) signal relative to the cell area of confocal images in PIG3-abrogated melanoma cells WM1361, SBCL2, and A375P. Each dot represents a single cell from three independent experiments (n = 3 experiments; N = 105 cells, error bars are ±SD, two-sided one-way analysis of variance (ANOVA) with Tukey’s post hoc test was used to generate P values, *P < .05, ***P < .001, ****P < .0001). Immunoblots for p-MLC2 levels in PIG3-ablated WM1361, SBCL2, and A375P cells seeded on collagen I are shown on the right. Percentage of PIG3 knockdown (KD) is shown below. C) Cell morphology of WM1361, SBCL2, and A375P cells on atelopeptide bovine collagen I after PIG3 depletion. Two individual On Target (OT) siRNA oligonucleotides were transfected to deplete PIG3 expression (#1 and #2). PIG3 knockdown (KD) levels are shown below as % (n = 3 in WM1361 and SBCL2 and n = 4 in A375P, error bars are ±SD, two-sided one-way ANOVA with Tukey’s post hoc test was used to generate P values, *P < .05, **P < .01). D) Left panel: cell morphology of A375P cells overexpressing empty vector or RNAi resistant PIG3 after PIG3 knockdown (n = 3, error bars are ±SD, two-sided Student’s t test was used to generate P values, **P < .01). Representative immunoblots for PIG3 and p-MLC2 levels are shown on the right panel (n = 3, representative blots are shown). E) Cell morphology of A375P cells stably transfected with shRNA for PIG3 and seeded on atelopeptide bovine and telopeptide-intact rat tail collagen I (n = 3, error bars are ±SD, two-sided one-way ANOVA with Tukey’s post hoc test was used to generate P values, ***P < .001, ****P < .0001). Percentage of PIG3 knockdown (KD) is shown above. F) Representative immunoblots of p-MLC2 and PIG3 levels of A375P cells on atelopeptide bovine collagen I matrix after shRNA depletion of PIG3 (n = 3, a representative experiment is shown). Ctr stands for control. G) 3D migration into atelopeptide bovine and telopeptide-intact rat tail collagen I of A375P cells after PIG3 depletion with shRNA (n = 5, error bars are ±SD, two-sided one-way ANOVA with Tukey’s post hoc test was used to generate P values, *P < .05). Percentage of PIG3 knockdown (KD) is shown above. H) Random migration of PIG3-depleted A375P cells on telopeptide-intact collagen I (n = 3 experiments; N = 30 cells, error bars are ±SD, two-sided Student’s t test was used to generate P values, ****P < .0001). See also Supplementary Figure 3 and Supplementary Movies 1 and 2 (available online).
Figure 4.
Figure 4.
PIG3 catalytic activity and the actomyosin cytoskeleton. A) ROS measurements of A375M2 treated with ROCK inhibitor Y27632 (10 μM) for 24 hours after depletion of PIG3 by siRNA. Values are represented as relative mean fluorescence (n = 3, error bars are ±SD, two-sided one-way analysis of variance (ANOVA) with Tukey’s post hoc test was used to generate P values, **P < .01). B) Representative bright-field images of PIG3-depleted–A375M2 cells on bovine collagen I and incubated with ROCK inhibitors H1152 (5 μM) or Y27632 (10 μM) for 24 hours. Scale bar = 20 μM. C) Cell morphology of A375M2 cells on top of bovine collagen I after PIG3 depletion prior to treatment with H1152 (5 μM) or Y27632 (10 μM) for 24 hours (n = 3, error bars are ±SD, two-sided one-way ANOVA with Tukey’s post hoc test was used to generate P values, ***P < .001, ****P < .0001). Percentage of PIG3 knockdown is shown below. D) Representative confocal images of PIG3 (green) immunostaining in A375M2 cells transiently transfected with empty vector pcDNA3 or with the constructs HA-PIG3 WT or HA-PIG3 S151V on bovine collagen I. F-actin was also stained (red). Scale bar = 20 μm. E) Cell morphology of A375M2 cells overexpressing HA-PIG3 WT or HA-PIG3 S151V on bovine collagen I matrix (n = 4, error bars are ±SD, two-sided one-way ANOVA with Tukey’s post hoc test was used to generate P values, ****P < .0001). F) Representative immunoblots for p-MLC2 and PIG3 protein levels in PIG3-overexpressing A375M2 cells (n = 3, representative blots are shown). G) Quantification of MLC2 phosphorylation levels normalized to cells transfected with the empty vector (n = 3, error bars are ±SD, two-sided one-way ANOVA with Tukey’s post hoc test was used to generate P values, **P < .01). H) ROS measurement of A375M2 cells transfected with empty vector pcDNA3, PIG3 WT, or S151V PIG3. ROS levels were represented as relative mean fluorescence (n = 4, error bars are ±SD, two-sided one-way ANOVA with Tukey’s post hoc test was used to generate P values, *P < .05, **P < .001). See also Supplementary Figure 4 (available online).
Figure 5.
Figure 5.
Regulation of cytoskeletal dynamics via PIG3 and ARHGAP5/P190RhoB. A) Representative bright-field images seeded on atelopeptide bovine collagen I and 72 hours post-transfection, treated with H2O2 (10 μM) for 24 hours. Scale bar = 20 μm. B) Cell morphology of ARHGAP5-depleted A375M2 cells on top of atelopeptide collagen I compared with telopeptide-intact rat tail collagen I after stimulation with 10 μM H2O2 (n = 3, error bars are ±SD, two-sided one-way analysis of variance (ANOVA) with Tukey’s post hoc test was used to generate P values, **P < .01, ***P < .001). Immunoblot for ARHGAP5 is shown below. NS = nonsignificant. C) Representative confocal images (left) of p-MLC2 (green) immunofluorescence (IF) and quantification of p-MLC2 (Ser19) levels (right) of ARHGAP5-ablated A375M2 cells stimulated with H2O2 (10 μM) for 24 hours. F-actin was also stained (red). Each dot represents a single cell; values are relative to the cell area and represented in arbitrary units (a.u.) from three independent experiments (n = 3 experiments; N = 90 cells, error bars are ±SD, two-sided one-way ANOVA with Tukey’s post hoc test was used to generate P values, *P < .05, ***P < .001, ****P < .0001). Scale bar = 20 μm. D) Representative immunoblots (top) and quantification (bottom) showing Myc-RhoA activation and Flag-ARHGAP5 overexpression in HEK293T cells treated with 10 μM H2O2 (n = 3, error bars are ±SD, two-sided Student’s t test was used to generate P values, *P < .05). E) Cell morphology of PIG3-overexpressing A375M2 cells after stimulation with 10 μM H2O2 (n = 3, error bars are ±SD, two-sided one-way ANOVA with Tukey’s post hoc test was used to generate P values, ****P < .0001). F) Quantification of p-MLC2 (Ser19) levels from confocal images of p-MLC2 immunofluorescence (IF) stainings of PIG3-overexpressing A375M2 cells stimulated with H2O2 (10 μM) for 24 hours. Each dot represents a single cell, and values are represented in arbitrary units (a.u.) from three independent experiments. NS = nonsignificant (n = 3 experiments; N = 90 cells, error bars are ±SD, two-sided one-way ANOVA with Tukey’s post hoc test was used to generate P values, ****P < .0001). G) Representative immunoblots showing RhoA activation, ARHGAP5, PIG3, and p-MLC2 levels in A375M2 cells overexpressing PIG3 WT after knocking down ARHGAP5 (n = 4, a representative blot is shown). H) Quantification of Rho-GTP normalized to total Rho levels in PIG3-overexpressing A375M2 cells after depleting ARHGAP5 (n = 4, error bars are ±SD, two-sided Student’s t test was used to generate P values, *P < .05). I) Quantification of MLC2 phosphorylation levels from (G) (n = 4, error bars are ±SD, two-sided Student’s t test was used to generate P values, *P < .05, **P < .01). See also Supplementary Figure 5 (available online).
Figure 6.
Figure 6.
Balance between Rho-ROCK and oxidative stress–induced DNA damage. Oxidative stress–dependent DNA damage results in p53 stabilization in cells with low actomyosin contractility. In turn, p53 drives the expression of several genes involved in oxidative stress metabolism and DNA damage responses, including PIG3. PIG3, apart from its DNA damage response functions, sustains production of ROS to inhibit cytoskeletal Rho-ROCK signaling through ARHGAP5, suppressing rounded-amoeboid fast tumor dissemination.
Figure 7.
Figure 7.
PIG3 and cancer motility in vivo. A) Multiphoton intravital microscopy of A375M2 subcutaneous tumors (GFP) and representative images of control (top) and PIG3 WT (bottom) stably transfected cells. Right panels show at higher magnification motion analysis of areas indicated in yellow, red, green, and blue images from three time points 630s apart are overlaid, and distinct areas of color indicate motile cells. Scale bar = 50 μm. B) Quantification of the number of motile cells in control and in PIG3 WT–overexpressing A375M2 cells (7 fields/mouse; 7 mice/condition, error bars are ±SD, two-sided Student’s t test was used to generate P values). C) Representative images of mouse xenografts sections of pcDNA3 or PIG3 WT–overexpressing A375M2 stained for PIG3 or for hematoxylin and eosin (H&E). Scale bar = 50 μm. Graph representing PIG3 expression levels in the xenografts is shown in the middle (7 mouse xenografts/condition, error bars are ±SD, two-sided Student’s t test was used to generate P values). Cell morphology (roundness index) calculated from H&E images of xenografts of mouse tumors of A375M2 control or PIG3 WT–overexpressing cells is shown on the right panel (7 mouse xenografts/condition, 6 fields/mouse xenograft, error bars are ±SD, two-sided Student’s t test was used to generate P values). D) Volume of subcutaneous tumors at different days after injecting A375M2 or A375M2 cells overexpressing PIG3 WT. The results show mean volumes measured on days 5, 9, 12, 16, 19, and 23 for groups of seven mice/condition, with error bars to represent ±SD. A two-sided Student’s t test was used to calculate P value for day 23. E) Survival curves for subcutaneous xenograft mouse models of A375M2 control cells and PIG3 WT–overexpressing A375M2 cells. The survival curve represents the percentage of animals alive at the indicated time point after injection. (Survival curves were estimated by the Kaplan Meier method and compared among subsets using the log-rank test. Differences with a P value < .05 were considered statistically significant, and all tests were two-sided).
Figure 8.
Figure 8.
Actomyosin contractility and PIG3 in human melanomas. A) PIG3 expression in primary and metastasis melanoma human tissues using normalized mRNA expression data from The Cancer Genome Atlas (TCGA) database. B) ROCK1 and ROCK2 expression in primary and metastasis melanoma human tissues using normalized mRNA expression data from TCGA database. A and B) Box plots show the median, quartiles, 10% and 90% values and outliers (Mann-Whitney test was used to generate P values). C-E) Scatter plot of PIG3, ROCK1, and ROCK2 expression correlation analysis (Pearson’s r) using normalized mRNA expression data from TCGA database. C and D) Results showed a significant negative correlation between PIG3 and ROCK1 expression (r = -0.2261) and between PIG3 and ROCK2 expression (r = -0.1381). E) Analysis revealed a significant positive correlation between ROCK1 and ROCK2 expression (r = 0.7347). F) Number of melanoma patients expressing negative, low, moderate, or high levels of PIG3 in the tissue microarrays (TMAs). The number of melanoma patients expressing the different PIG3 levels is shown in the graph (Chi-square test was used to generate P values). A representative image of the four grades of staining intensity used to score PIG3 expression in the tissue microarray is shown above. Scale bar = 100 μm. G) Association between morphological features (roundness index) and PIG3 staining intensity in two melanoma TMAs. Stain intensity was scored as negative or positive (low, moderate, and high level) intensity for PIG3 expression in the TMAs. For cell morphology, three random fields per core in the hematoxylin and eosin–stained TMAs were randomly chosen and the roundness index was calculated using ImageJ (30 cells/core) (error bars are ±SD, two-sided Student’s t test was used to generate P values). H) Diagram representing the relationship between cytoskeletal Rho-ROCK signaling, PIG3 catalytic activity resulting in high oxidative stress-dependent DNA damage and its association with less tumor invasion, and thus less metastatic potential. See also Supplementary Figure 7 (available online).

References

    1. Yurlova L, Derks M, Buchfellner A, et al. The fluorescent two-hybrid assay to screen for protein-protein interaction inhibitors in live cells: targeting the interaction of p53 with Mdm2 and Mdm4. J Biomol Screen. 2014;19(4):516–525. - PubMed
    1. Downing A, Yu XQ, Newton-Bishop J, Forman D. Trends in prognostic factors and survival from cutaneous melanoma in Yorkshire, UK and New South Wales, Australia between 1993 and 2003. Int J Cancer. 2008;123(4):861–866. - PubMed
    1. Linos E, Swetter SM, Cockburn MG, Colditz GA, Clarke CA. Increasing burden of melanoma in the United States. J Invest Dermatol. 2009;129(7):1666–1674. - PMC - PubMed
    1. Friedl P, Alexander S. Cancer invasion and the microenvironment: plasticity and reciprocity. Cell. 2011;147(5):992–1009. - PubMed
    1. Lammermann T, Sixt M. Mechanical modes of ‘amoeboid’ cell migration. Curr Opin Cell Biol. 2009;21(5):636–644. - PubMed

Publication types

MeSH terms