. 2017 Jan 1;27(1):373-385.
doi: 10.1093/cercor/bhv225.

Two New Cytoarchitectonic Areas on the Human Mid-Fusiform Gyrus

Affiliations

Two New Cytoarchitectonic Areas on the Human Mid-Fusiform Gyrus

Simon Lorenz et al. Cereb Cortex. .

Abstract

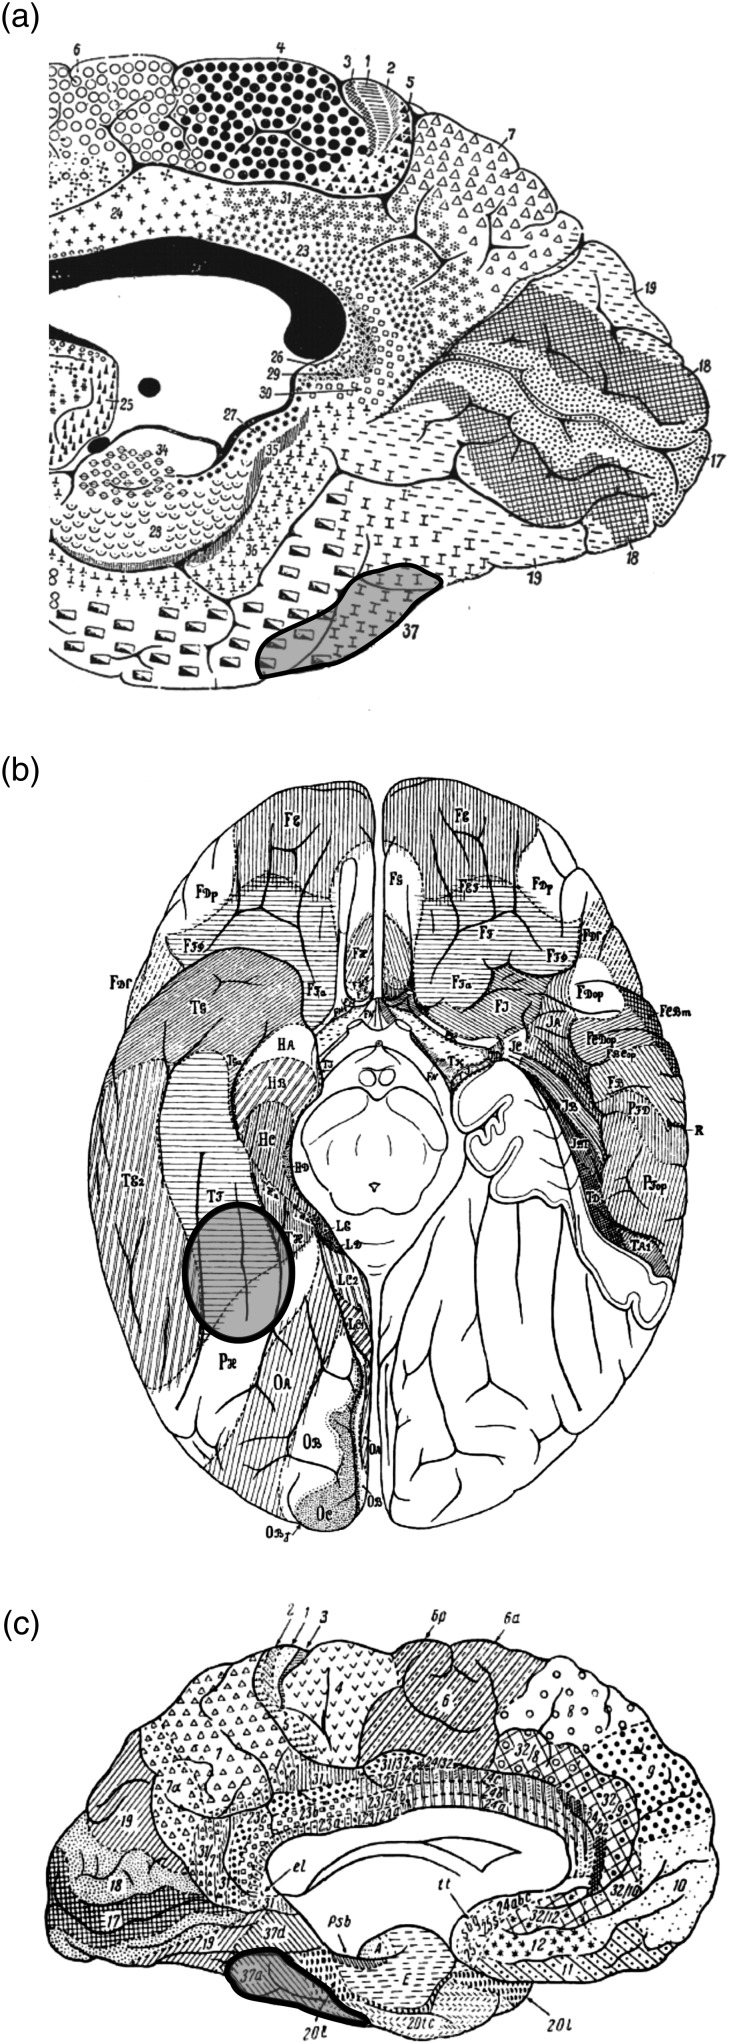
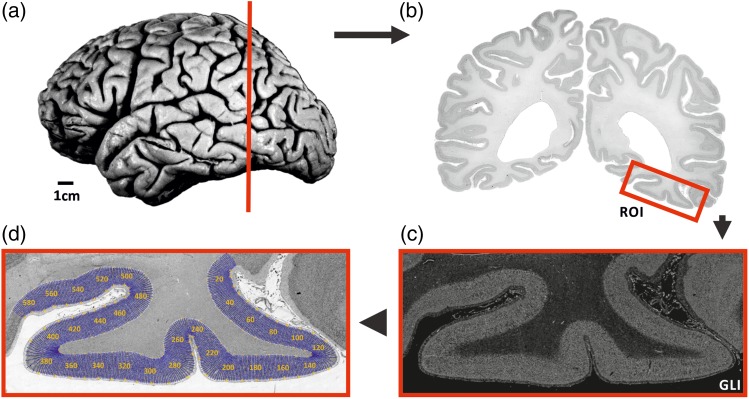
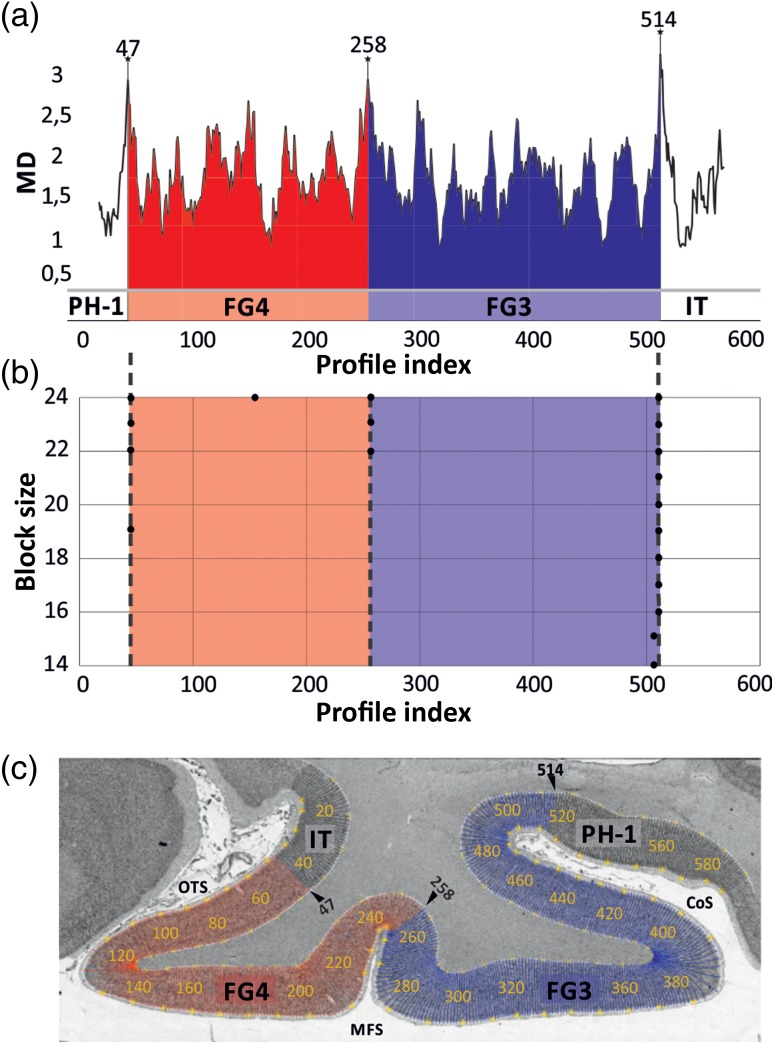
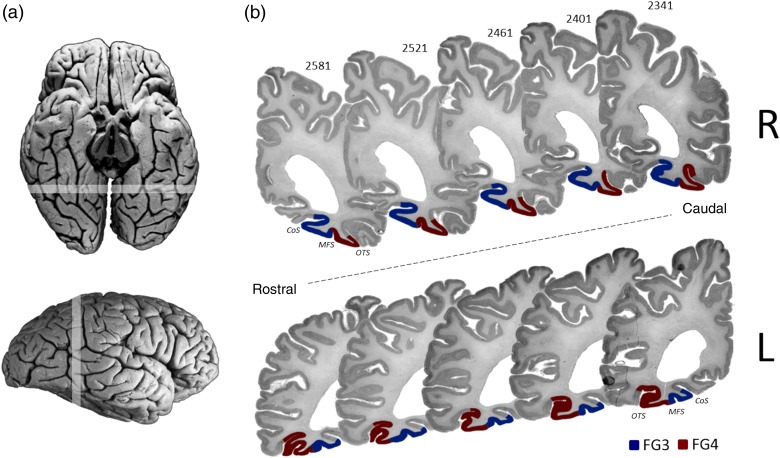
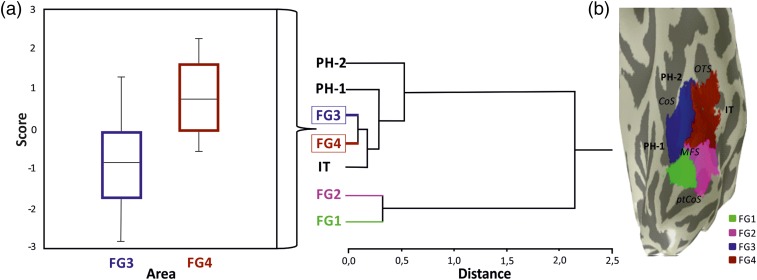
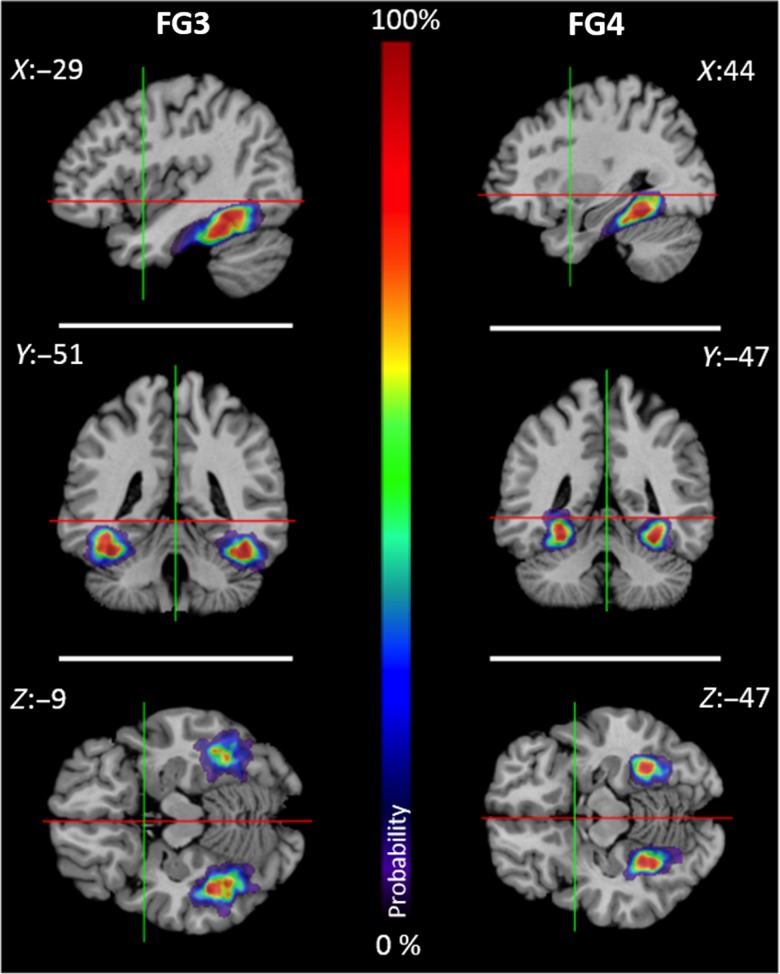
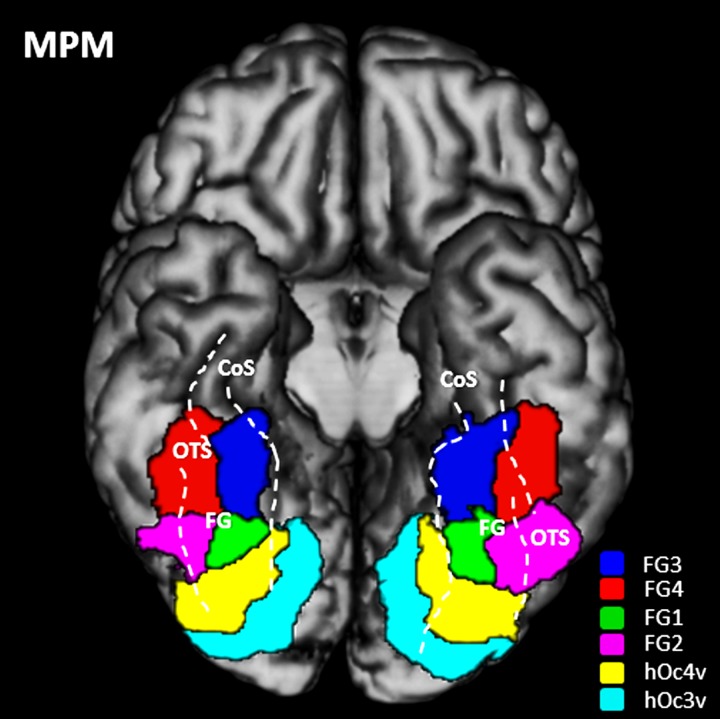
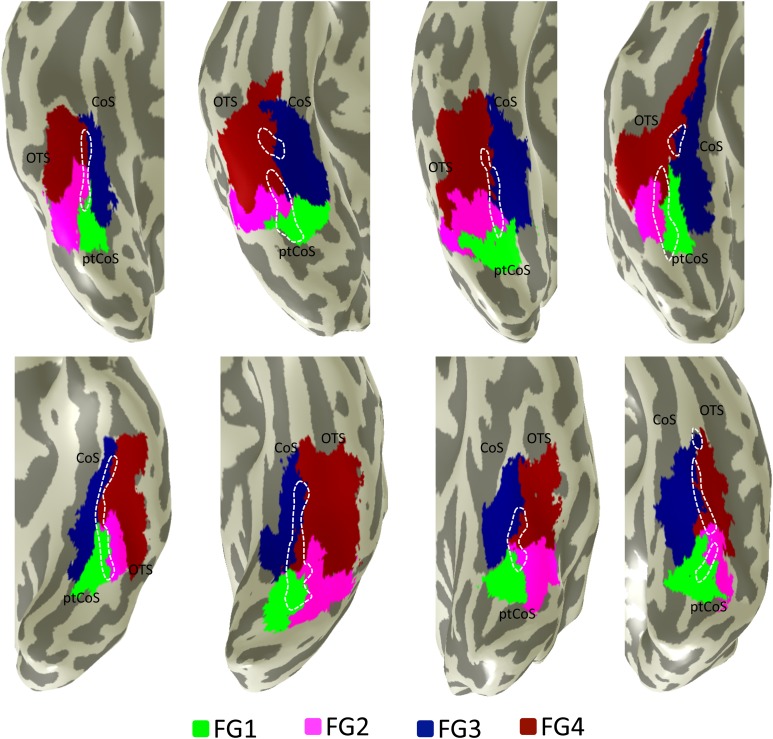
Areas of the fusiform gyrus (FG) within human ventral temporal cortex (VTC) process high-level visual information associated with faces, limbs, words, and places. Since classical cytoarchitectonic maps do not adequately reflect the functional and structural heterogeneity of the VTC, we studied the cytoarchitectonic segregation in a region, which is rostral to the recently identified cytoarchitectonic areas FG1 and FG2. Using an observer-independent and statistically testable parcellation method, we identify 2 new areas, FG3 and FG4, in 10 human postmortem brains on the mid-FG. The mid-fusiform sulcus reliably identifies the cytoarchitectonic transition between FG3 and FG4. We registered these cytoarchitectonic areas to the common reference space of the single-subject Montreal Neurological Institute (MNI) template and generated probability maps, which reflect the intersubject variability of both areas. Future studies can relate in vivo neuroimaging data with these microscopically defined cortical areas to functional parcellations. We discuss these results in the context of both large-scale functional maps and fine-scale functional clusters that have been identified within the human VTC. We propose that our observer-independent cytoarchitectonic parcellation of the FG better explains the functional heterogeneity of the FG compared with the homogeneity of classic cytoarchitectonic maps.

Keywords: cytoarchitecture; fusiform gyrus; mid-fusiform sulcus (MFS); probabilistic mapping; ventral temporal cortex (VTC).


Figures

Figure 1.
Figure 1.
Classical cytoarchitectonic maps. (a) Brodmann (1909), mesial view, (b) von Economo and Koskinas (1925), basal view, and (c) Sarkisov et al. (1949), mesial view. Areas highlighted in blue indicate the ROI. Brodmann and Sarkisov (a and c) labeled the areas by arabic numerals (here: 20, 37). von Economo and Koskinas used both numerals and letters (here: TF, PH).
Figure 2.
Figure 2.
Histological procedure. (a) Postmortem brain pm 4 (cf. Table 1) sectioned in the coronal plane [cutting position of the histological section in (b) marked in red]. (b) Cell body-stained histological section (20 µm) indicated in (a). Red rectangle indicates the analyzed ROI. (c) The ROI was digitized and transformed into a GLI image enabling to discriminate between volume fractions of cell bodies and neuropil. (d) Curvilinear trajectories marked in blue were defined by interactively drawn inner and outer contour lines in the histological section. The equidistant GLI profiles were extracted along the trajectories for further analysis (yellow numbers indicate the position of the trajectories).
Figure 3.
Figure 3.
Observer-independent border detection. ROI analyzed as shown in Fig. 2. (a) MD functions plotted against trajectory positions (profile index). Significant maxima were found on the position 47, 258, 514. (b) MD functions ranging from block size 8–24 profiles used for border detection are displayed. Positions of significant maxima are indicated by dots at their positions (abscissa) and the blocksize (ordinate). (c) ROI with trajectory lines along the cortical ribbon (every 10th is labeled). Borders with significant maxima in the MD function across different block sizes (cf. b) are indicated with black arrowheads. CoS: collateral sulcus; OTS: occipitotemporal sulcus; MFS: mid-fusiform sulcus; FG3: fusiform gyrus area 3 (blue); FG4: fusiform gyrus area 4 (red); adjacent not yet mapped areas: IT (inferotemporal area) and PH1 (parahippocampal area 1).
Figure 4.
Figure 4.
Sequence of 5 coronal histological sections (pm 4). (a) Dorsal and lateral views of the postmortem brain. Highlighted rostro-caudal range locates the sections presented in (b). (b) Positions of FG3 (blue) and FG4 (red) in 5 sections from caudal to rostral in both hemispheres (R: right; L: left). CoS: collateral sulcus; MFS: mid-fusiform sulcus; OTS: occipitotemporal sulcus.
Figure 5.
Figure 5.
Cytoarchitectonic features of FG1–FG4, as well as adjacent areas (PH1/2, IT). Upper row: Lines indicate mean GLI profiles (abscissa) from 15 individual profiles. The cortical depth was normalized to 100%. FG3 (blue) is characterized by a thin layer IIIc with small- to medium-sized pyramidal cells compared with a prominent layer IIIc with medium- to large-sized cells in FG4 (red). FG4 is further characterized by a heterogeneously packed layer V/VI with a cell dense layer Va and a strip-like cell-sparse sublayer Vb, compared with a rather homogeneously distributed V/VI in FG3. The posteriorly adjoining FG1 mainly differed from FG3 by a distinct columnar arrangement of pyramidal cells in layers III and V. FG4 showed a subdivision of layer V, which could not be identified in FG2. Lower row: Cytoarchitectonic features of the neighboring areas from one representative brain (brain pm 8; cf. Table 1). Cortical layers are marked in Roman numeral. Black bar in the left lower corner: 1 mm.
Figure 6.
Figure 6.
Analysis of mean GLI profiles. (a) Dendrogram including FG3 and FG4 as well as the adjacent areas PH1/2, IT, FG1, and FG2. The hierarchical clustering is based on the degree of dissimilarity in the set of 10 mean areal feature vectors (bin means) of profiles by the Euclidean distance. (b) Brain no. pm 3 (cf. Table 1 and Fig. 9) representative inflated brain displaying the spatial organization of the fusiform areas (FG1–4) as well as the not yet entirely mapped adjoining areas (PH1/2 and IT). Transparency of the fusiform areas reveals the relationships with the macroanatomic landmarks. CoS: collateral sulcus; OTS: occipitotemporal sulcus; ptCoS: posterior transverse CoS; MFS: mid-fusiform sulcus.
Figure 7.
Figure 7.
Probabilistic maps of FG3 and FG4 in the anatomical MNI space. The voxel-based probability of overlap was color-coded. Regions of high areal overlaps (9–10 brains) were depicted in dark red. The lowest areal representation was displayed by dark blue. From top to bottom: sagittal, coronal, and horizontal sections. Red and green lines cross in x = 0 and y = 0 coordinates of the different sections.
Figure 8.
Figure 8.
MPM of the visual cortex. The MPM is displayed on a 3D rendering of the MNI single-subject reference template without the cerebellum including hOc3v (cyan), hOc4v (yellow), FG1 (green) and FG2 (violet), FG3 (red) and FG4 (blue) (Rottschy et al. 2007; Caspers, Zilles, et al. 2013). Basal view is shown. Dashed lines highlight the position and extent of sulci delimiting the FG. FG: fusiform gyrus; CoS: collateral sulcus; OTS: occipitotemporal sulcus.
Figure 9.
Figure 9.
The cytoarchitectonic transition between FG3 and FG4 occurs within the MFS. Cytoarchitectonic regions FG1 (green), FG2 (magenta), FG3 (blue), and FG4 (red) projected to the inflated cortical surface of individual right (top) and left (bottom) hemispheres. The border between FG3 and FG4 occurs within the anterior MFS (dotted line), whereas the border between FG1 and FG2 occurs within the posterior MFS. CoS: collateral sulcus; OTS: occipitotemporal sulcus; ptCoS: posterior transverse CoS. The brains included in this image are from left to right: top: pm 10, pm 9, pm 8, and pm 7; bottom: pm 10, pm 4, pm 3, and pm 1 (cf. Table 1).
Figure 10.
Figure 10.
Tighter coupling between cortical folding and cytoarchitectonic boundaries of FG3 and FG4 compared with FG1 and FG2. (a) Distance (mm) between cytoarchitectonic transition and the MFS. (b) Left: Distance between medial boundaries of FG1 and FG3, respectively, and the CoS. Right: Distance between lateral boundaries of FG2 and FG4, respectively, and the OTS. *P < 10−4.

References

    1. Abdollahi RO, Kolster H, Glasser MF, Robinson EC, Coalson TS, Dierker D, Jenkinson M, Van Essen DC, Orban GA. 2014. Correspondences between retinotopic areas and myelin maps in human visual cortex. NeuroImage. 99:509–524. - PMC - PubMed
    1. Amunts K, Kedo O, Kindler M, Pieperhoff P, Mohlberg H, Shah NJ, Habel U, Schneider F, Zilles K. 2005. Cytoarchitectonic mapping of the human amygdala, hippocampal region and entorhinal cortex: intersubject variability and probability maps. Anat Embryol (Berl). 210:343–352. - PubMed
    1. Amunts K, Malikovic A, Mohlberg H, Schormann T, Zilles K. 2000. Brodmann's areas 17 and 18 brought into stereotaxic space-where and how variable? NeuroImage. 11:66–84. - PubMed
    1. Amunts K, Zilles K. 2001. Advances in cytoarchitectonic mapping of the human cerebral cortex. Neuroimaging Clin N Am. 11:151–169, vii. - PubMed
    1. Amunts K, Armstrong E, Malikovic A, Homke L, Mohlberg H, Schleicher A, Zilles K. 2007. Gender-specific left-right asymmetries in human visual cortex. J Neurosci. 27:1356–1364. - PMC - PubMed

Publication types