. 2015 Dec 20;24(25):7227-40.
doi: 10.1093/hmg/ddv423. Epub 2015 Oct 12.

PLEKHM2 mutation leads to abnormal localization of lysosomes, impaired autophagy flux and associates with recessive dilated cardiomyopathy and left ventricular noncompaction

Affiliations

PLEKHM2 mutation leads to abnormal localization of lysosomes, impaired autophagy flux and associates with recessive dilated cardiomyopathy and left ventricular noncompaction

Emad Muhammad et al. Hum Mol Genet. .

Abstract

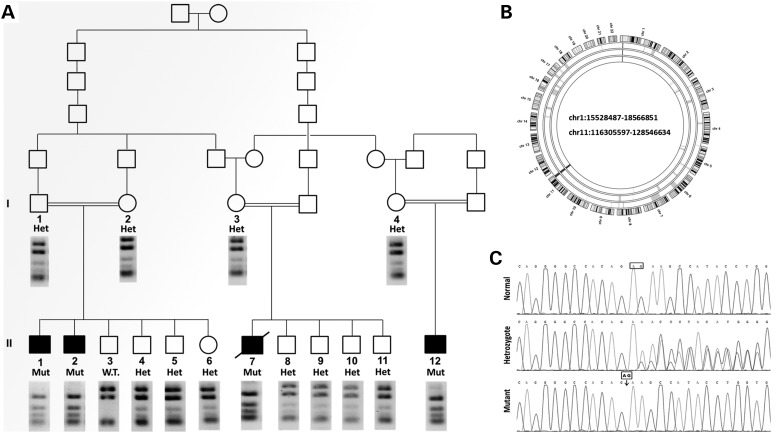
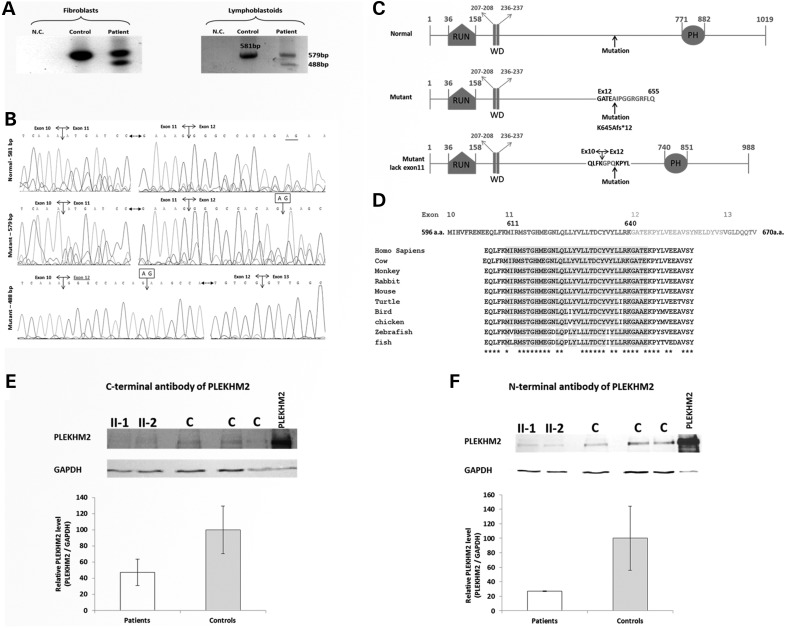
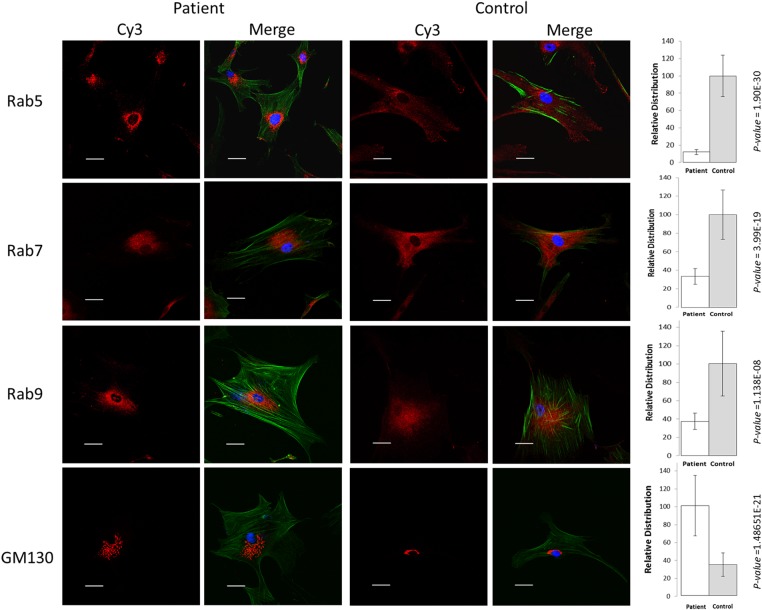
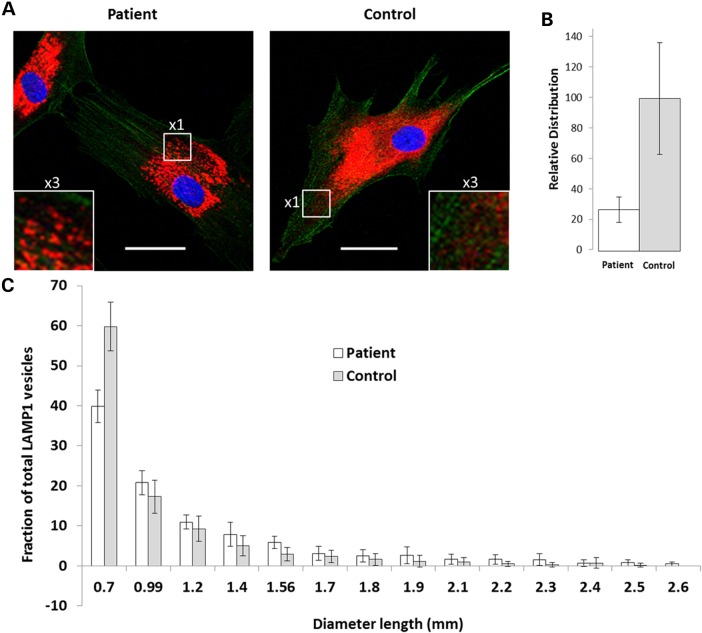
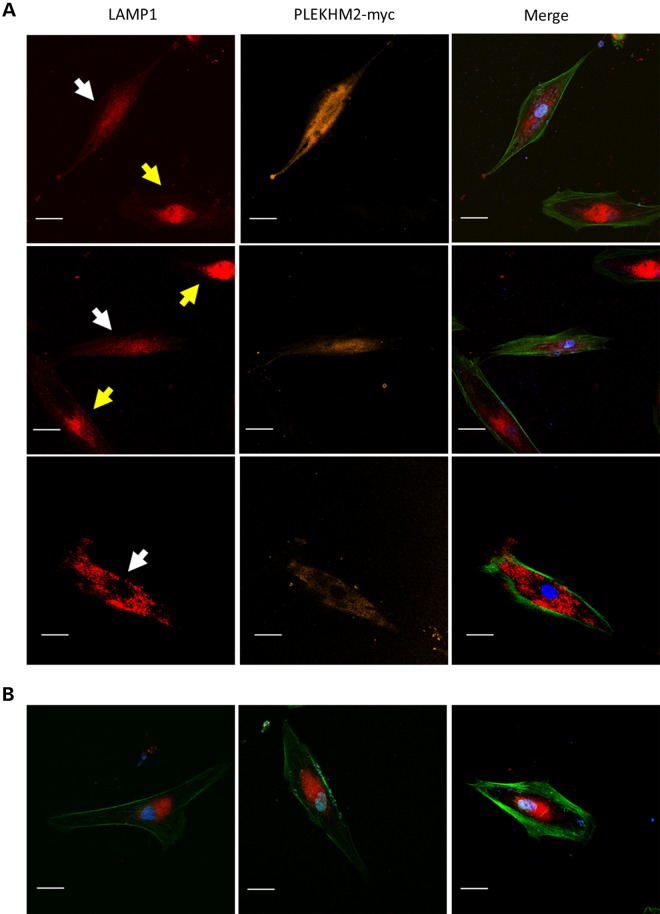
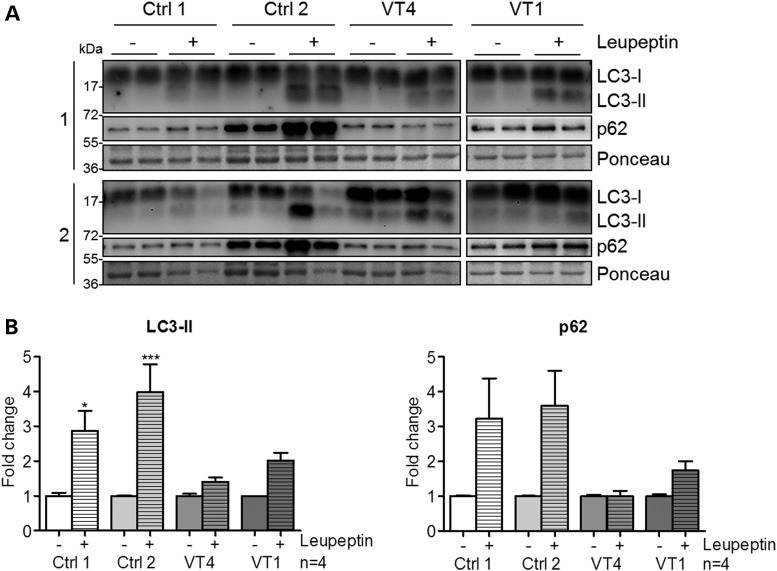
Gene mutations, mostly segregating with a dominant mode of inheritance, are important causes of dilated cardiomyopathy (DCM), a disease characterized by enlarged ventricular dimensions, impaired cardiac function, heart failure and high risk of death. Another myocardial abnormality often linked to gene mutations is left ventricular noncompaction (LVNC) characterized by a typical diffuse spongy appearance of the left ventricle. Here, we describe a large Bedouin family presenting with a severe recessive DCM and LVNC. Homozygosity mapping and exome sequencing identified a single gene variant that segregated as expected and was neither reported in databases nor in Bedouin population controls. The PLEKHM2 cDNA2156_2157delAG variant causes the frameshift p.Lys645AlafsTer12 and/or the skipping of exon 11 that results in deletion of 30 highly conserved amino acids. PLEKHM2 is known to interact with several Rabs and with kinesin-1, affecting endosomal trafficking. Accordingly, patients' primary fibroblasts exhibited abnormal subcellular distribution of endosomes marked by Rab5, Rab7 and Rab9, as well as the Golgi apparatus. In addition, lysosomes appeared to be concentrated in the perinuclear region, and autophagy flux was impaired. Transfection of wild-type PLEKHM2 cDNA into patient's fibroblasts corrected the subcellular distribution of the lysosomes, supporting the causal effect of PLEKHM2 mutation. PLEKHM2 joins LAMP-2 and BAG3 as a disease gene altering autophagy resulting in an isolated cardiac phenotype. The association of PLEKHM2 mutation with DCM and LVNC supports the importance of autophagy for normal cardiac function.


Figures

Figure 1.
Figure 1.
Family pedigree and identification of the homozygous intervals and the mutation. (A) Pedigree: three patients (II-1, II-2 and II-7) were genotyped. The segregation of the PLEKHM 2 mutation that creates a MwoI site is presented by the restriction analysis using this enzyme, under each individual. Digestion of the 687 bp amplicon resulted in 25, 73, 75, 83, 190 and 241 bp fragments; if the mutation is present, the 239 bp fragment is cleaved into 135 and 104 bp fragments. All patients were homozygous for the mutation; all available parents and all healthy siblings were heterozygotes, except sibling II-3 who was homozygous normal. (B) AgileMultiIdeogram showing the homozygous regions of chromosomes 1 and 11 shared among patients II-1, II-2 and II-7. The total length of the chromosomal homozygous regions was 15.3 Mb. (C) Sequence chromatogram of the PCR product of genomic DNA showing the single variant compatible as a causing mutation, a deletion of two nucleotides 1:16055171_16055172delAG (GRCh37/Hg 19) in exon 12. The chromatograms present the homozygous normal sequence (individual II-3), heterozygotes (Het) and mutant (Mut).
Figure 2.
Figure 2.
Expression of PLEKHM2 gene in patients' cells. (A) RT-PCR products. RNA was extracted from lymphoblastoid cells and fibroblasts of patient II-1 and from comparable cells of control individuals. PCR was performed on the cDNA using primers in exons 10 and 15, flanking exon 12 that contains the mutation and the PCR products were separated on 2% agarose gel. The patient cells exhibited two fragments in contrast to control cells that had only one. The large PCR product of the patient (579 bp) contains the deletion of AG in exon 12 and the smaller fragment of 488 bp that appears only in patients' cells results from skipping of exon 11. (B) Sequence chromatogram of the 581 bp PCR product of the control cells (upper), the 579 bp PCR product of the patient (middle) and the 448 bp PCR product showing the skipping of exon 11 (exon 12 joining directly to exon 10 is marked by darker letters). (C) Diagram of the domains of the protein and the location of the mutation. RUN-PH-WD detail of names of domains is according to the predictions by UniProt and literature (39). The mutant diagram presents the result of the frameshift mutation that will be created by the PLEKHM2 mRNA that produces the 579 bp RT-PCR product. The 12 amino acids marked in darker are created by the frameshift translation. The diagram of the mutant lacking exon 11 presents the amino acids flanking the deletion and in darker are the amino acids that are produced by the frameshift that is created by splicing exon 10–12 until the deletion of the AG nucleotide rescues the frameshift. (D) Sequence conservation of exon 11 and the first amino acids of exon 12 that are missing in the patients. The amino acids that are deleted by the mutation are shaded by gray. (E) PLEKHM2 protein is expressed in fibroblasts cells of patients II-1 and II-2 as demonstrated by western blot using an antibody to the C-terminal region. Control cells (C) are from fibroblasts from two control individuals as well as commercial fibroblasts. PLEKHM2 protein sample produced by expression of plasmid Pcmv-Myc-PLEKHM2 was loaded in parallel for use as size migration control (PLEKHM2). (F) Same as (E) with an antibody to the N-terminal region.
Figure 3.
Figure 3.
Subcellular distribution of organelles stained with Rabs and Golgi. Representative photographs of the distribution of the endosomes in primary fibroblasts of patient II-1 relative to control fibroblasts labeled with Rab 5, Rab7 and Rab9. Note perinuclear localization of the various rab in the patient' cells relative to control cells and fragmentation and spreading of the Golgi apparatus in patient' cells relative to control cells (comparable results were obtained for patient II-2, Supplementary Material, Fig. S3). Blue is DAPI staining for the nuclei, and green is AlexaFluor 488 Phalloidin used to mark the cells' borders. Dimension bar is 40 μm long. Relative distribution around nuclei, presented at the right side of the respective images, was calculated for a set intensity around the nucleus, and the area giving this intensity was calculated for each cell. The intensity was measured using ImageJ software (NIH) with a constant threshold. At least 20 cells of each patient and control with the specific staining were measured. Data are expressed as mean ± SD, and P-values are indicated at the right of the bars (Student's t-test).
Figure 4.
Figure 4.
Subcellular and size distribution of lysosomes. Lysosomes were visualized using antibodies to LAMP1. Acquirement of the images is as detailed in Figure 3. (A) A representative photograph of patient's cells shows a perinuclear localization of lysosomes, and the relative distribution around the nuclei is presented at the right. Dimension bar shows 40 μm. (B) Relative distribution around nuclei was analyzed as in Figure 3. (C) Analysis of lysosomal size indicates a higher proportion of large lysosomes in patient compared with control fibroblasts. Analysis was done using the ‘analyze particles’ plugin of ImageJ with size settings from 0–infinity and circularity 0–1.
Figure 5.
Figure 5.
Correction of the distribution of lysosomes in patient fibroblasts by overexpression of normal PLEKHM2 protein. (A) The fibroblasts of patient II-1 were transfected with PLEKHM2-myc plasmid and lysosomes visualized by LAMP1-specific antibodies as detailed in Figure 4. Myc was visualized by monoclonal antibody and secondary antibody was Cy5. The white arrows point cells transfected with the plasmid and the yellow arrow points untransfected cells. (B) Patient's cells in the same experiment that were not transfected. Dimension bar is 40 μm long.
Figure 6.
Figure 6.
Autophagic flux was impaired in patient fibroblasts. (A) Representative immunoblot performed on crude proteins from fibroblasts of two patients [VT1 (II-1) and VT4 (II-2)] and two controls. Cells were treated or not with 100 µM leupeptin for 24 h. Immunoblots were stained with antibodies against LC3 or p62. (B) Quantification of LC3-II and p62 normalized to Ponceau as a loading control. Treated samples were related to untreated controls for each cell line to compare the autophagic flux independent of varying basal expression levels among cell lines. Bars represent mean ± SEM with *P < 0.05 and ***P < 0.001 versus untreated control, one-way ANOVA with Bonferroni's post-test (n = 4 per group).
Figure 7.
Figure 7.
PLEKHM2 patient's fibroblasts migrate faster than control fibroblasts. Fibroblasts of patient II-1 and control fibroblasts were plated with 500 μm culture inserts. When the density reached ∼80%, the inserts were removed and fibroblasts movement was monitored using time-lapse live cell microscopy for 65–70 h. The DIC images were acquired every 15 min. The bridging time was defined as the time passed from the insert removal till formation of a continuous string of cells across the gap. The results represent four independent experiments each in quadruplicates. Data are expressed as mean ± SEM, P = 0.002 (Student's t-test).

References

    1. Yancy C.W., Jessup M., Bozkurt B., Butler J., Casey D.E. Jr, Drazner M.H., Fonarow G.C., Geraci S.A., Horwich T., Januzzi J.L. et al. (2013) 2013 ACCF/AHA guideline for the management of heart failure: a report of the American College of Cardiology Foundation/American Heart Association Task Force on practice guidelines. Circulation, 128, e240–e327. - PubMed
    1. McMurray J.J., Adamopoulos S., Anker S.D., Auricchio A., Bohm M., Dickstein K., Falk V., Filippatos G., Fonseca C., Gomez-Sanchez M.A. et al. (2012) ESC guidelines for the diagnosis and treatment of acute and chronic heart failure 2012: the task force for the diagnosis and treatment of Acute and Chronic Heart Failure 2012 of the European Society of Cardiology. Developed in collaboration with the Heart Failure Association (HFA) of the ESC. Eur. J. Heart Fail., 14, 803–869. - PubMed
    1. Piran S., Liu P., Morales A., Hershberger R.E. (2012) Where genome meets phenome: rationale for integrating genetic and protein biomarkers in the diagnosis and management of dilated cardiomyopathy and heart failure. J. Am. Coll. Cardiol., 60, 283–289. - PubMed
    1. Gregori D., Rocco C., Miocic S., Mestroni L. (2001) Estimating the frequency of familial dilated cardiomyopathy in the presence of misclassification errors. J. Appl. Stat., 28, 53–62.
    1. Petretta M., Pirozzi F., Sasso L., Paglia A., Bonaduce D. (2011) Review and metaanalysis of the frequency of familial dilated cardiomyopathy. Am. J. Cardiol., 108, 1171–1176. - PubMed

Publication types

Substances