. 2014:2014:327640.
doi: 10.1155/2014/327640. Epub 2014 Mar 25.

p21(WAF1/CIP1) Expression is Differentially Regulated by Metformin and Rapamycin

Affiliations

p21(WAF1/CIP1) Expression is Differentially Regulated by Metformin and Rapamycin

Zoltan Molnar et al. Int J Chronic Dis. 2014.

Abstract

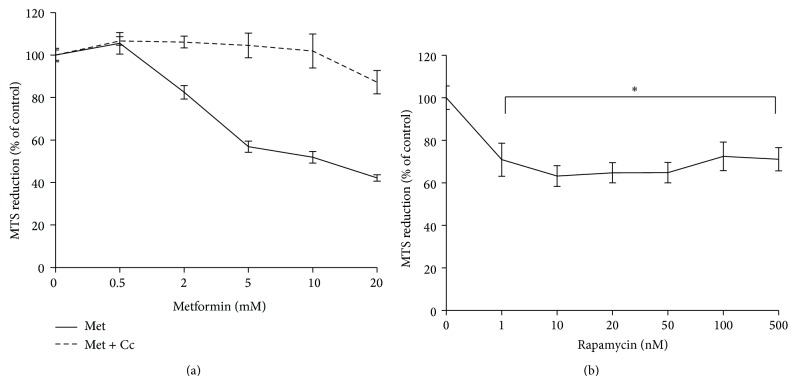
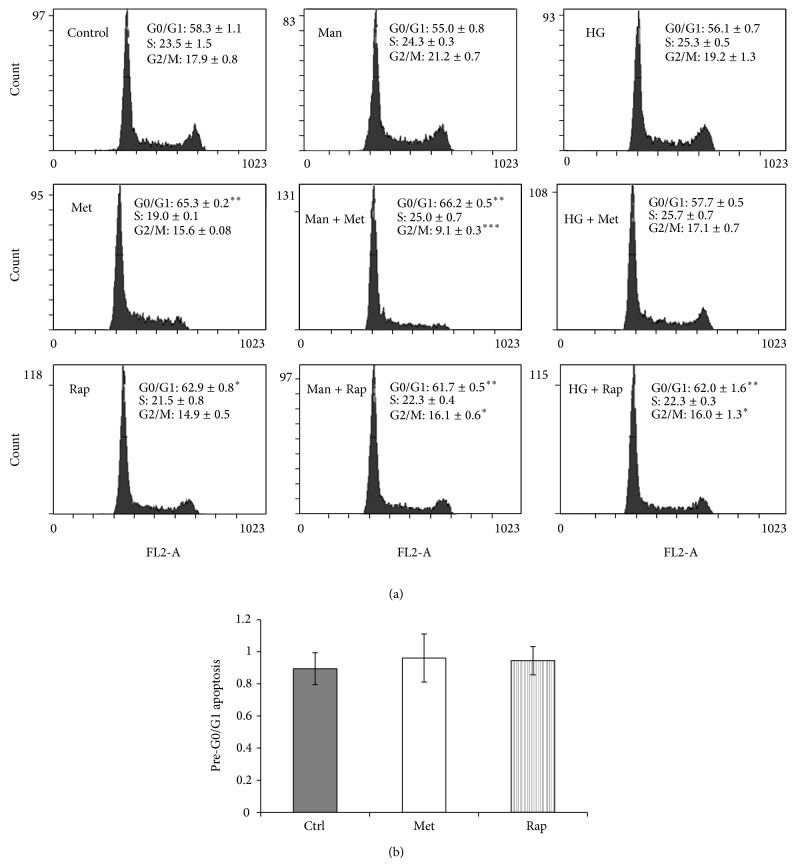
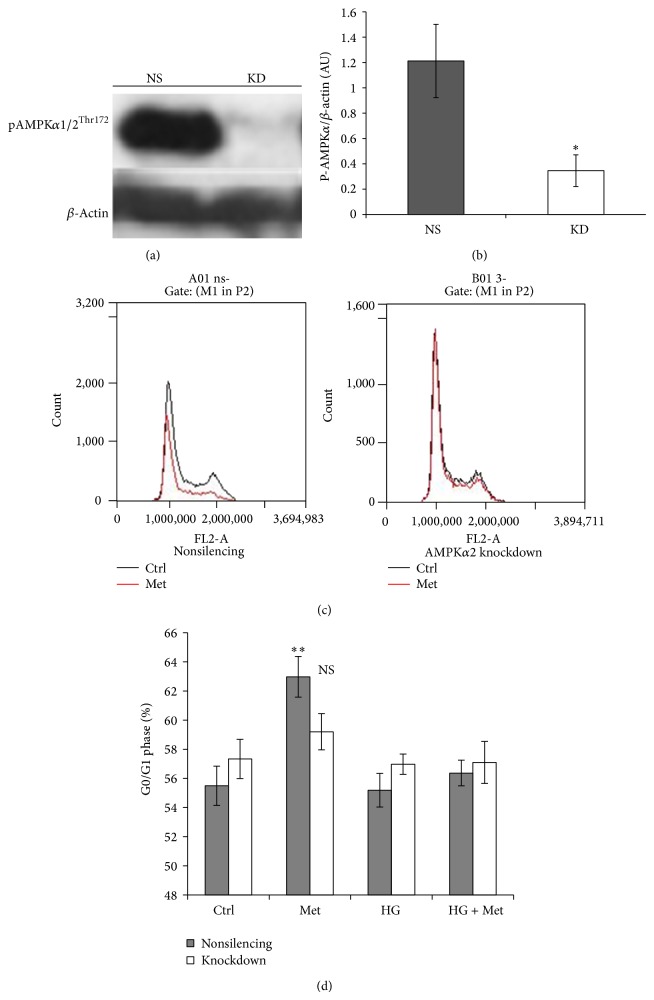
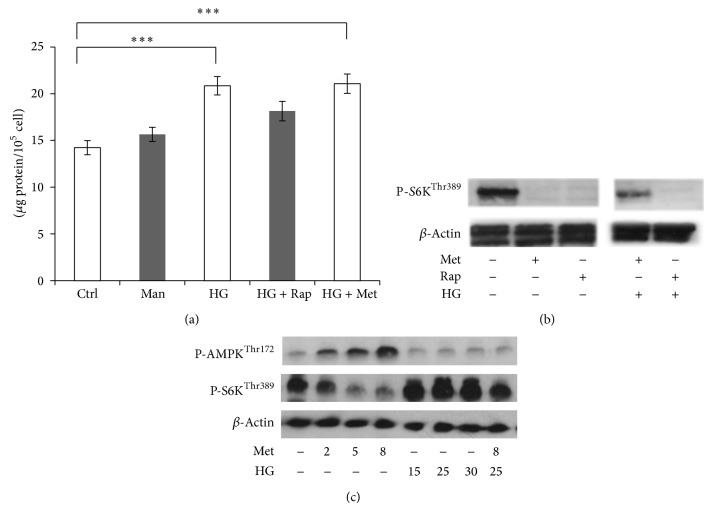
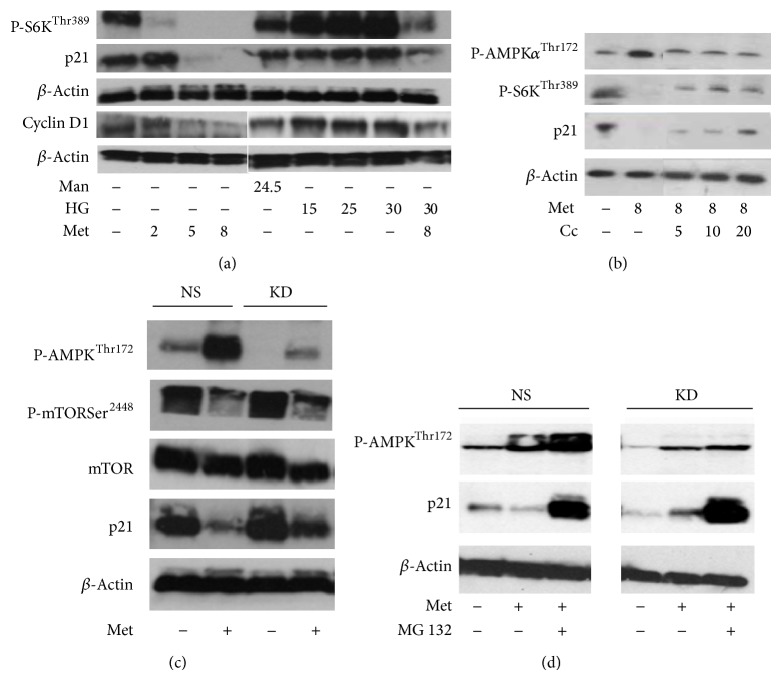
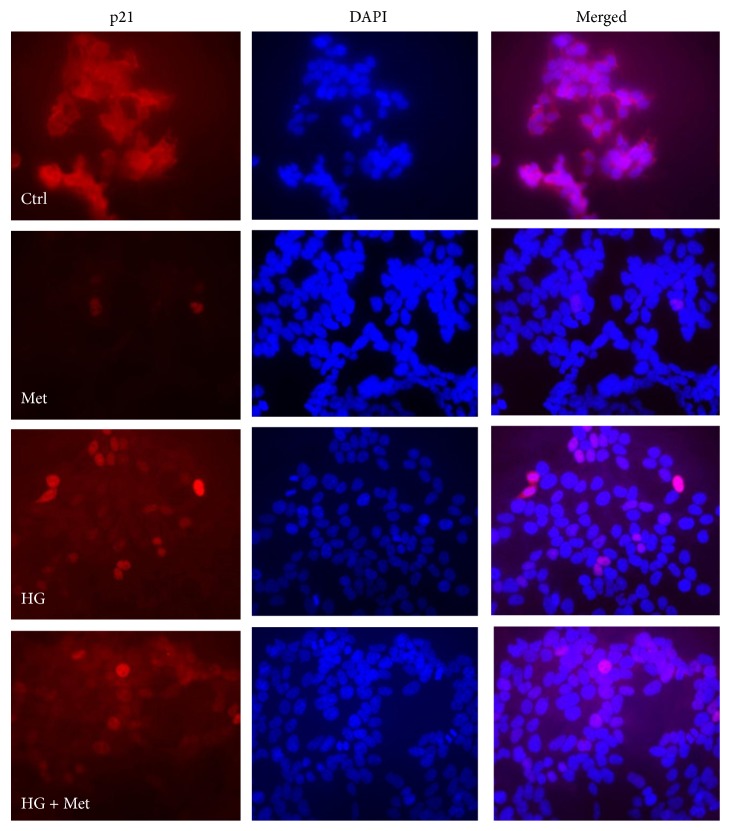
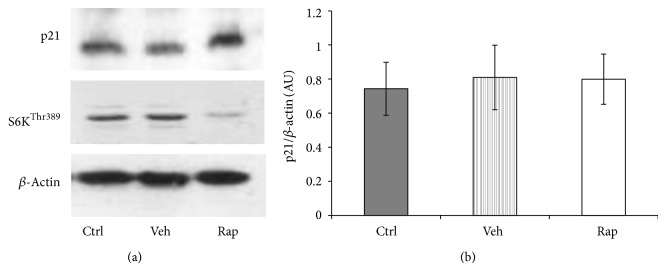
The mammalian target of rapamycin (mTOR) pathway plays an important role in the development of diabetic nephropathy and other age-related diseases. One of the features of DN is the elevated expression of p21(WAF1/CIP1). However, the importance of the mTOR signalling pathway in p21 regulation is poorly understood. Here we investigated the effect of metformin and rapamycin on mTOR-related phenotypes in cell lines of epithelial origin. This study reports that metformin inhibits high glucose-induced p21 expression. High glucose opposed metformin in regulating cell size, proliferation, and protein synthesis. These effects were associated with reduced AMPK activation, affecting downstream mTOR signalling. However, the inhibition of the mTOR pathway by rapamycin did not have a negative effect on p21 expression, suggesting that metformin regulates p21 upstream of mTOR. These findings provide support for the hypothesis that AMPK activation may regulate p21 expression, which may have implications for diabetic nephropathy and other age-related pathologies.


Figures

Figure 1
Figure 1
Inhibition of HEK293 cell proliferation by metformin (a) and rapamycin (b). 5000 cells per well were seeded in 96-well plates in MEM, cultured overnight and then exposed to increasing concentrations of metformin (Met) and rapamycin for 24 h. In combination with metformin treatments, 20 μM of compound C (Cc) was used. Cell proliferation was measured by the MTS cell proliferation assay. Composite results expressed as mean ± SEM of three independent experiments. (a) Mixed ANOVA: within subject effects of metformin concentration (F (5,85) = 52.48  P < 0.001), between subject effects of combination treatments with compound C F (1,17) = 52.15  P < 0.001. (b) * P < 0.05, compared with 100%.
Figure 2
Figure 2
(a) High glucose inhibits metformin-induced cell cycle arrest in G0/G1 phase. HEK293 cells were cultured in 5.5 mM (Control), 5.5 mM D-glucose + 24.5 mM mannitol (Man), and 30 mM D-glucose (HG) for 3 days. For the last 24 hours, metformin 8 mM (Met) or rapamycin 100 nM (Rap) was added. Representative flow cytometry panels containing data expressed as mean per cent cell cycle distribution + SEM. * P < 0.05; ** P < 0.01;  *** P < 0.001, relative to control. (b) Percentage of cells in pre-G0/G1 apoptosis. Data expressed as mean ± SEM.
Figure 3
Figure 3
Metformin does not induce cell cycle arrest in AMPKα2-deficient cells. (a) Representative western blot image showing the effect of AMPKα2 knockdown, nonsilencing control (NS), knockdown (KD). (b) Densitometry analysis of P-AMPKα expression (mean ± SEM, * P < 0.05). (c) Flow cytometry panels representing the effect of AMPKα2 knockdown on cell cycle arrest induced by 8 mM metformin (Met), compared with control (Ctrl). (d) High glucose treatment is comparable to AMPKα2-deficiency. The cells were cultured in 5.5 mM NG, 25 mM D-glucose (HG), for 48 h. For the last 24 h, 8 mM metformin (Met) was added in the indicated conditions. Data expressed as mean + SEM. NS P > 0.05; ** P < 0.01, compared with Ctrl.
Figure 4
Figure 4
(a) High glucose reverses metformin-induced cell size decrease in HEK293 cells. The cells were cultured with 5.5 mM (Ctrl) or 30 mM D-glucose (HG) for 3 days. For the last 24 h, 8 mM metformin or 100 nM rapamycin was added. Cell size was measured by flow cytometry. (b) AMPKα2-deficiency has no effect on metformin-mediated cell size reduction. The cells were incubated in 5.5 or 25 mM (HG) D-glucose for 3 days. For the last 24 h, metformin 8 mM (Met) was added. (c) Compound C reverses metformin-induced cell size reduction. HEK293 cells were cultured with or without (Ctrl) 8 mM Met. At the indicated concentrations, compound C (Cc) was added to the cells and cocultured with Met for 24 h. The viability of the cells was determined by propidium iodide staining. Vehicle effects of compound C were controlled by keeping the concentration of DMSO at 0.2% in the conditions. (d) Dose-dependent reversal of metformin-induced cell cycle arrest by compound C. HEK293 cells were exposed to the experimental conditions described in Figure 4(c). The results are expressed as mean ± SEM of three independent experiments. * P < 0.05; ** P < 0.01; # P < 0.001.
Figure 5
Figure 5
(a) Rapamycin and metformin differentially affect high glucose-induced total protein synthesis. HEK293 cells were incubated with 5.5 mM D-glucose (Ctrl), 5.5 mM D-glucose + 24.5 mM mannitol (Man), and 30 mM D-glucose (HG) for 48 h. For the last 24 h, 100 nM rapamycin (Rap) and 8 mM metformin (Met) were added to HG-treated conditions. The results expressed as mean + SEM of four independent experiments. *** P < 0.001. (b) Metformin (Met) and rapamycin (Rap) differentially affect S6K phosphorylation in high glucose pretreated HEK293 cells. The cells were incubated with 5.5 mM (NG) or 30 mM D-glucose (HG) for 3 days. For the last 24 h, 8 mM metformin (Met) or 100 nM rapamycin (Rap) was added. The expression of the indicated proteins was analysed by western blotting. (c) Western blot results of the effect of metformin and high glucose on AMPK and S6K phosphorylation. HEK293 cells were cultured in normal medium supplemented with 5.5 mM D-glucose. At the indicated final concentrations, (mM) metformin (Met) and D-glucose (HG) were added for 24 h and three days, respectively.
Figure 6
Figure 6
Western blot results indicate that AMPK inhibition is associated with the reversal of metformin-induced p21 downregulation in HEK293 cells. In these experiments, the protein level of P-S6KThr389, cyclin D1, P-AMPKα12Thr172, and P-mTORSer2448 was measured in order to confirm the expected effects of treatments. mTOR and β-actin were used to control equal protein loading. (a) The cells were treated with culture medium containing 5.5 mM D-glucose. Mannitol (Man) and D-glucose (HG) were added for three days at the indicated concentrations (mM). The cells were treated with metformin (Met) for 24 h at the indicated concentrations (mM). (b) Compound C (Cc) reverses metformin-induced p21 downregulation. The cells were treated with Met and Cc for 24 h at the indicated concentrations (mM and μM, resp.). (c) HEK293 cells stably transfected with shRNA expression plasmids targeting AMPKα2 (KD) or nonsilencing (NS) were cultured with or without 8 mM metformin for 18 h in whole cell culture medium. (d) The proteasome inhibitor carbobenzoxy-Leu-Leu-leucinal (MG132) prevents metformin-induced (Met) downregulation of p21. HEK293 cells stably transfected with shRNA expression plasmids targeting AMPKα2 (KD) or nonsilencing (NS) were cultured with or without 8 mM metformin and 10 μM MG132 overnight in whole cell culture medium. Vehicle effects were controlled by adding 0.05% DMSO to the conditions.
Figure 7
Figure 7
Detection of metformin-induced downregulation of p21 by immunocytochemistry. HEK293 cells were grown on glass slides until 60% confluence. The cells were cultured with 5.5 mM or 25 mM (HG) D-glucose for three days. For the last 24 h, 8 mM metformin (Met) was added to the indicated conditions. Original magnification ×400. Representative image of two independent experiments.
Figure 8
Figure 8
mTOR inhibition by rapamycin does not have a negative effect on p21 regulation. HEK293 cells were incubated with 100 nM rapamycin (Rap) for 24 h. Vehicle effects were controlled by 0.1% ethanol treatments. (a) Representative western blot image of p21 and β-actin expression. (b) Band intensity was quantified by densitometry. Data are arbitrary units (AU) expressed as means ± SEM (n = 6).
Figure 9
Figure 9
Metformin inhibits p21 expression in podocytes. The cells were treated with 5.5 mM or 25 mM D-glucose for three days. For the last 24 h, 8 mM metformin or 100 nM rapamycin were added. (a) Western blotting was performed for p21 and β-actin. (b) Band intensity was quantified by densitometry. Data are arbitrary units (AU) expressed as mean ± SEM (n = 3).

References

    1. Adeghate E., Schattner P., Dunn E. An update on the etiology and epidemiology of diabetes mellitus. Annals of the New York Academy of Sciences. 2006;1084(1):1–29. doi: 10.1196/annals.1372.029. - DOI - PubMed
    1. Cao Z., Cooper M. E. Pathogenesis of diabetic nephropathy. Journal of Diabetes Investigation. 2011;2(4):243–247. doi: 10.1111/j.2040-1124.2011.00131.x. - DOI - PMC - PubMed
    1. Kitada M., Zhang Z., Mima A., King G. L. Molecular mechanisms of diabetic vascular complications. Journal of Diabetes Investigation. 2010;1(3):77–89. doi: 10.1111/j.2040-1124.2010.00018.x. - DOI - PMC - PubMed
    1. Arya A., Aggarwal S., Yadav H. N. Pathogenesis of diabetic nephropathy. International Journal of Pharmacy and Pharmaceutical Sciences. 2010;2(4):24–29.
    1. Wolf G. Molecular mechanisms of diabetic mesangial cell hypertrophy: a proliferation of novel factors. Journal of the American Society of Nephrology. 2002;13(10):2611–2613. - PubMed

LinkOut - more resources