. 2015 Jul 27;2(4):ENEURO.0049-15.2015.
doi: 10.1523/ENEURO.0049-15.2015. eCollection 2015 Jul-Aug.

Inhibitory Plasticity Permits the Recruitment of CA2 Pyramidal Neurons by CA3

Affiliations

Inhibitory Plasticity Permits the Recruitment of CA2 Pyramidal Neurons by CA3

Kaoutsar Nasrallah et al. eNeuro. .

Erratum in

Abstract

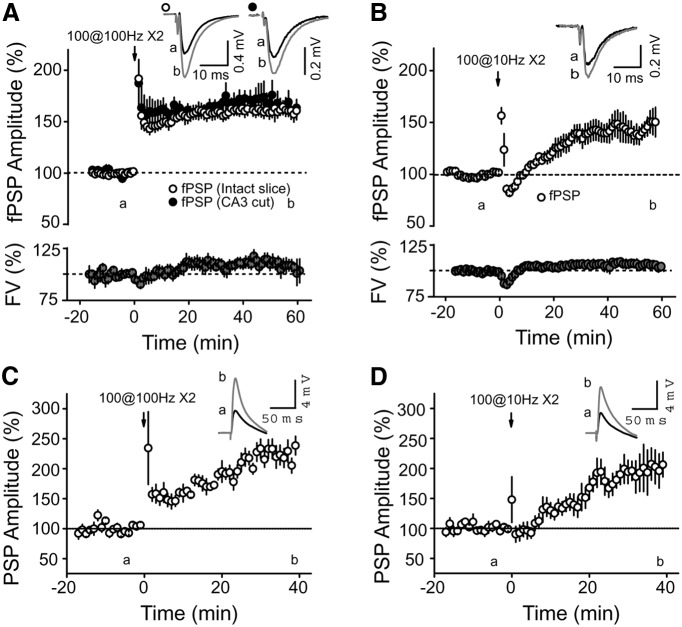
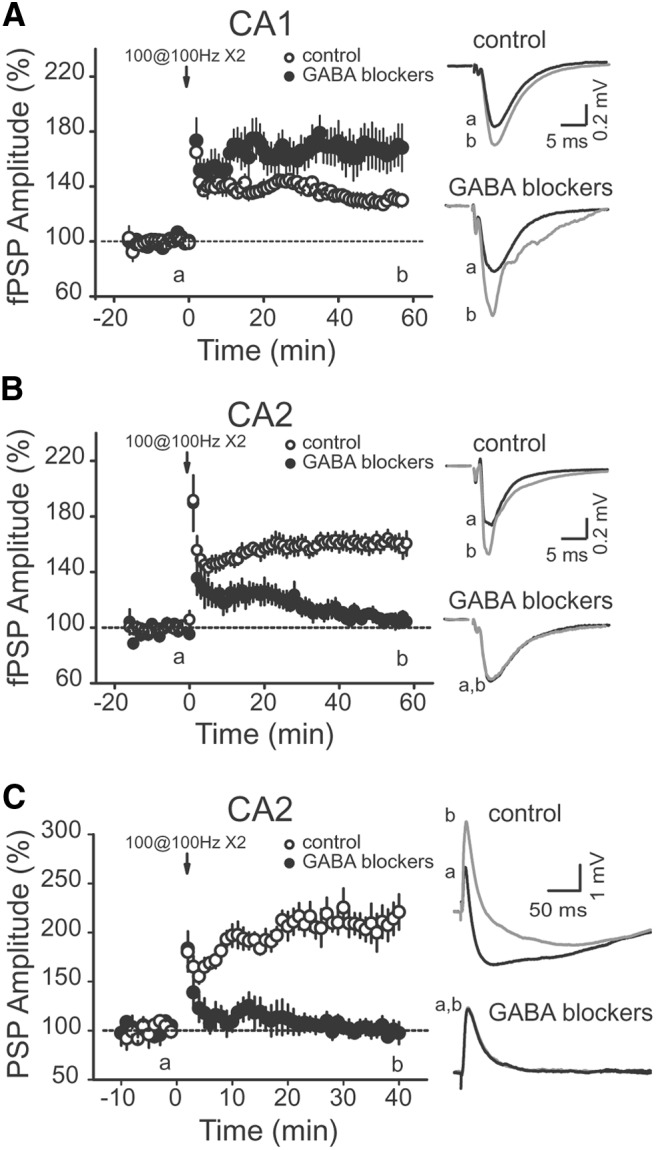
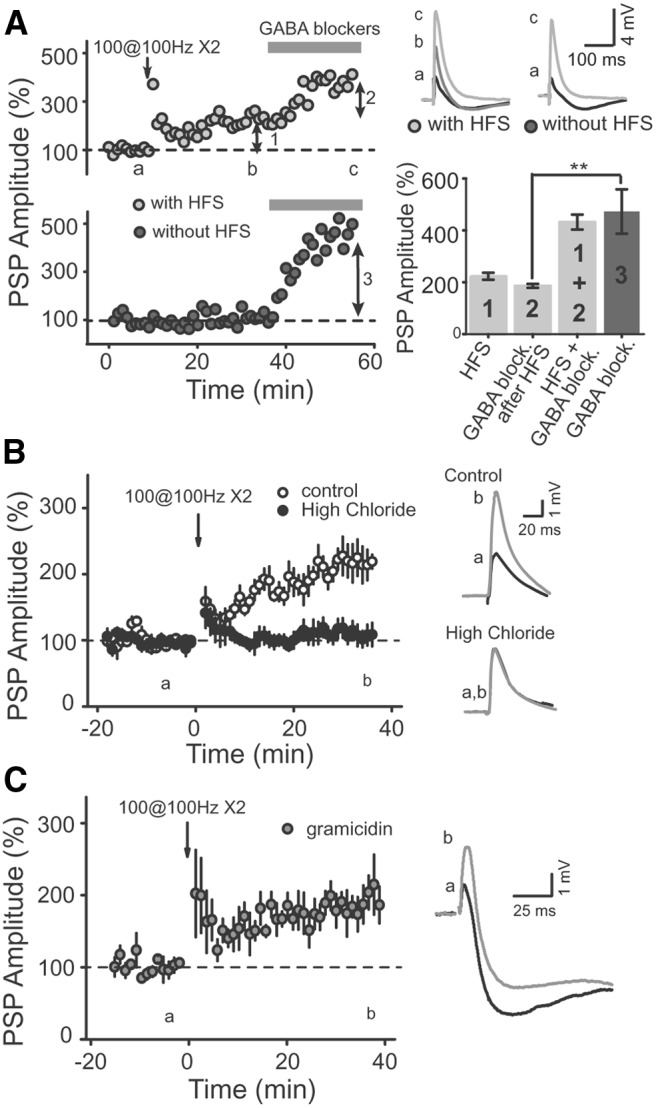
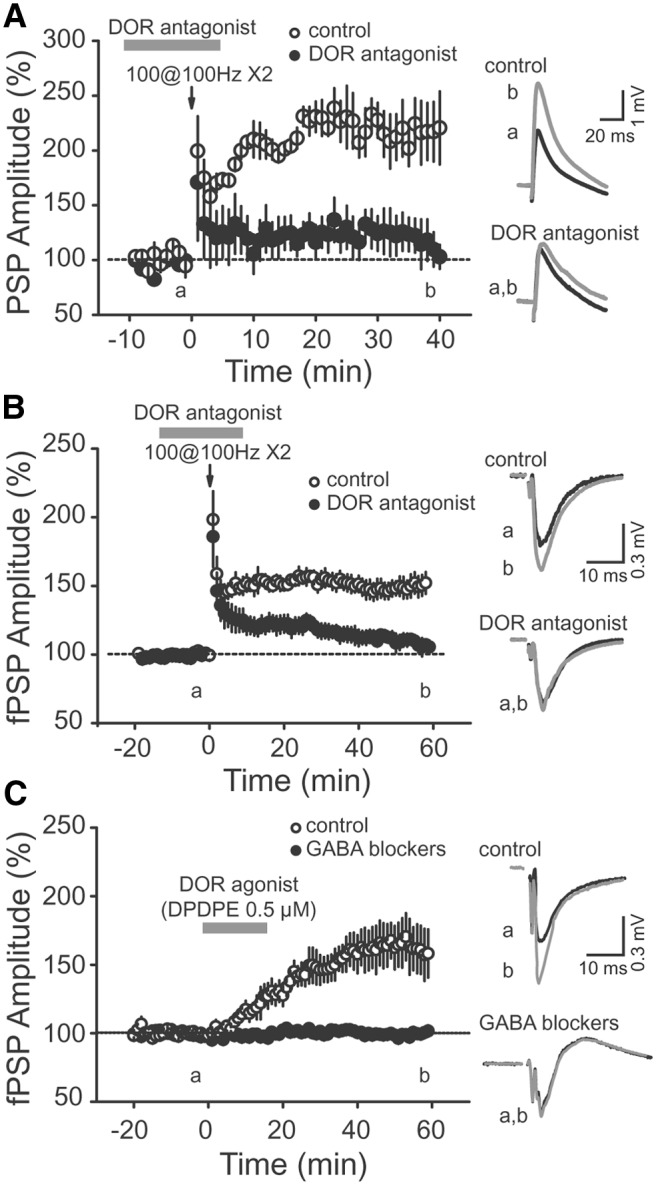
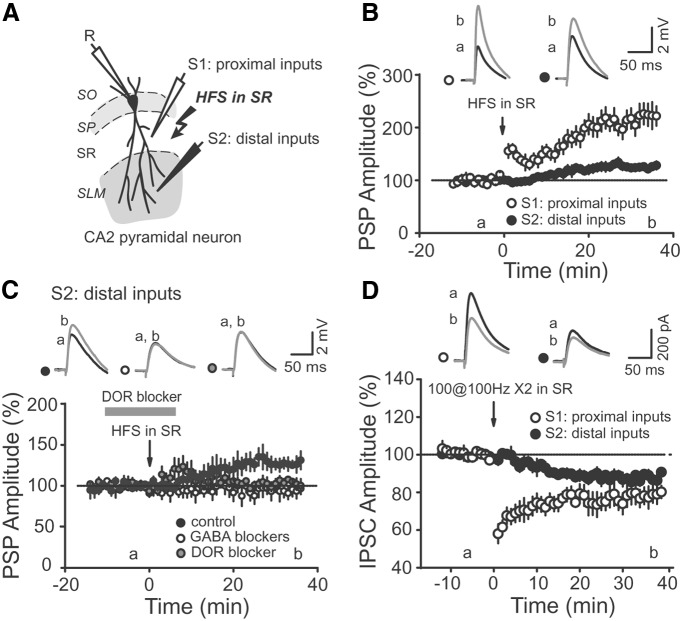
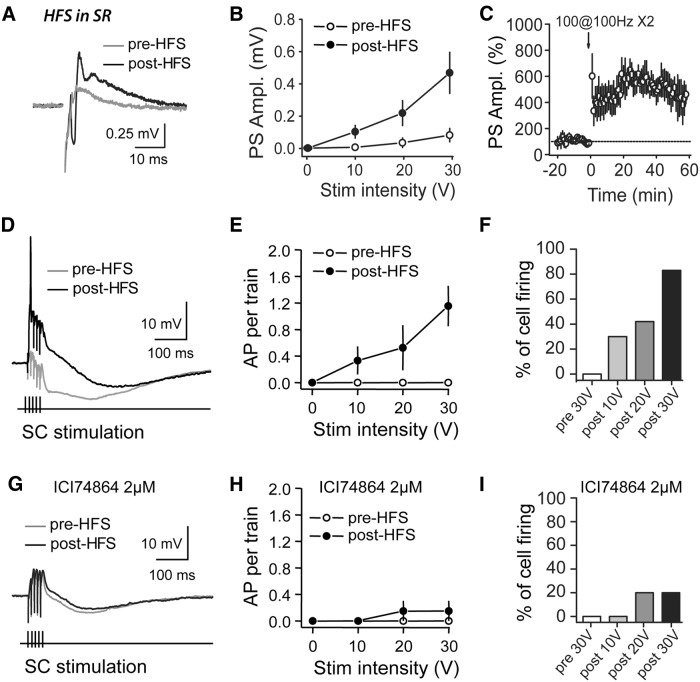
Area CA2 is emerging as an important region for hippocampal memory formation. However, how CA2 pyramidal neurons (PNs) are engaged by intrahippocampal inputs remains unclear. Excitatory transmission between CA3 and CA2 is strongly inhibited and is not plastic. We show in mice that different patterns of activity can in fact increase the excitatory drive between CA3 and CA2. We provide evidence that this effect is mediated by a long-term depression at inhibitory synapses (iLTD), as it is evoked by the same protocols and shares the same pharmacology. In addition, we show that the net excitatory drive of distal inputs is also increased after iLTD induction. The disinhibitory increase in excitatory drive is sufficient to allow CA3 inputs to evoke action potential firing in CA2 PNs. Thus, these data reveal that the output of CA2 PNs can be gated by the unique activity-dependent plasticity of inhibitory neurons in area CA2.

Keywords: area CA2; disinhibition; hippocampus; interneuron; long-term depression; δ opioid receptor.


Conflict of interest statement

The authors declare no competing financial interests.

Figures

Figure 1
Figure 1
HFS and 10 Hz stimulation induce a long-term increase of SC–CA2 PSP amplitude. A–D, Time course of the average normalized PSP amplitude obtained by extracellular recording (A, B) in CA2 SR or whole-cell current-clamp recording (C, D) of CA2 PNs, in response to SC stimulation. Both an HFS protocol (two sets of 100 pulses at 100 Hz; A: p < 0.00001, n = 10; C: p = 0.00018, n = 9) and a 10 Hz protocol (two sets of 100 pulses at 10 Hz; B: p = 0.0009, n = 8; D: p = 0.01596, n = 6) induce a long-term increase in the SC PSP amplitude in CA2. The fiber volley (FV; a measure of the number of axons firing an action potential) was not significantly increased after HFS (A; p = 0.06) or 10 Hz stimulation (B; p = 0.19). A also shows that making a cut between CA3 and CA2 does not affect the magnitude of the potentiation evoked by HFS (p = 0.59 with uncut slices, n = 5). Top right-hand corner in all panels, Averaged PSP traces of a representative experiment corresponding to time points before (a) and 60 min after (b; A, B) or 40 min after (b; C, D) the stimulation protocol. Error bars indicate the SEM in all panels.
Figure 2
Figure 2
The HFS-induced long-term potentiation of the PSP in CA2 is dependent on GABAergic transmission. A, Time course of average normalized fPSP amplitude recorded in CA1 SR in response to SC stimulation, showing that the HFS-induced increase in PSP amplitude in control conditions (open circles, p = 0.0020, n = 5) was facilitated in the continuous presence of the GABAA and GABAB receptor antagonists 1 μm SR 95531 and 2 μm CGP 55845 (filled circles, p = 0.0017, n = 8). B, C, In CA2, HFS does not trigger long-lasting increase in the SC PSP amplitude in the continuous presence of GABA receptor antagonists (filled circles; B, extracellular recordings, p = 0.09, n = 10; C, whole-cell recording, p = 0.6997, n = 10), but evokes a large and lasting increase in the PSP amplitude in control experiments (open circles; B, extracellular recordings, p < 0.00001, n = 10; C, whole-cell recording, p < 0.00001, n = 10). In all panels, averaged PSP traces corresponding to the time points before (a) and after (b) HFS are shown on the right. Error bars indicate the SEM in all panels.
Figure 3
Figure 3
HFS induces a long-term increase of the PSP amplitude in CA2 via a disinhibition mechanism. A, Two representative examples of the normalized PSP time course from CA2 PN whole-cell recordings illustrating how an HFS partially occludes the effect of GABAA and GABAB receptor blocker application on PSP amplitude. Top right, PSP traces corresponding to the time points before (a), after HFS (b), and after the application of GABA receptor blockers (c) with or without HFS. Bottom right, Summary histograms showing the percentage increase in the PSP amplitude induced by HFS applied alone (1), GABA receptor blocker application after HFS (2), HFS plus GABA blockers (1 + 2), and GABA blockers applied without previous HFS (3). B, Normalized CA2 PN SC PSPs recorded with either 7 mm (open circles) or 16 mm (closed circles) [Cl−] in the pipette solution. An HFS (arrow at time 0) fails to induce a long-lasting increase in PSP amplitude when a high concentration of chloride is used in the pipette solution (filled circled, p = 0.4103, n = 5) but evokes normal long-term potentiation in control experiments (open circles, p = 0.0047, n = 5). C, Summary graph of experiments performed using the gramicidin-perforated patch-recording configuration. HFS triggers an increase in PSP amplitude (p = 0.008, n = 5) similar to the one observed using whole-cell recording configuration.
Figure 4
Figure 4
The increase in SC PSP amplitude in CA2 PNs is dependent on DOR activation. A, An HFS does not trigger a long-term increase of the PSP amplitude recorded in CA2 PNs in the presence of 2 μm DOR competitive antagonist ICI 174864 (filled circles, n = 7, p = 0.135) but induces a normal long-term increase in the PSP magnitude in interleaved control experiments (open circles, p = 0.005, n = 5). B, Time course of normalized fPSP amplitude recorded in CA2 SR showing how the application of a DOR antagonist (ICI 174864 or naltrindole 0.1 μm) during HFS (filled circles, p = 0.0822 and p = 0.0006 with the absence of ICI 74864, n = 8) prevented the induction of a lasting increase in the fPSP amplitude that was observed in the absence of drug application (open circle). Averaged PSP traces corresponding to the time points before (a) and after (b) HFS performed in control conditions (top) or in the presence of ICI 174864 (bottom) are shown on the right. C, Application of 0.5 μm DOR-selective agonist (DPDPE) is sufficient to induce a long-lasting increase in the fPSP amplitude recorded in SR of CA2 in the absence (open circles, p = 0.02, n = 5) but not in the presence (filled circles, p = 0.55679, n = 6) of GABAA and GABAB receptor blockers. Right, Example fPSP traces corresponding to the time points before (a) and after (b) the application of DPDPE in the absence of (top) or in the continuous presence of (bottom) the GABAA and GABAB receptor blockers. Error bars indicate the SEM in all panels.
Figure 5
Figure 5
Stimulation in SR induces a heterosynaptic iLTD and increases distal excitatory drive onto CA2 PNs. A, Cartoon illustrating the arrangement of the stimulating recording electrodes in SR and SLM. B, Average PSP amplitudes of SR (open circles) and SLM (closed circles) inputs after HFS stimulation in SR. Note that both SR and SLM inputs are potentiated after the HFS (p = 0.00035 for SR inputs, p = 0.0017 for SLM inputs, n = 10), but only SR inputs show a rapid post-tetanic increase in amplitude. Top, Averaged PSP traces corresponding to the time points before (a) and after (b) HFS. C, The increase in distally evoked PSP after stimulation in SR was blocked by GABAA and GABAB receptor blockers (open circles, p = 0.52, n = 8) and by the DOR antagonist naltrindol (gray circles, p = 0.31, n = 6). D, Average amplitude of IPSCs evoked by stimulation in SR and SLM after HFS in SR. Note that both inputs express an inhibitory LTD after HFS in SR (p = 0.006 for SR inputs; p = 0.003 for SLM inputs, n = 6).
Figure 6
Figure 6
HFS in SR allows CA3 inputs to evoke action potential firing in CA2 PNs. A, Traces of extracellular recordings in the CA2 pyramidal layer in response to a 20 V stimulation of SC inputs, before (gray traces) and after an HFS (black traces), illustrating how HFS induces an increase in the PS amplitude (negative peak). B, Average PS amplitude as a function of stimulation intensity before (open circle) and after (filled circle) HFS (with 20 V stimulation: p = 0.01, n = 5; with 30 V stimulation: p = 0.006, n = 5). C, Time course of average normalized PS amplitude recorded in CA2 pyramidal layer in response to a 20 V stimulation of SC inputs, showing a long-lasting increase in PS amplitude after HFS (p = 0.01, n = 5). D, Traces of whole-cell current-clamp recordings in a CA2 pyramidal cell in response to a train of stimulations (five pulses at 100 Hz) of SC inputs, illustrating how APs can be evoked in CA2 neurons after HFS (black traces) but not before HFS (gray traces). E, Average number of APs per train at different stimulation intensities, showing how a five-pulse train at 100 Hz of the SC inputs does not trigger APs in CA2 PNs before HFS (open circles) but induces APs after HFS (filled circles, with 30 V stimulation: from 0 to 1.15 ± 0.3 APs per train after HFS, p = 0.012, n = 6). F, An HFS increases the percentage of CA2 PNs firing at least one AP during the train (with 30 V stimulation: from 0% to 80% of cells firing APs). G, Traces of whole-cell current-clamp recordings in a CA2 PN in response to a stimulation train (five pulses at 100 Hz) of SC inputs in the presence of the DOR antagonist ICI 174864 (2 μm), illustrating how the application of ICI 174864 prevents the induction of APs in CA2 PNs after HFS (black traces). H, Average number of APs per train at different stimulation intensities in the presence of the DOR antagonist before HFS (open circles; with 0–30 V stimulations: 0 APs per train) and after HFS (filled circles; with 30 V stimulation: 0.15 ± 0.15 AP per train after HFS, p = 0.37, n = 5). I, In the presence of ICI 174864, HFS does not induce a large increase in the percentage of CA2 PNs firing at least one AP during the train (with 10 V stimulation: 0% of cells firing APs before and after HFS; with 20 and 30 V stimulation: from 0% to 20% of cells firing APs). Error bars indicate the SEM in all panels.

Similar articles

Cited by

References

    1. Andrioli A, Alonso-Nanclares L, Arellano J, DeFelipe J (2007) Quantitative analysis of parvalbumin-immunoreactive cells in the human epileptic hippocampus. Neuroscience 149:131–143. 10.1016/j.neuroscience.2007.07.029 - DOI - PubMed
    1. Basu J, Srinivas KV, Cheung SK, Taniguchi H, Huang ZJ, Siegelbaum SA (2013) A cortico-hippocampal learning rule shapes inhibitory microcircuit activity to enhance hippocampal information flow. Neuron 79:1208–1221. 10.1016/j.neuron.2013.07.001 - DOI - PMC - PubMed
    1. Benes FM (1999) Evidence for altered trisynaptic circuitry in schizophrenic hippocampus. Biol Psychiatry 46:589–599. - PubMed
    1. Benes FM, Kwok EW, Vincent SL, Todtenkopf MS (1998) A reduction of nonpyramidal cells in sector CA2 of schizophrenics and manic depressives. Biol Psychiatry 44:88–97. - PubMed
    1. Botcher NA, Falck JE, Thomson AM, Mercer A (2014) Distribution of interneurons in the CA2 region of the rat hippocampus. Front Neuroanat 8:104. 10.3389/fnana.2014.00104 - DOI - PMC - PubMed

LinkOut - more resources