. 2015 Aug 31;2(4):ENEURO.0068-15.2015.
doi: 10.1523/ENEURO.0068-15.2015. eCollection 2015 Jul-Aug.

Large-Scale Phenotype-Based Antiepileptic Drug Screening in a Zebrafish Model of Dravet Syndrome

Affiliations

Large-Scale Phenotype-Based Antiepileptic Drug Screening in a Zebrafish Model of Dravet Syndrome

Matthew T Dinday et al. eNeuro. .

Abstract

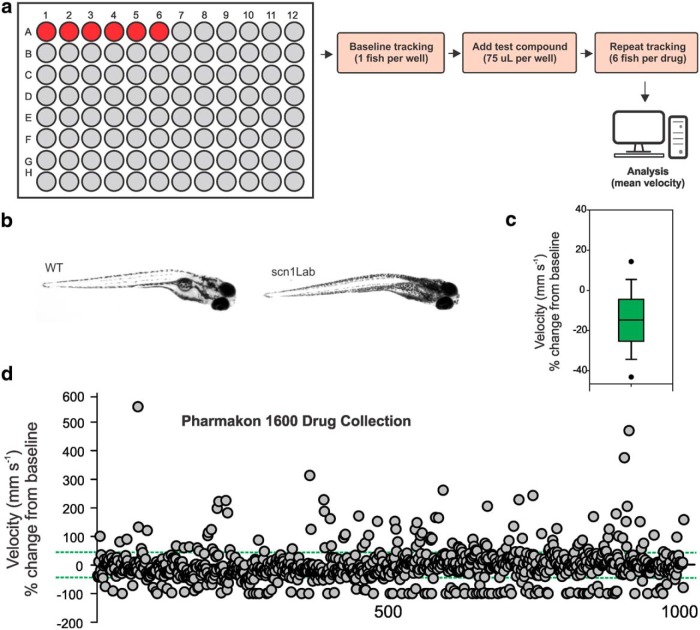
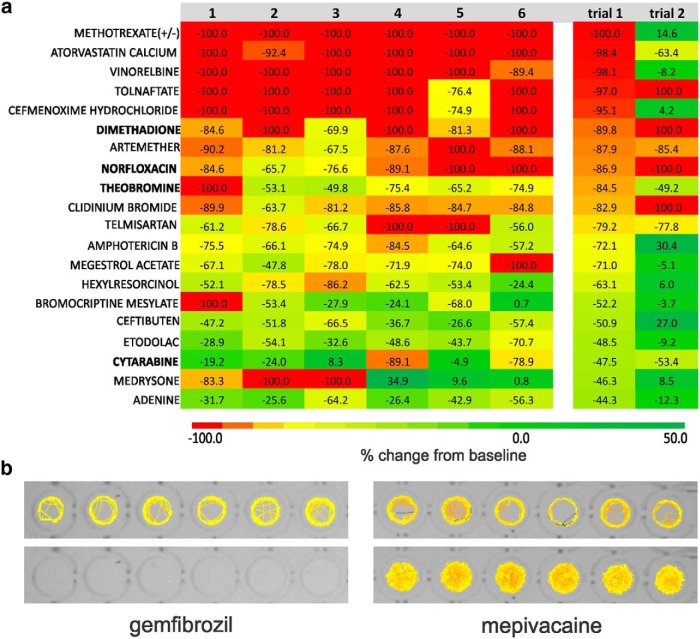
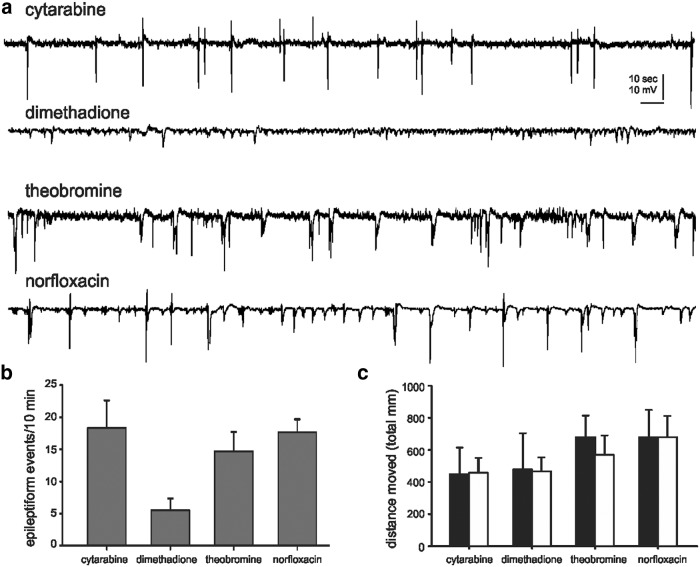
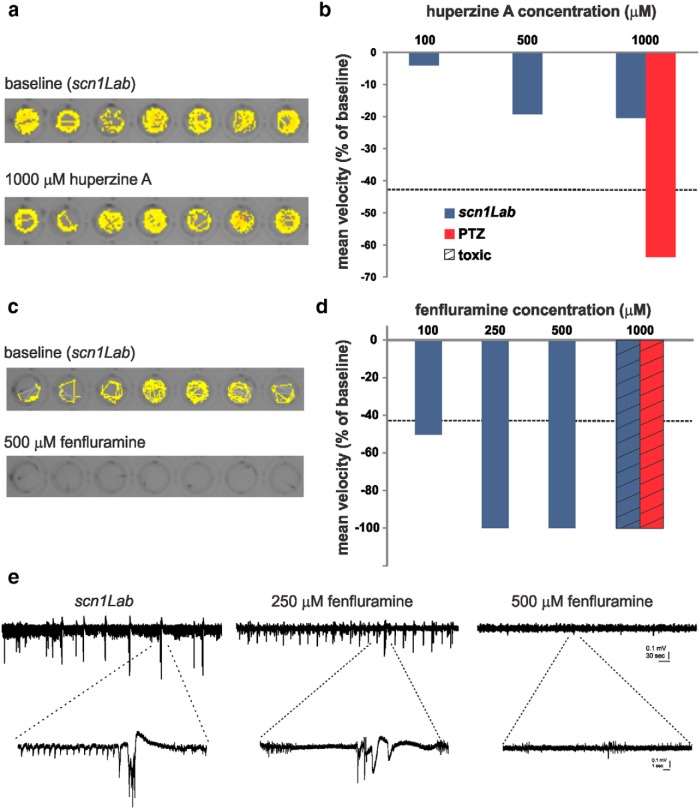
Mutations in a voltage-gated sodium channel (SCN1A) result in Dravet Syndrome (DS), a catastrophic childhood epilepsy. Zebrafish with a mutation in scn1Lab recapitulate salient phenotypes associated with DS, including seizures, early fatality, and resistance to antiepileptic drugs. To discover new drug candidates for the treatment of DS, we screened a chemical library of ∼1000 compounds and identified 4 compounds that rescued the behavioral seizure component, including 1 compound (dimethadione) that suppressed associated electrographic seizure activity. Fenfluramine, but not huperzine A, also showed antiepileptic activity in our zebrafish assays. The effectiveness of compounds that block neuronal calcium current (dimethadione) or enhance serotonin signaling (fenfluramine) in our zebrafish model suggests that these may be important therapeutic targets in patients with DS. Over 150 compounds resulting in fatality were also identified. We conclude that the combination of behavioral and electrophysiological assays provide a convenient, sensitive, and rapid basis for phenotype-based drug screening in zebrafish mimicking a genetic form of epilepsy.

Keywords: antiepileptic; drug discovery; epilepsy; high throughput; pharmacology; zebrafish.


Conflict of interest statement

The authors declare no competing financial interests.

Figures

Figure 1.
Figure 1.
Locomotion assay to identify drugs that rescue the scn1Lab mutant epilepsy phenotype. a, Schematic of the phenotype-based screening process. Chemical libraries can be coded and aliquoted in small volumes (75 µL) into individual wells containing one mutant fish. The 96-well microplate is arranged so that six fish are tested per drug; with one row of six fish maintained as an internal control (red circles) on each plate. b, Representative images for WT and scn1Lab mutant zebrafish larvae at 5 dpf. Note the morphological similarity but darker pigmentation in mutant larvae. c, Box plot of mean velocity (in millimeters per second) for two consecutive recordings of mutant larvae in embryo media. Experiments were performed by first placing the mutant larvae in embryo media and obtaining a baseline locomotion response; embryo media was then replaced with new embryo media (to mimic the procedure used for test compounds), and a second locomotion response was obtained. The percentage change in velocity from baseline (recording 1) versus experimental model (recording 2) is shown. In the box plot, the bottom and top of the box represent the 25th percentile and the 75th percentile, respectively. The line across the box represents the median value, and the vertical lines encompass the entire range of values. This plot represents normal changes in tracking activity in the absence of a drug challenge. d, Plot of locomotor seizure behavior for scn1Lab mutants at 5 dpf for the 1012 compounds tested. Threshold for inhibition of seizure activity (positive hits) was set as a reduction in mean swim velocity of ≥44%; the threshold for a proconvulsant or hyperexcitable effect was set at an increase in the mean swim velocity of ≥44% (green dashed lines).
Figure 2.
Figure 2.
Positive hits identified in the locomotion assay. a, Heat map showing the results of individual zebrafish trials (1-6) for compounds tested at a concentration of 100 µm in the locomotion-tracking assay. Raw data values for individual fish are shown within the color-coded boxes for one sample trial. Mean velocity data are shown at right for “trial 1” and “trial 2”; six fish per trial. Note: only drugs highlighted in bold type were classified as positive nontoxic hits in two independent trials and moved on to further testing. b, Representative raw locomotion data plots for six individual scn1Lab mutant larvae at baseline (top) and following the addition of a compound resulting in fatality (bottom, gemfibrozil) or hyperactivity (bottom, mepivacaine). Movement is color coded, with low-velocity movements shown in yellow, and high velocity movements shown in red.
Figure 3.
Figure 3.
Electrophysiology assay to identify drugs that rescue the scn1Lab mutant epilepsy phenotype. a, Representative field electrode recording epochs (5 min in duration) are shown for the “positive” compounds identified in the locomotion assay. All recordings were obtained with an electrode placed in the forebrain of agar-immobilized scn1Lab larvae that was previously tested in the locomotion assay. A suppression of epileptiform electrographic discharge activity was noted in mutants exposed to dimethadione. b, Bar plot showing the mean number of epileptiform events in a 10 min recording epoch for scn1Lab larvae exposed to cytarabine (N = 6), dimethadione (N = 6), theobromine (N = 6), and norfloxacin (N = 6). The mean ± SEM is shown. The fish shown were tested in the locomotion assay first. c, Bar plot showing the total distance traveled before (black bars) and after (white bars) exposure to a test compound; 10 min recording epoch and six fish per drug. The mean ± SEM is shown.
Figure 4.
Figure 4.
Evaluation of putative antiepileptic drugs in scn1Lab mutants. a, Locomotion tracking plots for scn1Lab zebrafish at baseline and following huperzine A administration. Total movement is shown for a 10 min recording epoch. b, Plot showing the change in mean velocity for three different huperzine A concentrations (blue bars). Each bar is the mean change for six fish. The threshold for a positive hit is shown as a dashed line. WT fish exposed to PTZ and huperzine A are shown in red (N = 7). c, d, Same for fenfluramine. Note that 1 mm fenfluramine was toxic, as indicated. e, Representative field recordings from scn1Lab mutant larvae at 5 dpf. Electrographic activity is shown for a 5 min recording epoch (top traces); high-resolution traces are shown below, as indicated. Note that abnormal burst discharge activity persists in scn1Lab mutants exposed to 250 µm fenfluramine. The fish shown were tested in the locomotion assay first.

References

    1. Ali S, Champagne DL, Spaink HP, Richardson MK (2011) Zebrafish embryos and larvae: a new generation of disease models and drug screens. Birth Defects Res C Embryo Today 93:115-133. 10.1002/bdrc.20206 - DOI - PubMed
    1. Azarbayjani F, Danielsson BR (2002) Embryonic arrhythmia by inhibition of HERG channels: a common hypoxia-related teratogenic mechanism for antiepileptic drugs? Epilepsia 43:457-468. - PubMed
    1. Baraban SC, Dinday MT, Hortopan GA (2013) Drug screening in Scn1a zebrafish mutant identifies clemizole as a potential Dravet syndrome treatment. Nat Commun 4:2410. 10.1038/ncomms3410 - DOI - PMC - PubMed
    1. Baraban SC, Taylor MR, Castro PA, Baier H (2005) Pentylenetetrazole induced changes in zebrafish behavior, neural activity and c-fos expression. Neuroscience 131:759-768. 10.1016/j.neuroscience.2004.11.031 - DOI - PubMed
    1. Baumann MH, Ayestas MA, Dersch CM, Brockington A, Rice KC, Rothman RB (2000) Effects of phentermine and fenfluramine on extracellular dopamine and serotonin in rat nucleus accumbens: therapeutic implications. Synapse 36:102-113. 10.1002/(SICI)1098-2396(200005)36:2<102::AID-SYN3>3.0.CO;2-# - DOI - PubMed