. 2015 Oct 14;10(10):e0140405.
doi: 10.1371/journal.pone.0140405. eCollection 2015.

Invariant Characteristics of Carcinogenesis

Affiliations

Invariant Characteristics of Carcinogenesis

Simon Sherman et al. PLoS One. .

Abstract

Carcinogenic modeling is aimed at mathematical descriptions of cancer development in aging. In this work, we assumed that a small fraction of individuals in the population is susceptible to cancer, while the rest of the population is resistant to cancer. For individuals susceptible to cancer we adopted methods of conditional survival analyses. We performed computational experiments using data on pancreatic, stomach, gallbladder, colon and rectum, liver, and esophagus cancers from the gastrointestinal system collected for men and women in the SEER registries during 1975-2009. In these experiments, we estimated the time period effects, the birth cohort effects, the age effects and the population (unconditional) cancer hazard rates. We also estimated the individual cancer presentation rates and the individual cancer resistance rates, which are, correspondingly, the hazard and survival rates conditioned on the susceptibility to cancer. The performed experiments showed that for men and women, patterns of the age effects, the individual cancer presentation rates and the individual cancer resistance rates are: (i) intrinsic for each cancer subtype, (ii) invariant to the place of living of the individuals diagnosed with cancer, and (iii) well adjusted for the modifiable variables averaged at a given time period. Such specificity and invariability of the age effects, the individual cancer presentation rates and the individual cancer resistance rates suggest that these carcinogenic characteristics can be useful for predictive carcinogenic studies by methods of inferential statistics and for the development of novel strategies for cancer prevention.


Conflict of interest statement

Competing Interests: The authors have declared that no competing interests exist.

Figures

Fig 1
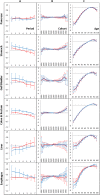
Fig 1. Time-period effects (A panel), birth-cohort effects (B panel) and age-at-diagnosis effects (C panel) for men who have lived in the Entire region and diagnosed with GI cancers during 1975–2009.
Fig 2
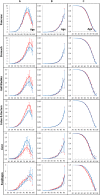
Fig 2. Time-period effects (A panel), birth-cohort effects (B panel) and age-at-diagnosis effects (C panel) for women who have lived in the Entire region and diagnosed with GI cancers during 1975–2009.
Fig 3
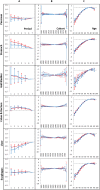
Fig 3. Population cancer hazard rates (A panel), individual cancer presentation rates (B panel), and individual cancer resistance rates (C panel) for men who have lived in the Entire region and diagnosed with GI cancers during 1975–2009.
Fig 4
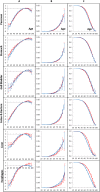
Fig 4. Population cancer hazard rates (A panel), individual cancer presentation rates (B panel), and individual cancer resistance rates (C panel) for women who have lived in the Entire region and diagnosed with GI cancers during 1975–2009.
Fig 5
Fig 5. Time-period effects (A panel), birth-cohort effects (B panel) and age-at-diagnosis effects (C panel) for men who have lived in the Eastern (blue lines) and Western (red lines) geographic regions and diagnosed with GI cancers during 1975–2009.
Fig 6
Fig 6. Time-period effects (A panel), birth-cohort effects (B panel) and age-at-diagnosis effects (C panel) for women who have lived in the Eastern (blue lines) and Western (red lines) geographic regions and diagnosed with GI cancers during 1975–2009.
Fig 7
Fig 7. Population cancer hazard rates (A panel), individual cancer presentation rates (B panel), and individual cancer resistance rates (C panel) for men who have lived in the Eastern (blue lines) and Western (red lines) geographic regions and diagnosed with GI cancers during 1975–2009.
Fig 8
Fig 8. Population cancer hazard rates (A panel), individual cancer presentation rates (B panel), and individual cancer resistance rates (C panel) for women who have lived in the Eastern (blue lines) and Western (red lines) geographic regions and diagnosed with GI cancers during 1975–2009.
Fig 9
Fig 9. Age effects (A panel), individual cancer presentation rates (B panel) and individual cancer resistance rates (C panel) for men (blue lines) and women (red lines) diagnosed with GI cancers.

References

    1. Armitage P, Doll R (1954) The age distribution of cancer and a multistage theory of carcinogenesis. Br J Cancer 8:1–12. - PMC - PubMed
    1. Luebeck EG, Moolgavkar SH (2002) Multistage carcinogenesis and the incidence of colorectal cancer. Proc Natl Acad Sci U S A 99: 15095–100. - PMC - PubMed
    1. Meza R, Jeon J, Moolgavkar SH, Luebeck EG (2008) Age-specific incidence of cancer: phases, transitions, and biological implications. Proc Natl Acad Sci U S A 105: 16284–9. 10.1073/pnas.0801151105 - DOI - PMC - PubMed
    1. Luebeck GE, Curtius K, Jeon J, Hazelton WD (2013) Impact of tumor progression on cancer incidence curves. Cancer Res 73: 1086–96. 10.1158/0008-5472.CAN-12-2198 - DOI - PMC - PubMed
    1. Schöllnberger H, Beerenwinkel N, Hoogenveen R, Vineis P (2010) Cell selection as driving force in lung and colon carcinogenesis. Cancer Res 70:6797–803. 10.1158/0008-5472.CAN-09-4392 - DOI - PMC - PubMed

Publication types

LinkOut - more resources