. 2015 Oct 14:6:8510.
doi: 10.1038/ncomms9510.

Notch signal strength controls cell fate in the haemogenic endothelium

Affiliations

Notch signal strength controls cell fate in the haemogenic endothelium

Leonor Gama-Norton et al. Nat Commun. .

Erratum in

Abstract

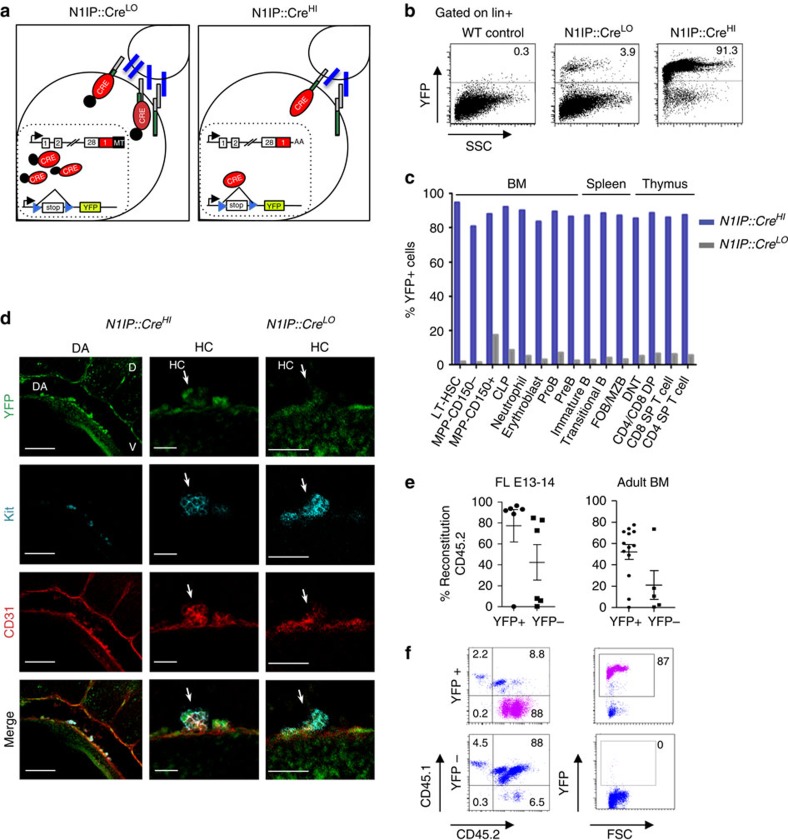
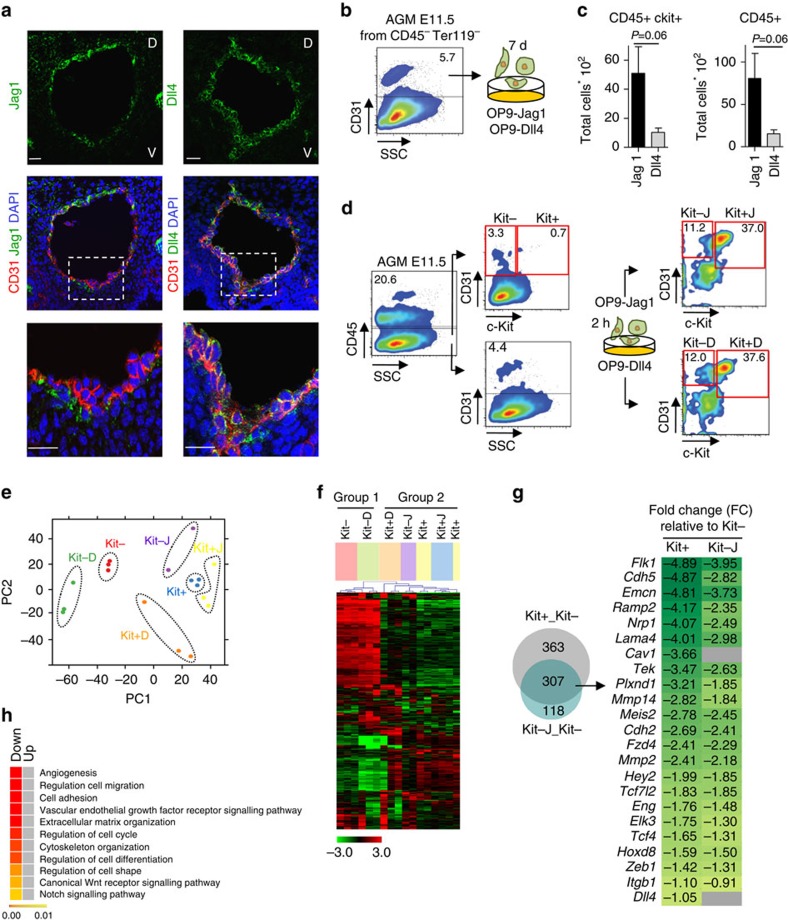
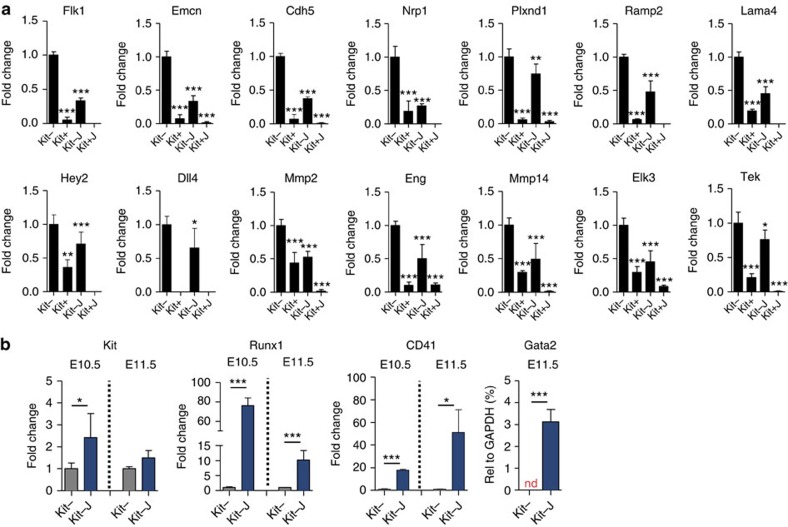
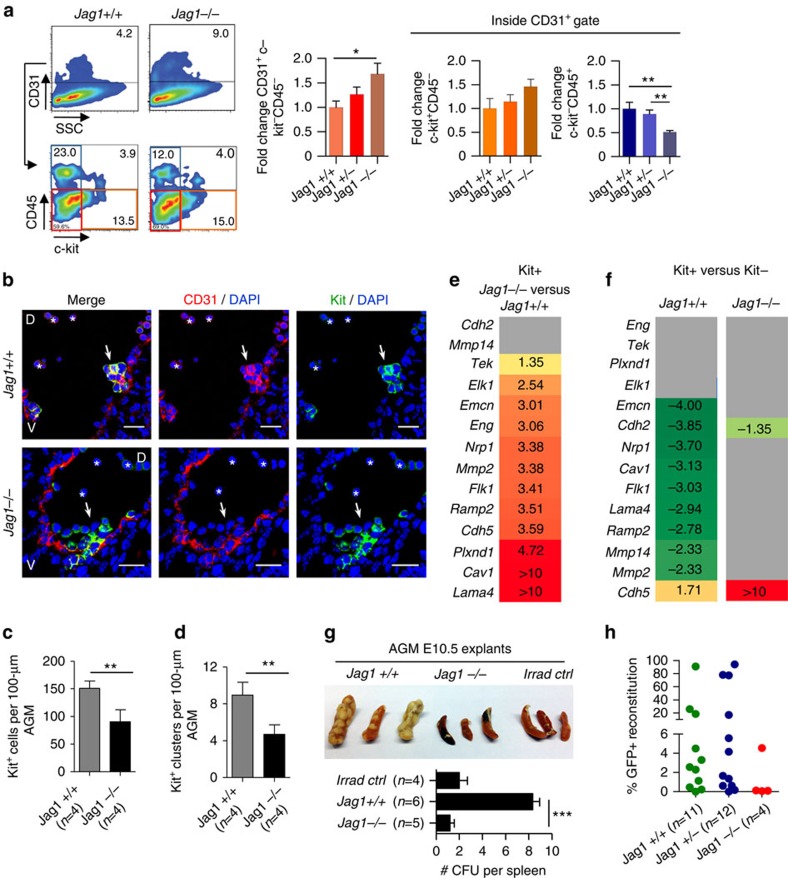
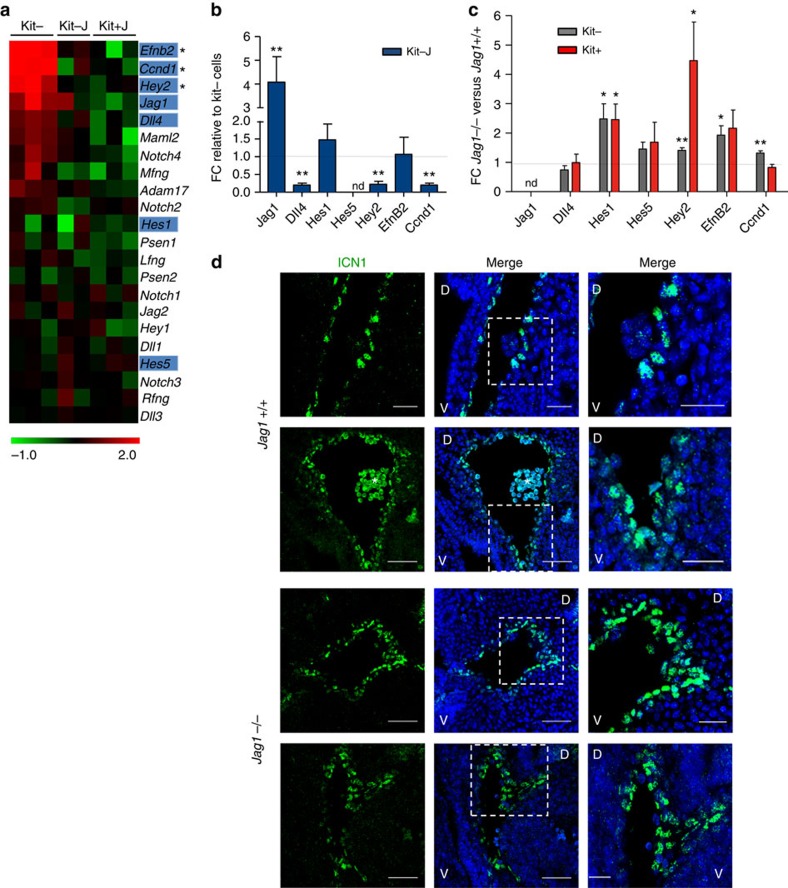
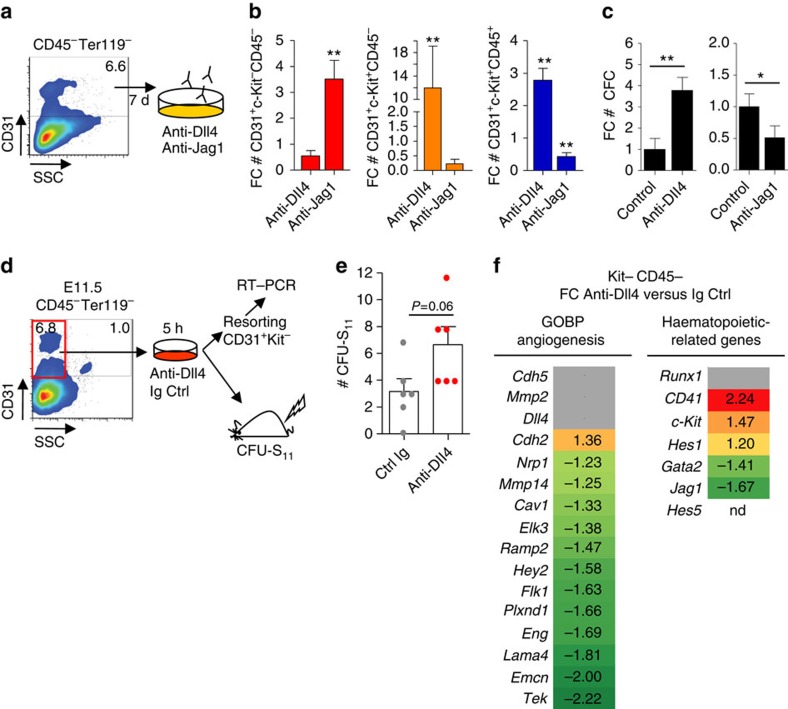
Acquisition of the arterial and haemogenic endothelium fates concurrently occur in the aorta-gonad-mesonephros (AGM) region prior to haematopoietic stem cell (HSC) generation. The arterial programme depends on Dll4 and the haemogenic endothelium/HSC on Jag1-mediated Notch1 signalling. How Notch1 distinguishes and executes these different programmes in response to particular ligands is poorly understood. By using two Notch1 activation trap mouse models with different sensitivity, here we show that arterial endothelial cells and HSCs originate from distinct precursors, characterized by different Notch1 signal strengths. Microarray analysis on AGM subpopulations demonstrates that the Jag1 ligand stimulates low Notch strength, inhibits the endothelial programme and is permissive for HSC specification. In the absence of Jag1, endothelial cells experience high Dll4-induced Notch activity and select the endothelial programme, thus precluding HSC formation. Interference with the Dll4 signal by ligand-specific blocking antibodies is sufficient to inhibit the endothelial programme and favour specification of the haematopoietic lineage.


Conflict of interest statement

Minhong Yan is an employee and shareholder of Roche Genentech. The remaining authors declare no competing financial interest.

Figures

Figure 1
Figure 1. Haematopoietic and arterial specification requires different levels of Notch1 activity.
(a) Schematic representation of Notch activation history mouse reporters by replacing the intracellular domain of mouse Notch1 with low sensitivity (N1IP::CreLO) and high sensitivity (N1IP::CreHI) Cre-recombinase. Reporter activation of N1IP::CreLO requires a high threshold of Notch activity, while N1IP::CreHI is induced in response to low or high Notch activity. (b) Flow cytometry analysis of peripheral blood of adult mice. Cells were stained with Lineage (lin) markers (CD3, B220, Gr1, Mac1 and Ter119) gated on lin+ cells. Numbers indicate the percentage of YPF+ cells. (c) Graph represents the percentage of YFP+ cells within haematopoietic cell types in the bone marrow (BM), spleen and thymus of N1IP::CreLO (grey bars) and N1IP::CreHI (blue bars) as detected using flow cytometry. (d) Representative confocal images of three-dimensional whole-mount immunostaining in N1IP::CreHI and N1IP::CreLO embryos (E10.5) detecting YFP (green), c-Kit (cyan) and CD31 (red). General view of the dorsal aorta (left panel) and details of haematopoietic cluster (right panels). White arrows indicate cluster structures. D, dorsal; DA, dorsal aorta, HC, haematopoietic cluster; V, ventral. Scale bars, 100 μm for DA, 25 μm for HC in N1IP::CreHI and 50 μm in N1IP::CreLow. See also Supplementary Fig. 1. (e,f) Graphs show the percentage of reconstituted cells in animals transplanted with YFP+ and YFP− fractions of E13-14 fetal liver and BM at 4-month post-transplantation (e). Representative dot plots from analysis (f). Donor CD45.2 N1IP::CreHI cell fractions together with 500,000 supporting CD45.1 spleen cells were transplanted into CD45.1/CD45.2 chimeras.
Figure 2
Figure 2. Expression of Jag1 and Dll4 ligands in the embryonic dorsal aorta.
(a) Representative confocal images of E10.5 embryo transverse section with CD31 (red) and Jag1 (green, left) and Dll4 (green, right). Details of ventral part (lower panels) corresponding to boxed areas. Scale bars, 25 μm. Nuclear staining with 4,6-diamidino-2-phenylindole is shown (D, dorsal; V, ventral). (b) Experimental design to test the effects of OP9-Jag1 and OP9-Dll4 on purified CD31+CD45Ter119 AGM cells after 7 days of culture. (c) Quantification of haematopoietic lineage generated from CD31+CD45Ter119 AGM cells on culture on OP9-Jag1 or OP9-Dll4. Bars represent the total number of cells on 7-day culture; n=4 or more samples of at least two independent experiments. s.e.m. is represented. P value for t-test is indicated. (d) Schematic representation for purification of E11.5 AGM CD31+KitCD45Ter119 and CD31+Kit+CD45Ter119 (Kit− and Kit+). In parallel, CD31+CD45Ter119 cells were incubated for 2 h in OP9-Jag1 or OP9-Dll4. Cells were resorted on the basis of Kit expression (Kit−J and Kit+J or Kit−D and Kit+D). (e) Principal component analysis (PCA) of global gene expression profiles of samples included in the study. Each dot of the same colour represents arrays from replicates of the same sample. Dotted lines arbitrarily reunite replicates of a specific condition. (f) Unsupervised hierarchy clustering of transcriptional profiles from selected cell populations. (g) Venn diagram displaying the number of genes differentially expressed in cluster-containing versus endothelial populations (Kit+_Kit−) and/or in endothelial population after versus before incubation on OP9-Jag1 (Kit−J_Kit−). Fold change expression levels from MicroArray analysis of 23 angiogenic-related genes are listed. Green-colour grade represents the range of fold change (FC) values on Kit+ or Kit−J populations compared with Kit− cells. All FC values represent statistically significant differences on gene expression (P value-adjusted<0.05). Grey cells represent genes in which FC is not statistically significant. (h) Biological process enrichment analysis of genes differentially expressed in Kit−J_Kit− and Kit+_Kit− comparisons. Only selected GO terms are presented, and all significant terms are given in Supplementary Tables 2 and 3. (eh) Analysis performed on three independent experiments; one Kit−J sample was excluded for technical reasons.
Figure 3
Figure 3. Jag1 induces the downregulation of the endothelial signature.
(a) Microarray validation using qRT–PCR. Expression of a panel of endothelial-related genes on E11.5 CD31+CD45−Ter119− AGM cells incubated 2 h on OP9-Jag1. Quantification was performed in Kit−, Kit+, Kit−J and Kit+J. The bars represent the average expression level of four to six replicates from two independent experiments, normalized to Kit− expression. Average fold change (±s.d.) is represented. Student's t-test for comparisons of Kit+, Kit−J and Kit+J populations with Kit− population was performed (*P≤0.05; **P≤0.01; P≤0.001). (b) Expression of haematopoietic genes on E10.5 and E11.5 Kit− and Kit−J populations (2 h on OP9-Jag1). The bars represent the average (±s.e.m.) expression level of six to nine replicates from three or four independent experiments, normalized to Kit− expression. Statistical significance was assessed by Student's t-test (*P≤0.05; ***P≤0.001 when significant). nd, not detected.
Figure 4
Figure 4. Jag1 mutants fail to generate functional HSCs and retain endothelial signature.
(a) Representative analysis of population distribution in Jag1+/+, Jag1+/− and Jag1−/− animals. Endothelial population (CD31+KitCD45) in red (frame and graph bars), cluster-containing population (CD31+Kit+CD45) in orange (frame and graph bars) and mature haematopoietic population (CD31+KitCD45+) in blue (frame and graph bars). Bars represent the average population distribution in Jag1+/+ (n=6), Jag1+/− (n=10) and Jag1−/− (n=6) embryos, normalized to Jag1+/+ ±s.e.m. Significance was assessed by Student's t-test (*P≤0.05 and **P≤0.01 when significant). (b) Representative confocal images of transversal sections of E10.5 AGM from Jag1+/+ and Jag1−/− stained for CD31 (red) and Kit (green). Nuclear staining with DAPI. White arrows point to cluster-like structures. Scale bar, 25 μm. Asterisks indicate autofluorescent circulating cells. D, dorsal; V, ventral. (c,d) Quantification of Kit+ cells (c) and Kit+ clusters (group of at least four positive cells; d) per 100 μm of AGM from Jag1+/+ and Jag1−/− embryos. Bars represent the average±s.e.m. of cells per embryo (n=4). Student's t-test was performed (**P≤0.01). (e,f) FC in the expression levels of the indicated genes as detected using qRT–PCR from E10.5 Jag1−/− compared with Jag1+/+ Kit+ cells (e) or in Kit+ compared with Kit− populations in the Jag1+/+ and Jag1−/−. (f). Two independent pooled samples for each genotype were analysed. Colour grades reflect the FC values of each gene expression. All FC values represent statistically significant differences on gene expression (P value≤0.05). Genes that do not show a statistically significant alteration in pairwise comparison are listed in grey. See also Supplementary Fig. 5a. (g) CFU-S11 from E10.5 Jag1+/+ or Jag1−/− AGM explant cultures. n represents the number of treated animals per condition. Each mouse was transplanted with one embryo equivalent AGMs on 3 days in explant culture. Results obtained from three independent experiments. Irrad ctrl: irradiated/non-injected control. Bars represent the mean±s.e.m. of colonies per tissue. Significance is assessed by Student's t-test (***P≤0.001; not assigned if not significant). (h) Percentage of reconstitution at 4 months post transplantation. Each dot represents a single animal. n represents the number of transplanted mice per genotype.
Figure 5
Figure 5. Jag1 attenuates Notch signalling imposed by Dll4 in the AGM.
(a) Heatmap displaying Notch pathway elements' signature enrichment in E11.5 endothelial population (Kit−) and in Kit− and Kit+ cells on Jag1 incubation of the endothelial fraction (Kit−J and Kit+J, respectively). Highlighted genes are differentially expressed in Kit+_Kit− (Fig. 2); *represents differentially expressed in Kit−J_Kit−. Non-marked genes are not significant (P≤0.05). (b) Fold change expression levels using qRT–PCR of Notch pathway elements in E11.5 endothelial population on OP9-Jag1 incubation (Kit−J) compared with Kit− cells. The bars represent the average expression of 7 to 12 replicates from at least three independent experiments±s.e.m. Student's t-test was performed (**P≤0.01; ***P≤0.001; ns, not significant; n.d., not detected). (c) Fold change expression levels using qRT–PCR of Notch pathway elements in Kit− (grey) or in Kit+ population (red) from E10.5 Jag1−/− compared with Jag1+/+. Bars represent the average expression level of five to six replicates from two independent experiments. Statistical significance was assessed by Student's t-test (*P≤0.05; **P≤0.01; not significant, not assigned). (d) Confocal images of transverse sections of the dorsal aorta in two E10.5 embryos from Jag1+/+ and Jag1−/− stained with anti-cleaved Notch1 (green). Detail of the dorsal aorta corresponding to the boxed areas (right panels). *represents autofluorescent circulating cells. Scale bars, 50 μm in Jag1+/+, 25 μm in Jag1−/− embryos and for magnified regions.
Figure 6
Figure 6. Blockage of Dll4 promotes haematopoietic commitment.
(a) Schematic of experimental design. E10.5 AGM CD31+CD45Ter119 cells were sorted and incubated in the medium with anti-Dll4- or anti-Jag1-blocking antibodies or irrelevant Ig for 7 days. (b) Graphs represent the average FC of total cell number obtained after culturing with anti-Dll4 or anti-Jag1 compared with each Ig control±s.e.m. from three independent experiments. Student's t-test was used to assess the significance (**P≤0.01; not assigned if not significant). (c) Relative number of CFC haematopoietic progenitors obtained in b. Average results from three independent experiments ±s.d. determination. Student's t-test was used to assess the significance (*P≤0.05; **P≤0.01). (d) E11.5 CD31+KitCD45Ter119 cells were sorted and incubated for 5 h on the medium supplemented with anti-Dll4-blocking antibody or irrelevant Ig control. Cells were injected in 3-Gy-irradiated SCID-Beige mice or resorted for mRNA extraction and qRT–PCR analyses. (e) Quantification of spleen colonies (CFU-S11). Bars represent the average of six replicates from three independent experiments (coloured dots) ±s.e.m. Student's t-test was used to assess significance. (f) FC in expression levels of a panel of angiogenic- and haematopoietic-related genes using qRT–PCR. Colour grades reflect the fold change values of each gene expression (normalization to expression levels in control conditions). All coloured FC values represent statistically significant differences on gene expression (P≤0.05, using Student's t-test). Grey is shown for non-statistical significant differences.

References

    1. Medvinsky A. & Dzierzak E. Definitive hematopoiesis is autonomously initiated by the AGM region. Cell 86, 897–906 (1996). - PubMed
    1. Kissa K. & Herbomel P. Blood stem cells emerge from aortic endothelium by a novel type of cell transition. Nature 464, 112–115 (2010). - PubMed
    1. Boisset J. C. et al.. In vivo imaging of haematopoietic cells emerging from the mouse aortic endothelium. Nature 464, 116–120 (2010). - PubMed
    1. Bertrand J. Y. et al.. Haematopoietic stem cells derive directly from aortic endothelium during development. Nature 464, 108–111 (2010). - PMC - PubMed
    1. Swiers G. et al.. Early dynamic fate changes in haemogenic endothelium characterized at the single-cell level. Nat. Commun. 4, 2924 (2013). - PMC - PubMed

Publication types

MeSH terms

Substances