. 2015 Oct 23;78(10):2411-22.
doi: 10.1021/acs.jnatprod.5b00489. Epub 2015 Oct 14.

Actinoramide A Identified as a Potent Antimalarial from Titration-Based Screening of Marine Natural Product Extracts

Affiliations

Actinoramide A Identified as a Potent Antimalarial from Titration-Based Screening of Marine Natural Product Extracts

Ken Chih-Chien Cheng et al. J Nat Prod. .

Abstract

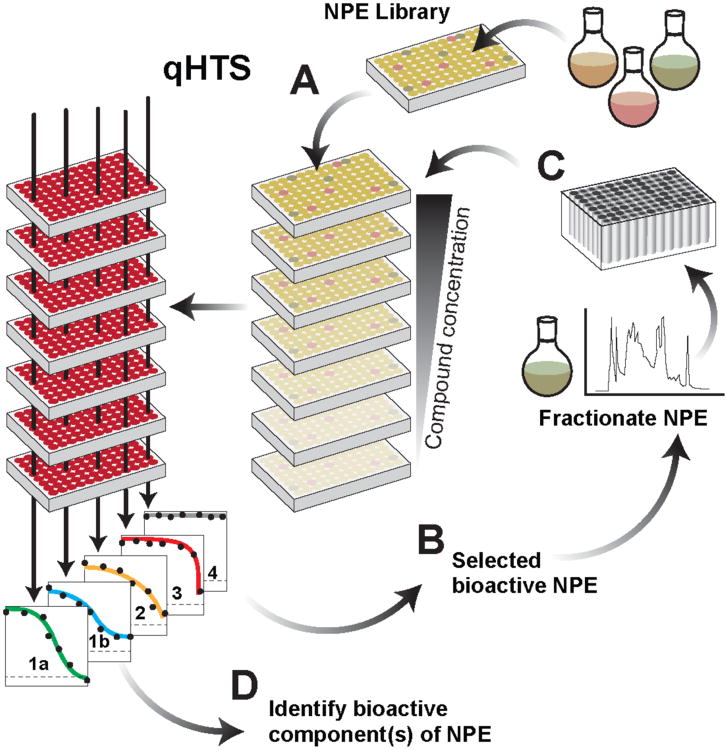
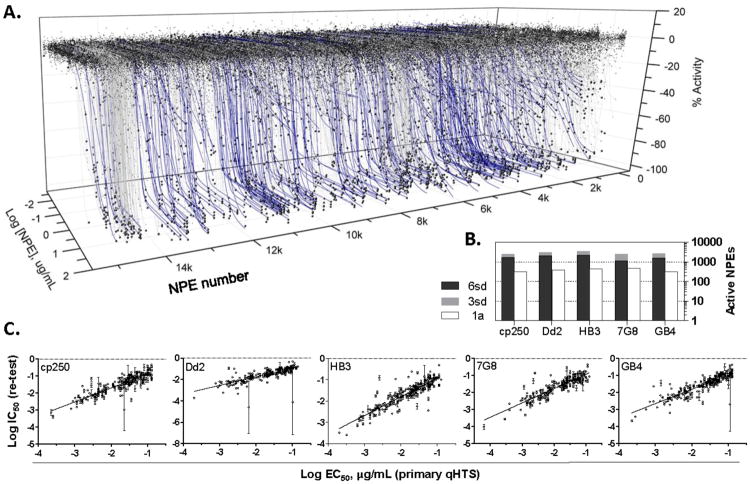
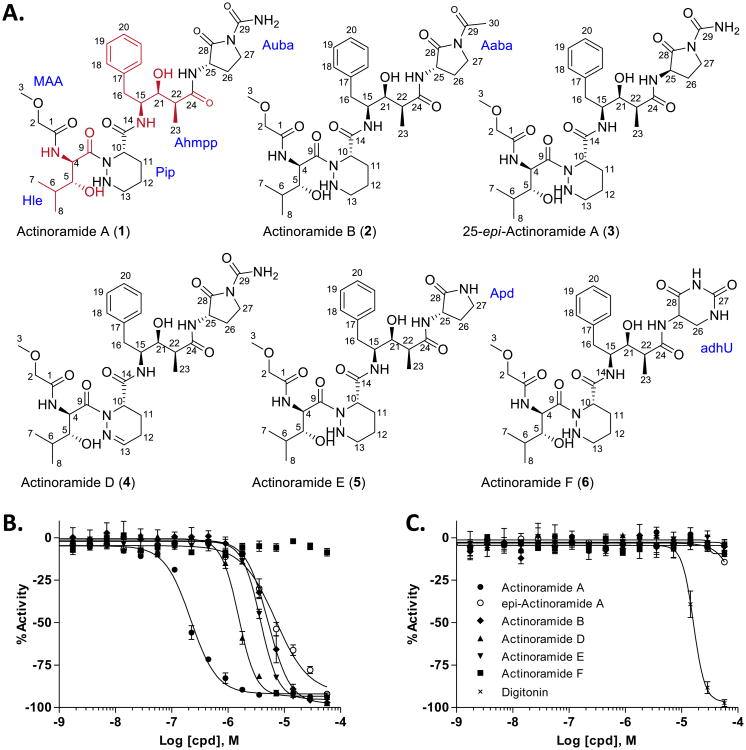
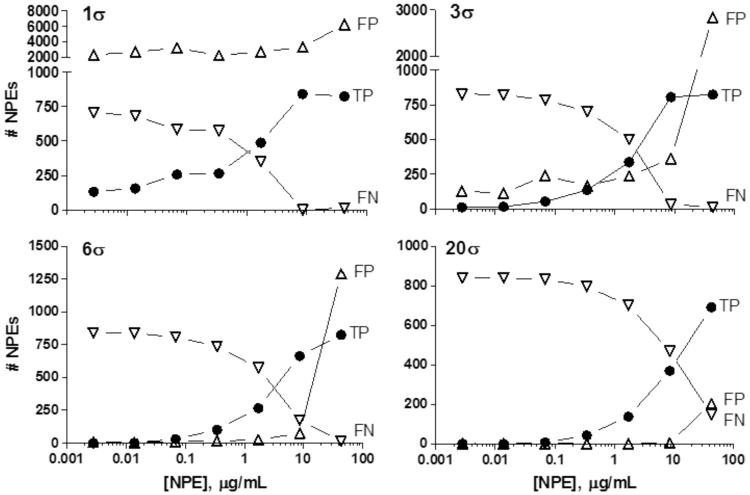
Methods to identify the bioactive diversity within natural product extracts (NPEs) continue to evolve. NPEs constitute complex mixtures of chemical substances varying in structure, composition, and abundance. NPEs can therefore be challenging to evaluate efficiently with high-throughput screening approaches designed to test pure substances. Here we facilitate the rapid identification and prioritization of antimalarial NPEs using a pharmacologically driven, quantitative high-throughput-screening (qHTS) paradigm. In qHTS each NPE is tested across a concentration range from which sigmoidal response, efficacy, and apparent EC50s can be used to rank order NPEs for subsequent organism reculture, extraction, and fractionation. Using an NPE library derived from diverse marine microorganisms we observed potent antimalarial activity from two Streptomyces sp. extracts identified from thousands tested using qHTS. Seven compounds were isolated from two phylogenetically related Streptomyces species: Streptomyces ballenaensis collected from Costa Rica and Streptomyces bangulaensis collected from Papua New Guinea. Among them we identified actinoramides A and B, belonging to the unusually elaborated nonproteinogenic amino-acid-containing tetrapeptide series of natural products. In addition, we characterized a series of new compounds, including an artifact, 25-epi-actinoramide A, and actinoramides D, E, and F, which are closely related biosynthetic congeners of the previously reported metabolites.


Figures

Figure 1
Figure 1. Overview of natural product extract qHTS
A pre-fractionated library of Amberlite XAD16 polymer resin enriched natural product extracts (NPEs) is evaluated as a dilution series using a 1536-well assay format to accommodate the added samples, here in a Plasmodium falciparum (Pf) intraerythrocytic SYBR Green viability assay (A). qHTS-derived concentration-response curve (CRC) profiles for each NPE tested are assessed using parameters derived from each CRC, for example EC50, maximal effect and curve class (CC), i.e., 1a, 1b, 2, 3 and 4 (inactive at all concentrations), and selected for follow-up studies (B). NPE microbial strains highest ranking in project profile criteria, here pan-activity on several Pf laboratory stains and low mammalian cell toxicity, are re-cultured, confirmed and fractionated for re-testing (C). Active fractions meeting criteria are subjected to structure elucidation (D).
Figure 2
Figure 2. Intra-erythrocytic Pf proliferation qHTS of a marine NPE library
Shown in A. is a representative 3-axis plot for 15,500 microbial NPEs tested against the Dd2 laboratory strain of P. falciparum. NPE numbers increase by alphanumeric sorting of the microbial extract names. Blue lines, high quality concentration-response curves selected for re-testing. B. Bar chart summarizes active NPEs in SYBR Green DNA staining viability assay for five malaria lines. The number of active NPEs per assay are indicated on the y-axis, where the white bars represent class 1a CRC, while 3 SD and 6 SD cutoffs for activity at a single concentration of 43 μg/mL are given by the grey and black bars. C. EC50 correlation between activities determined in the primary qHTS vs. retests of 231 NPEs. R2(cp250)=0.73, R2(Dd2)=0.48, R2(HB3)=0.78, R2(7G8)=0.76, R2(GB4)=0.73. NPEs not confirming do not appear in plots, see Data Table S1.
Figure 3
Figure 3. NPEs selected from primary qHTS and toxicity assessment
A. Spotfire clustering where NPE activity was calculated as the average EC50 value for all re-acquired extracts (MeOH, acetone and/or EtOAc) against the respective parasite isolate or mammalian cell line. EC50 values determined where curve classes were not equal to 1a, 1b, 2a, 2b or 3 were excluded, as were EC50 values where the p-value of the titration was greater than 0.05. Darker color indicates greater activity in either SYBR Green or Cell TiterGlo assay. Arrows indicate NPE CRCs shown in B. Dotted box frame mammalian cell line response values. The UPGMA clustering method was used for both row and column dimensions using Euclidean distances and ordering weight set to average value. B. Representative 11-point CRC confirmation and mammalian cell line toxicity evaluation for selected NPEs. Data shown are for NPE 07-13-H1I (1), 7714-H2I (2), 276-1 (3), 22278-N3 (4) and 07-234-A1I (5) and broadly toxic NPEs, 7756-H5I (6) and 20755-1I (7); numbers in parenthesis following the NPE number refer to heat map positions. The two data sets per plot are replicate tests (n=2) for a single solvent extract, except for HepG2 which is a single test. Cytotoxicity measured by the CellTiter-Glo assay on HepG2 and HEK293 cell lines. See Figure S1A, B for additional examples.
Figure 4
Figure 4. Fractionation and testing of selected NPEs
A. Diagram of NPE fractionation (44 fractions) and preliminary characterization scheme. B. 16 Re-cultured microbial fractionated extracts tested against the Dd2 isolate. Vertical grids separate 44 fractions and original lead parent NPE (magenta) from individual microbial strain growths. Blue curves denote high-quality concentration-response active extract fractions. C. Activity chromatograms for NPE 07-234-A1I from S. bangulaensis and 22278-N3 from S. ballenaensis where the following are indicated: UV absorbance at 210 nm (black line trace); pEC50 from the average of the five P. falciparum lines tested (blue diamond); viability of human RBCs (purple cross), HEK293 cells (red square), and HepG2 cells (green triangle); assay interference due to light absorption by fraction (light blue cross).
Figure 5
Figure 5. Dihydrouracil ring system
The novel terminal end group of actinoramide F (6) differs from actinoramide A (1) by virtue of 5,6-dihydrouracil replacing the 2-oxopyrrolidine-1-carboxamide.
Figure 6
Figure 6. Activity of the actinoramides on blood stage parasite (Dd2 line) and a hepatocyte cell line
A. Structures of the actinoramides. (2R, 3R)-2-amino-3-hydroxy-4-methylpentanoic acid and (2S, 3S, 4S)-4-amino-3-hydroxy-2-methyl-5-phenyl pentanoic acid amino acids are shown in red. 1H and 13C NMR, HSQC, HMBC, COSY, data for compounds 16 and ROESY and TOCSY data for compounds 36 are provided in Tables 1 and 2 and Figures S3–S8. B. Actinoramide congener activity on 3D7 showing stereoselective antimalarial activity of the 25S (solid circles, actinoramide A) and 25R (open circles, 25-epi-actinoramide A) isomers of actinoramide A. The activity of these compounds on all five blood stage parasites (Dd2, HB3, 7G8, GB4, and cp250) are provided in Figure S9a. C. Effect of the actinoramides on viability of HEK293 cells (for effect on viability of HepG2 cells see Figure S9b). Digitonin control (}). n=2 or greater for all experiments, error bars are SD of mean.
Figure 7
Figure 7. Analysis of qHTS data at a single NPE concentration with various hit threshold scenarios
Solid circles, true positives (TP); open triangles, false positives (FP); open down triangles, false negatives (FN). See Discussion for description. σ = standard deviation

References

    1. Koehn FE, Carter GT. Nat Rev Drug Discov. 2005;4:206–220. - PubMed
    1. Butler MS. Nat Prod Rep. 2008;25:475–516. - PubMed
    1. Mayer AM, Glaser KB, Cuevas C, Jacobs RS, Kem W, Little RD, McIntosh JM, Newman DJ, Potts BC, Shuster DE. Trends Pharmacol Sci. 2010;31:255–265. - PubMed
    1. Carlson EE. ACS Chem Biol. 2010;5:639–653. - PMC - PubMed
    1. Cruz PG, Auld DS, Schultz PJ, Lovell S, Battaile KP, MacArthur R, Shen M, Tamayo-Castillo G, Inglese J, Sherman DH. Chem Biol. 2011;18:1442–1452. - PMC - PubMed

Publication types

MeSH terms

LinkOut - more resources