. 2015 Oct 14:6:8581.
doi: 10.1038/ncomms9581.

Topological data analysis for discovery in preclinical spinal cord injury and traumatic brain injury

Affiliations

Topological data analysis for discovery in preclinical spinal cord injury and traumatic brain injury

Jessica L Nielson et al. Nat Commun. .

Abstract

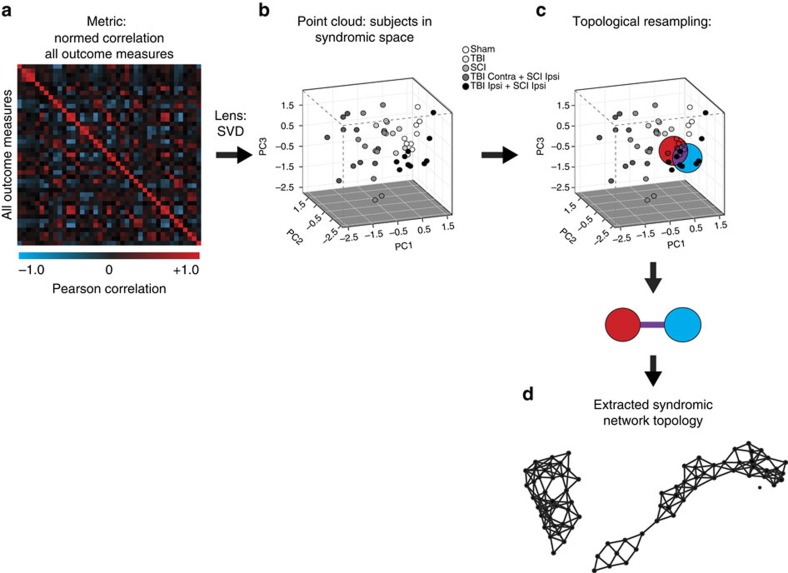
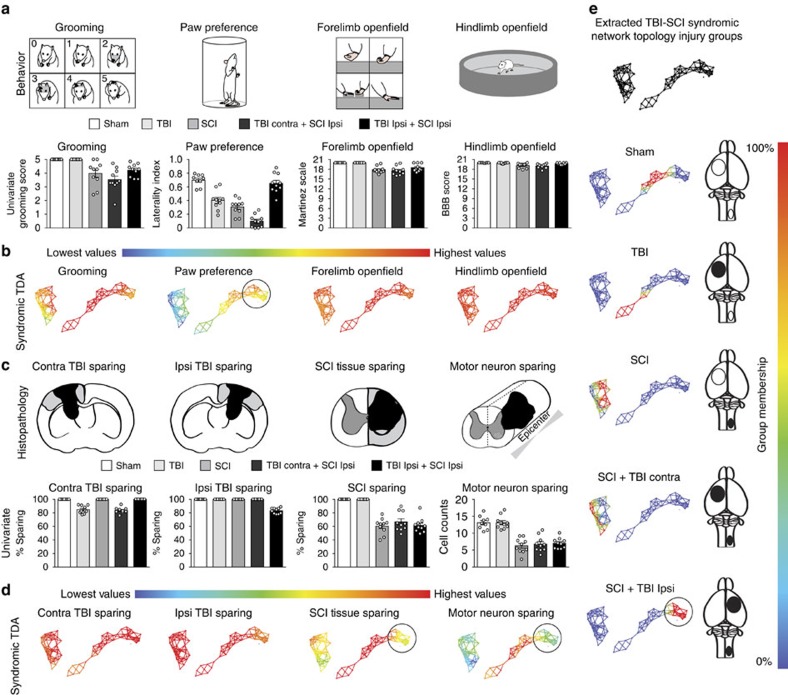
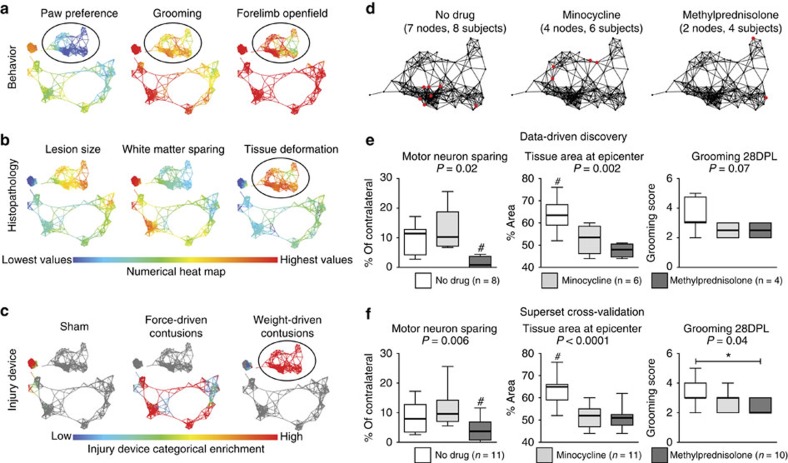
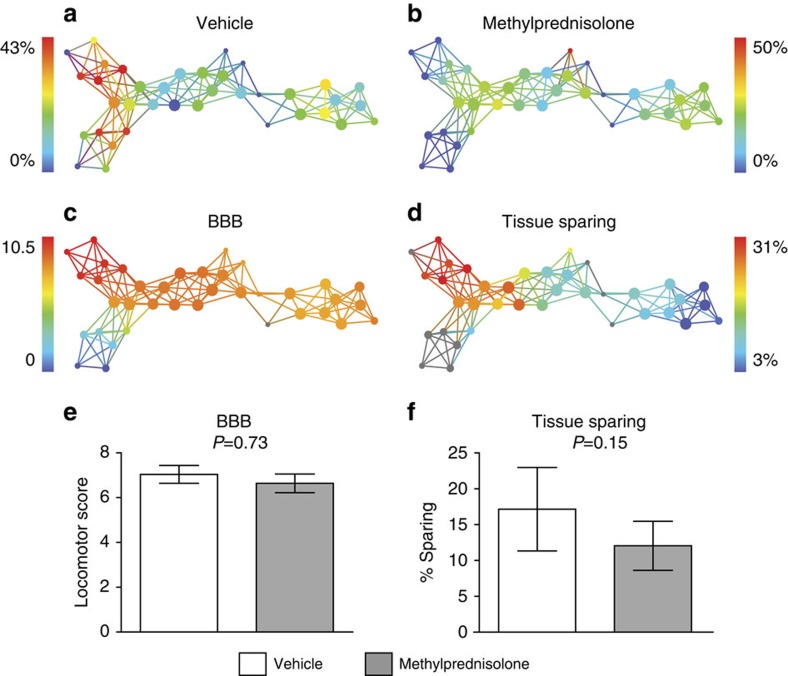
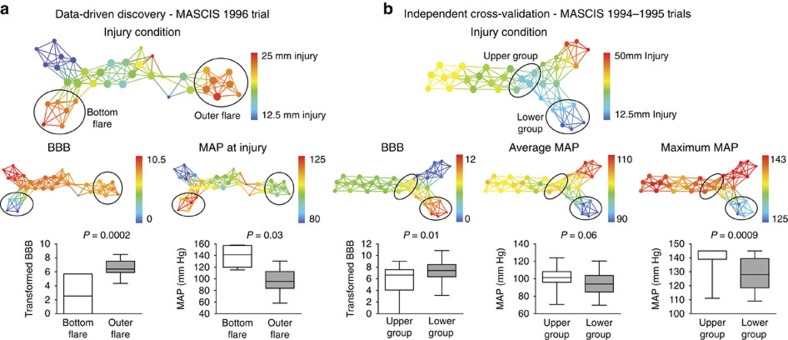
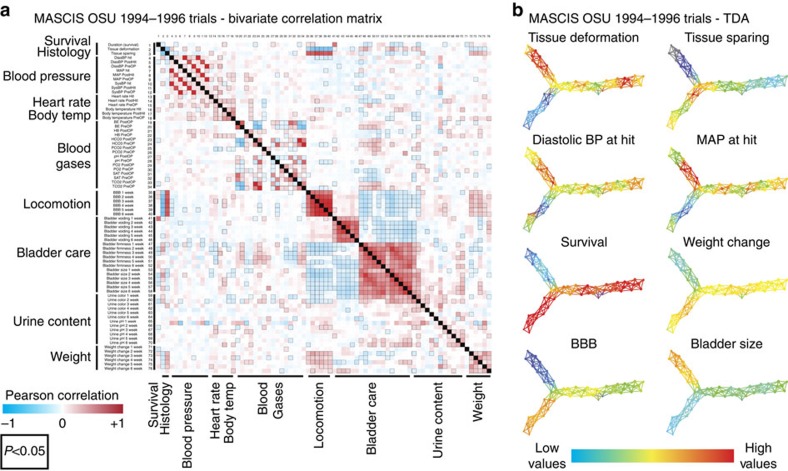
Data-driven discovery in complex neurological disorders has potential to extract meaningful syndromic knowledge from large, heterogeneous data sets to enhance potential for precision medicine. Here we describe the application of topological data analysis (TDA) for data-driven discovery in preclinical traumatic brain injury (TBI) and spinal cord injury (SCI) data sets mined from the Visualized Syndromic Information and Outcomes for Neurotrauma-SCI (VISION-SCI) repository. Through direct visualization of inter-related histopathological, functional and health outcomes, TDA detected novel patterns across the syndromic network, uncovering interactions between SCI and co-occurring TBI, as well as detrimental drug effects in unpublished multicentre preclinical drug trial data in SCI. TDA also revealed that perioperative hypertension predicted long-term recovery better than any tested drug after thoracic SCI in rats. TDA-based data-driven discovery has great potential application for decision-support for basic research and clinical problems such as outcome assessment, neurocritical care, treatment planning and rapid, precision-diagnosis.


Conflict of interest statement

J.P., J.K., T.C.P, P.Y.L, and G.E.C. are current or former employees of Ayasdi Inc. and own shares of the company. All other authors declare no competing financial interests.

Figures

Figure 1
Figure 1. Topological representation of the syndromic space using TDA.
(a) Data sets containing functional and histological outcomes were analysed using TDA from a bivariate correlation matrix of all outcomes. (b) Data were processed with the principal and secondary metric singular value decomposition (SVD) lens to generate the syndrome space. (c) TDA resamples the syndromic space many times to link subjects into nodes (red/blue circles) and connects overlapping subjects with edges (purple line) (d) to create a robust network topology for rapid visualization and interpretation of outcomes over time.
Figure 2
Figure 2. Histo-behavioural network topology of combined TBI-SCI model.
(a,b) Behavioral outcomes of forelimb function and (c,d) histopathology were mapped onto the topological network using TDA. Data from this model shows a distinct recovery pattern depending on whether the combined TBI is contralateral (contra) or ipsilateral (ipsi) to the SCI. (e) Each injury group occupies a distinct region of the network topology, highlighted as red nodes for 100% enrichment (heat map) for each particular injury model. Sham controls (n=9) and TBI-only (n=10) subjects are located in the right cluster. SCI-only (n=10) and SCI+TBI contra (n=10) are both located in the left cluster. SCI+TBI ipsi (n=10) interestingly are grouped next to the sham subjects in the right cluster (circled part of the network), due to a syndromic functional recovery similar to shams (a), despite showing no difference in pathology compared with subjects with SCI alone or SCI+TBI contra (c). All outcome averages and injury models were exported into an HTML figure (Supplementary Software 1) for rapid visualization and user-guided exploration of the syndromic topological space in this data set.
Figure 3
Figure 3. Data-driven discovery of deficits in rats in cervical SCI drug trials.
(a) Behavioural deficits in forelimb function were identified in the syndromic network (circled area). (b) Visual mapping of histopathology patterns in the network did not identify similar patterns to explain behavioral deficits, despite less tissue deformation in this portion of the network. (c) Enrichment for injury condition revealed these subjects were given the same type injury (weight-drop contusions, 12.5 mm, Supplementary Software 2). Data-driven exploration of these subjects within the network identified a no-drug controlled trial of minocycline and methylprednisolone (MP). (d) Nodes containing subjects significantly enriched for respective drug condition, and 12.5 mm weight-drop injuries were isolated (red nodes) for group comparisons using the Kolmogorov–Smirnov test (KS test). (e) The three outcomes with the smallest P values from the KS test results were identified in the sub-selection of subjects identified for each treatment condition. Results revealed significant MN loss in subjects receiving MP (n=2 nodes, 4 subjects) compared with minocycline (n=4 nodes, 6 subjects) and no-drug controls (n=7 nodes, 8 subjects) (P=0.02, F(2,15)=5.21, η2=0.41, 1−β=0.74), and significantly less tissue area at the injury epicentre in both minocycline and MP-treated subjects, compared with no-drug controls (P=0.002, F(2,15)=10.02, η2=0.57, 1−β=0.96). Non-significant functional deficits in grooming were observed 28 days post lesion (DPL) (P=0.07, F(2,15)=3.18, η2=0.30, 1−β=0.52). (f) Validation of these significant detrimental treatment effects were found in the entire superset of subjects for both MN sparing (P=0.006, F(2,29)=6.08, η2=0.30, 1−β=0.85) and total tissue area at epicentre (P<0.0001, F(2,29)=19.94, η2=0.60, 1−β=1.0), and grooming at 28 DPL was also significant (P=0.04, F(2,29)=3.68, η2=0.20, 1−β=0.63). Box and whisker plots show mean and minimum/maximum range of values. P values represent overall treatment effect using one-way ANOVA. Post hoc pairwise comparisons between each drug condition identified significant decreases in MN sparing in MP-treated subjects, and more tissue area in no-drug controls (‘#',significantly different from both groups; *P<0.05). All outcomes at each time point, location of injury conditions and treatment groups are mapped onto the HTML network Supplementary Software 2.
Figure 4
Figure 4. Cross-validation attempt of MP in thoracic SCI L-infinity centrality network.
TDA was performed on data mined from the VISION-SCI repository, queried based on subjects that were part of treatment trials testing MP (MP1 and MCP) following SCI (N=72). Location of treatment groups within the network for either (a) vehicle-treated control or (b) MP-treated subjects are shown, however, no nodes were 100% pure for either treatment condition, suggesting treatment was not a significant predictor of placement of subjects within this network. (c) BBB recovery and (d) total tissue sparing at the injury epicentre were mapped into the network to identify the range of recovery in this data set (red=better recovery, blue=worse recovery). Grouping subjects in the data set based on treatment condition did not reveal the same significant deficits observed in the cervical trial for MP for either (e) recovery of locomotor recovery measured by the BBB (P=0.73), or (f) the total tissue sparing at the epicentre (P=0.15). However, there was a trend towards less tissue sparing in subjects that received MP, similar to histopathology observed in cervical SCI (Fig. 3). The most striking difference in the network were subjects who had very large differences in tissue sparing along the top arm of the network, yet showed similar ranges of BBB functional recovery, which are explored further in Fig. 5. Histograms plotted as mean±s.e. Student t-test used for significance testing between treatment groups.
Figure 5
Figure 5. Perioperative hypertension predicts worse recovery after thoracic SCI.
(a) Exploration of the TDA network from the MASCIS OSU 1996 methylprednisolone trial (N=72) revealed a cluster of subjects in the network given the same targeted injury (circled bottom and outer flares) that showed very significant differences in BBB function (P=0.0002). A query of variables with significant differences based on KS test results between these two groups uncovered subjects with significant hypertension during SCI surgery (P=0.03) clustering in the groups with poorer functional recovery. (b) Cross-validation of these relationships between perioperative blood pressure and functional recovery was performed in a separate group of test subjects from the same 3-year drug trial (MASCIS 1994–1995, N=154) with matching outcome measures and subject grouping. Visually guided identification of subjects in the network given the same injury condition (circled upper and lower groups) but showing poorer functional recovery on the BBB scale (P=0.01) uncovered the same significant detrimental effect of hypertension during SCI surgery on recovery (P=0.06), specifically when assessing peak MAP values recorded during surgery (P=0.0009). Box and whisker plots show mean and minimum/maximum range of values. P values obtained using student t-test for significant differences between groups.
Figure 6
Figure 6. Comparing traditional tools to TDA in MASCIS data set.
(a) A bivariate correlation matrix was generated for every outcome measured over time along with measures of heart rate, blood pressure and blood gases before, during and after surgery. Each variable is correlated to every other variable, with clusters of similar measures represented with larger text, with specifics about each measure and collected as the same times post injury (1–6 weeks post injury). Histology includes tissue deformation and tissue sparing. Blood pressure includes diastolic pressure, mean arterial pressure and systolic pressure at time of hit, 15 min after hit (PostHit) and 15 min before hit (PreOP). Similar time bins were collected for heart rate and body temperature. Blood gases were measured only either before (PreOP) or after (PostOP) injury. Locomotion was measured between 1 and 6 weeks using the BBB scale. Bladder function was monitored daily and binned across each week post injury for bladder voiding/expression, firmness, size and urine content was recorded for colour and pH. Weight change between each week post injury was also recorded to assess health. Numbers along the y-axis are reflected in the x-axis to line up variable comparisons. The heat map represents either negative (blue) or positive correlations between each variable within the matrix, with significant correlations (P<0.05) highlighted with black boxes. Although this method of visualizing correlations is useful for understanding how different measures all relate to each other within the context of all other comparisons, it does not allow for mapping of each test subjects placement within the network based on all these complex relationships. (b) TDA of the same data set reveals the distribution of every subject within the network, from all subjects in the entire OSU MASCIS trial (1994–1996, N=334). TDA revealed the same visually guided relationships between perioperative blood pressure and autonomic and locomotor dysfunction following SCI identified in Fig. 5. Complete mapping of all outcomes and perioperative measures of vitals and blood gases over time were exported into an HTML viewer (Supplementary Software 4).

References

    1. Celi L. A., Mark R. G., Stone D. J. & Montgomery R. A. "Big data" in the intensive care unit. Closing the data loop. Am. J. Respir. Crit. Care Med. 187, 1157–1160 (2013). - PMC - PubMed
    1. Larson E. B. Building trust in the power of "big data" research to serve the public good. JAMA 309, 2443–2444 (2013). - PubMed
    1. Akil H., Martone M. E. & Van Essen D. C. Challenges and opportunities in mining neuroscience data. Science 331, 708–712 (2011). - PMC - PubMed
    1. Fox P. & Hendler J. Changing the equation on scientific data visualization. Science 331, 705–708 (2011). - PubMed
    1. Gough N. R. & Yaffe M. B. Focus issue: conquering the data mountain. Sci. Signal. 4, eg2 (2011). - PubMed

Publication types