. 2015 Oct 14;10(10):e0139664.
doi: 10.1371/journal.pone.0139664. eCollection 2015.

Increased Oxidative and Nitrative Stress Accelerates Aging of the Retinal Vasculature in the Diabetic Retina

Affiliations

Increased Oxidative and Nitrative Stress Accelerates Aging of the Retinal Vasculature in the Diabetic Retina

Folami Lamoke et al. PLoS One. .

Abstract

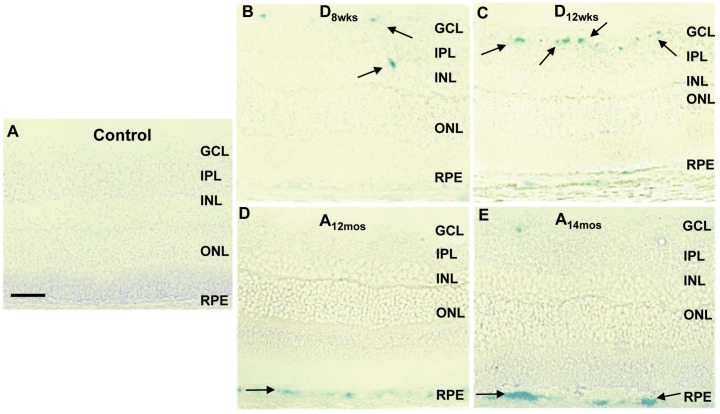
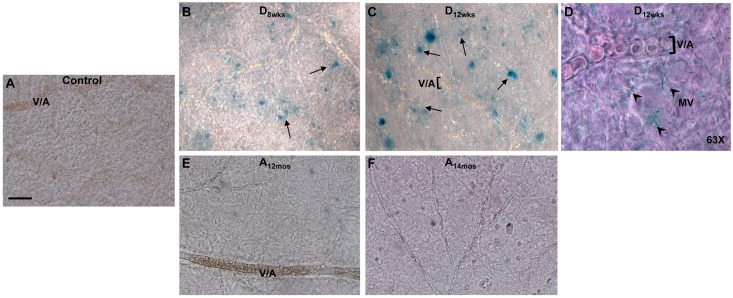
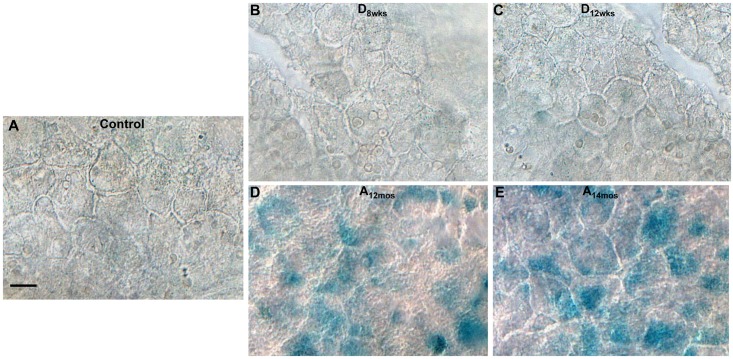
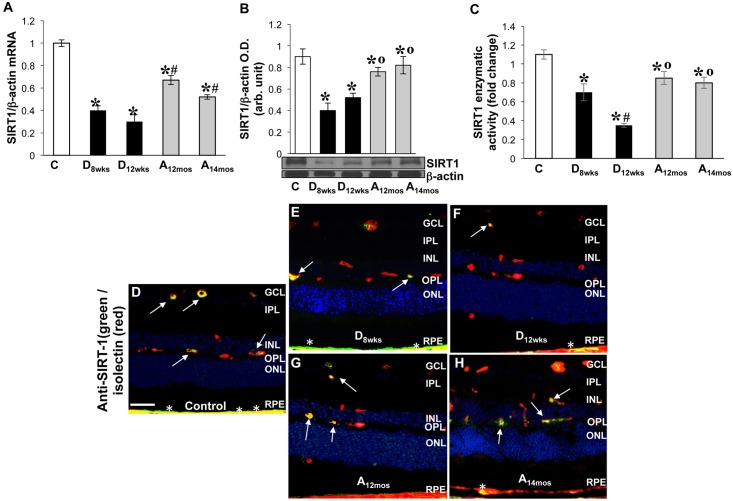
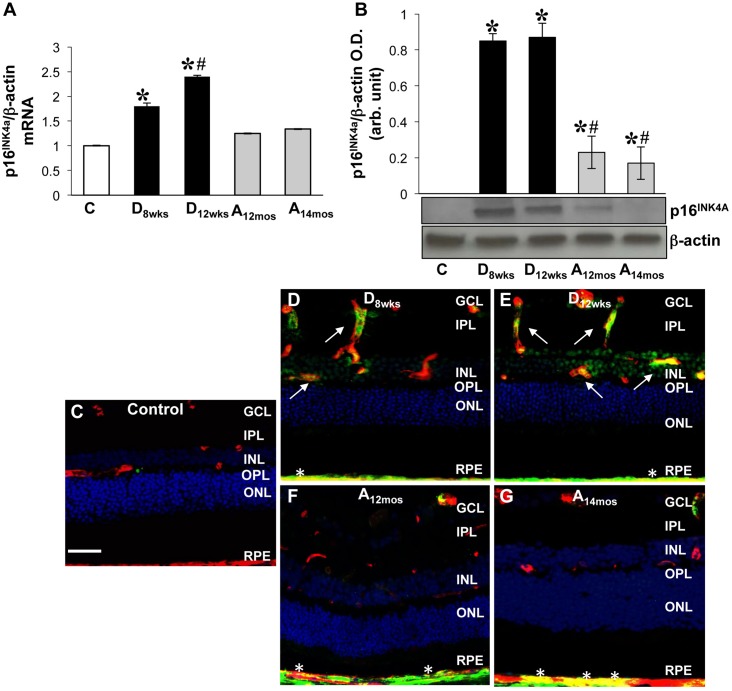
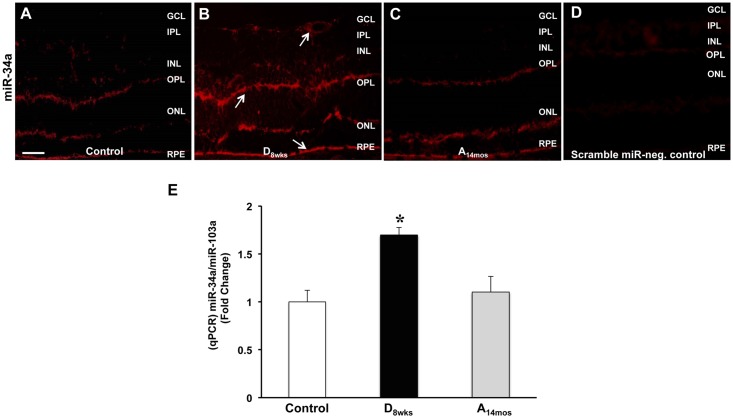
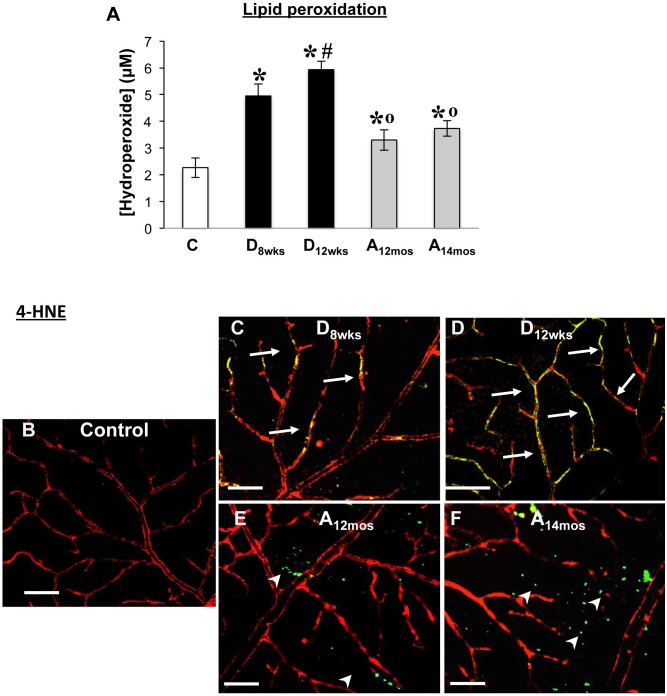
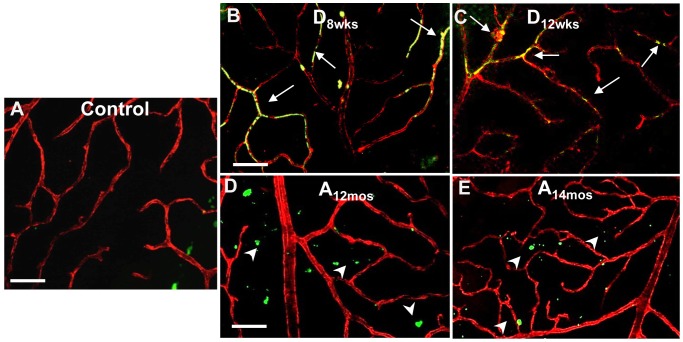
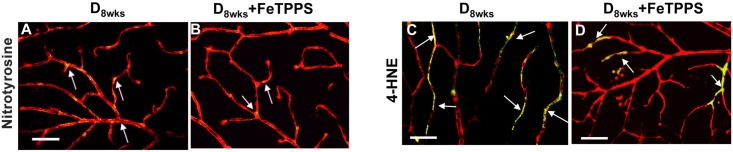
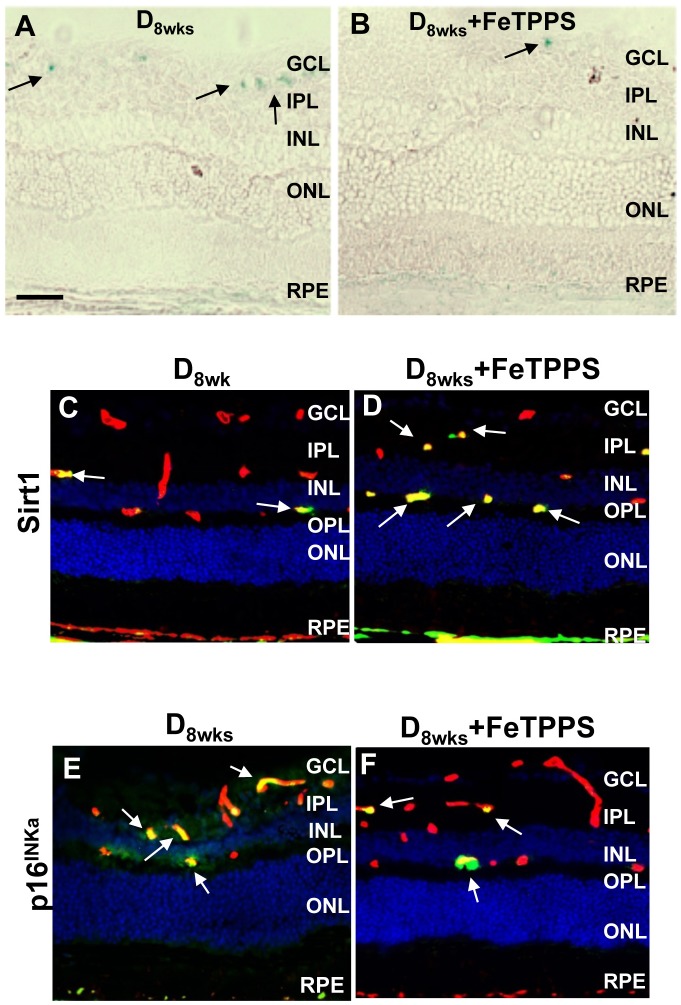
Hyperglycemia-induced retinal oxidative and nitrative stress can accelerate vascular cell aging, which may lead to vascular dysfunction as seen in diabetes. There is no information on whether this may contribute to the progression of diabetic retinopathy (DR). In this study, we have assessed the occurrence of senescence-associated markers in retinas of streptozotocin-induced diabetic rats at 8 and 12 weeks of hyperglycemia as compared to normoglycemic aging (12 and 14 months) and adult (4.5 months) rat retinas. We have found that in the diabetic retinas there was an up-regulation of senescence-associated markers SA-β-Gal, p16INK4a and miR34a, which correlated with decreased expression of SIRT1, a target of miR34a. Expression of senescence-associated factors primarily found in retinal microvasculature of diabetic rats exceeded levels measured in adult and aging rat retinas. In aging rats, retinal expression of senescence associated-factors was mainly localized at the level of the retinal pigmented epithelium and only minimally in the retinal microvasculature. The expression of oxidative/nitrative stress markers such as 4-hydroxynonenal and nitrotyrosine was more pronounced in the retinal vasculature of diabetic rats as compared to normoglycemic aging and adult rat retinas. Treatments of STZ-rats with the anti-nitrating drug FeTPPS (10mg/Kg/day) significantly reduced the appearance of senescence markers in the retinal microvasculature. Our results demonstrate that hyperglycemia accelerates retinal microvascular cell aging whereas physiological aging affects primarily cells of the retinal pigmented epithelium. In conclusion, hyperglycemia-induced retinal vessel dysfunction and DR progression involve vascular cell senescence due to increased oxidative/nitrative stress.


Conflict of interest statement

Competing Interests: The authors have declared that no competing interests exist.

Figures

Fig 1
Fig 1. SA-β-gal staining in cross sections of aging and STZ-rat retinas.
SA-β-gal (blue color) was detected using immunohistochemical analysis of 20 μm frozen retinal sections from 4.5 months old normoglycemic controls (A), STZ-rats, at 8 (B) and 12 weeks (C) of hyperglycemia, and normoglycemic aging rats at 12 (D) and 14 (E) months of age. Images were captured at 20X magnification. Scale bar equal to 50 μ m. Black arrows are pointing areas of positive reactivity for SA-β-gal (blue color).
Fig 2
Fig 2. SA-β-gal staining in inner retinal flat mounts.
Positivity of SA-β-gal at pH6 (black arrows) was assessed in retinal flat mounts from 4.5 month old normoglycemic controls (A), STZ-rats at 8 weeks (B,D) and 12 weeks (C) of hyperglycemia and in non-diabetic aging rats at 12 (E) and 14 (F) months of age. In panel D, SA-β-gal reactivity is showed at 63X magnification to demonstrate positive reactivity in microvascular structures in the diabetic retina (8 weeks of hyperglycemia, black arrowheads). MV = microvascular vessels, V/A = venules/arterioles. Scale bar equal to 20 μ m.
Fig 3
Fig 3. SA-β-gal in RPE flat mounts.
Bright-field images show SA-β-gal positive areas found in RPE flat mounts from age-matched (4.5 months old) normoglycemic control rats (A),STZ-rats, at 8 (B) and 12 weeks (C) of hyperglycemia, or in normoglycemic aging rats at12 (D) and 14 (E) months of age. Scale bar equal to 20 μ m.
Fig 4
Fig 4. SIRT-1 expression and activity in rat retinas.
A) Expression of SIRT-1 at mRNA level was measured using qPCR in retinal extracts from control, diabetic, and aging rat retinas. MRNA levels were calculated as a ratio to β-actin expression and normalized to baseline controls. x± S.D, *p<0.02 vs C rat retina; #p<0.02 vs D8wks diabetic; °p<0.05 vs D12wks diabetic n = 6. B) Bar histogram showing SIRT-1 protein levels normalized to β-actin in retinal extracts. x ± S.D.,*p<0.04 vs control rat retina; #p<0.02, n = 6. C) Changes in enzymatic activity of SIRT-1 in vivo are displayed in bar histogram. x ± S.D, *p<0.05 vs control rat retina; #p<0.02 vs D8wks, n = 6. Control retinas = white bar; aging retinas = gray bar; diabetic retinas = black bar. D-H) Retinal frozen sections were probed with anti-SIRT1 (green) and anti-isolectin (red) to detect SIRT-1-specific immunoreactivity in control (D), diabetic (E-F), and aging (G-H) rats. White arrows are indicating areas of merging double labeling (yellow) in inner blood vessels. White asterisks indicate areas SIRT1 immunoreactivity at the RPE/choroid level. Hoescht staining was used to detect nuclei (blue). Scale bar equal to 50 μ m.
Fig 5
Fig 5. Measurements of p16INK4a levels in rat retinas.
A) Expression of p16INK4a at mRNA level was measured using qPCR in retinal extracts from control, STZ, and aging rat retinas (as indicated above). Levels of p16INK4A specific mRNA are expressed as a ratio to β-actin and normalized to baseline controls. x ± S.D, *p<0.009 vs control 4.5 month rat retina; #p<0.01 vs D8wks, n = 6. B) Western blotting analysis measuring p16INK4a protein levels; bar histogram depicts p16INK4a protein levels normalized to β-actin in retinal extracts. x ± S.D,*p<0.01 vs C; #p<0.04 vs D8wks diabetic, n = 6. Control retinas = white bar; aging retinas = gray bar; diabetic retinas = black bar. C-G) Frozen retinal sections were probed with anti-p16INK4a (green) antibodies and isolectin B4 (red) to detect anti-p16INK4a -specific immunoreactivity in retinal vessels of control (C), diabetic (D-E), and aging (F-G) rats. Areas of merging labeling (yellow) are indicated by the white arrows. White asterisks show p16INK4a positivity at the RPE/choroid level. Hoescht staining was used to detect cellular nuclei (blue). Scale bar equal to 50 μm.
Fig 6
Fig 6. Assessment of miR34a expression.
MiR-34a detection was evidenced by in situ hybridization in retinal sections of control (4.5 months old), 8 wks diabetic, and 14 months old aging rats. Representative images of control (A), diabetic (B), and aging (C) rat retinas probed for MiR-34a-DIG are depicted in each panel. D) Control retina probed with scrambled miRNA. Scale bar 50 μ m. In E) bar histogram representing relative fluorescence units of miR34a amplicons measured by qPCR.x ± S.D, *p<0.01 vs C 4.5 month rat retina, n = 6.
Fig 7
Fig 7. Measurements of lipid oxidative modifications.
Bar histogram is representative of measurements of chloroform/methanol extracted hydroperoxides (A) in retinal rat tissues in the different treatment groups. x ± S.D, *p<0.0001 vs C, #p<0.0001 vs D8wks, °p<0.0001 vs D8wks, n = 6. Immunohistochemical analysis using anti-4-HNE specific antibodies in retinal flat mounts is shown in panels B and C. Areas of merging labeling (yellow) are indicated by the white arrows. White arrowheads indicate extravascular areas immunoreactive to 4-HNE. Scale bar equal to 20 μ m.
Fig 8
Fig 8. Measurements of nitrative modifications.
Representative images of immunohistochemical analysis using anti-nitrotyrosine in retinal flat mounts to demonstrate changes in retinal NY formation in the different treatment groups. Double labeling with isolectin B4 was used to specifically assess NY immunoreactivity in the retinal microvasculature. Areas of merging labeling (yellow) are indicated by the white arrows. Non-vascular areas immunoreactive to NY are indicated by white arrowheads. Scale bar equal to 20 μ m.
Fig 9
Fig 9. FeTPPS effects on lipid peroxidation and nitrotyrosine formation.
Representative images of anti-nitrotyrosine (A,B) and anti-4-HNE (C,D) immunoreactivity (green) in retinal flat mount preparations of STZ-diabetic rats in comparison to retinas of diabetic rats that were treated with FeTPPS. Double labeling for isolectin B4 (red) was performed to visualize merging areas (yellow) corresponding to vascular structures. Scale bar equal to 20 μ m.
Fig 10
Fig 10. Senescence-associated retinal changes with FeTPPS treatment.
A,B) Retinal frozen sections from diabetic and diabetic + FeTPPS groups were probed at pH6 for detection of SA-β-gal positivity (blue, black arrows). Representative images from frozen retinal sections probed with anti-SIRT1 (C, D) and anti-p16INK4a (E, F) (green) to detect immunoreactivities in diabetic and retinas of FeTPPS- treated diabetic rats. Sections were co-labeled with anti-isolectin B4 (vascular structures, red). Hoescht staining was used to detect nuclei (blue). Scale bar equal to 50μm.

References

    1. Sivaprasad S, Gupta B, Crosby-Nwaobi R, Evans J. Prevalence of diabetic retinopathy in various ethnic groups: a worldwide perspective. Survey of ophthalmology. 2012;57(4):347–70. 10.1016/j.survophthal.2012.01.004 . - DOI - PubMed
    1. Caldwell RB, Bartoli M, Behzadian MA, El-Remessy AE, Al-Shabrawey M, Platt DH, et al. Vascular endothelial growth factor and diabetic retinopathy: pathophysiological mechanisms and treatment perspectives. Diabetes/metabolism research and reviews. 2003;19(6):442–55. 10.1002/dmrr.415 . - DOI - PubMed
    1. Stitt AW, Gardiner TA, Archer DB. Histological and ultrastructural investigation of retinal microaneurysm development in diabetic patients. The British journal of ophthalmology. 1995;79(4):362–7. - PMC - PubMed
    1. Simo R, Hernandez C, European Consortium for the Early Treatment of Diabetic R. Neurodegeneration in the diabetic eye: new insights and therapeutic perspectives. Trends in endocrinology and metabolism: TEM. 2014;25(1):23–33. 10.1016/j.tem.2013.09.005 . - DOI - PubMed
    1. Barber AJ, Lieth E, Khin SA, Antonetti DA, Buchanan AG, Gardner TW. Neural apoptosis in the retina during experimental and human diabetes. Early onset and effect of insulin. The Journal of clinical investigation. 1998;102(4):783–91. 10.1172/JCI2425 - DOI - PMC - PubMed

Publication types

MeSH terms