. 2015 Oct 29;526(7575):700-4.
doi: 10.1038/nature14980. Epub 2015 Oct 14.

Telomerase activation by genomic rearrangements in high-risk neuroblastoma

Affiliations

Telomerase activation by genomic rearrangements in high-risk neuroblastoma

Martin Peifer et al. Nature. .

Abstract

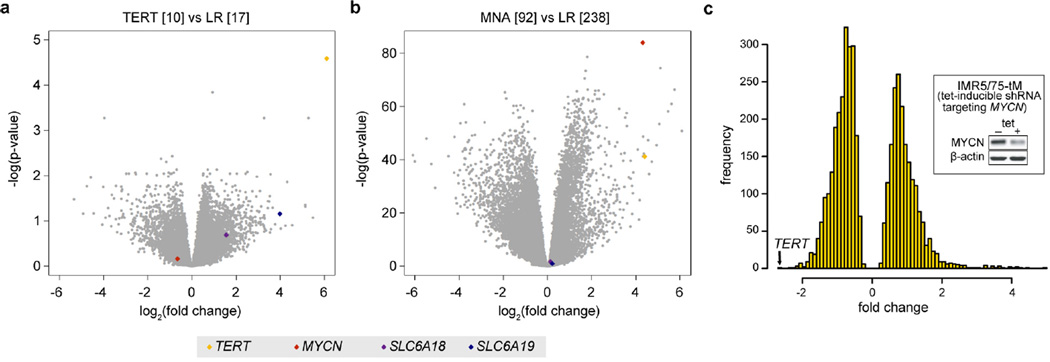
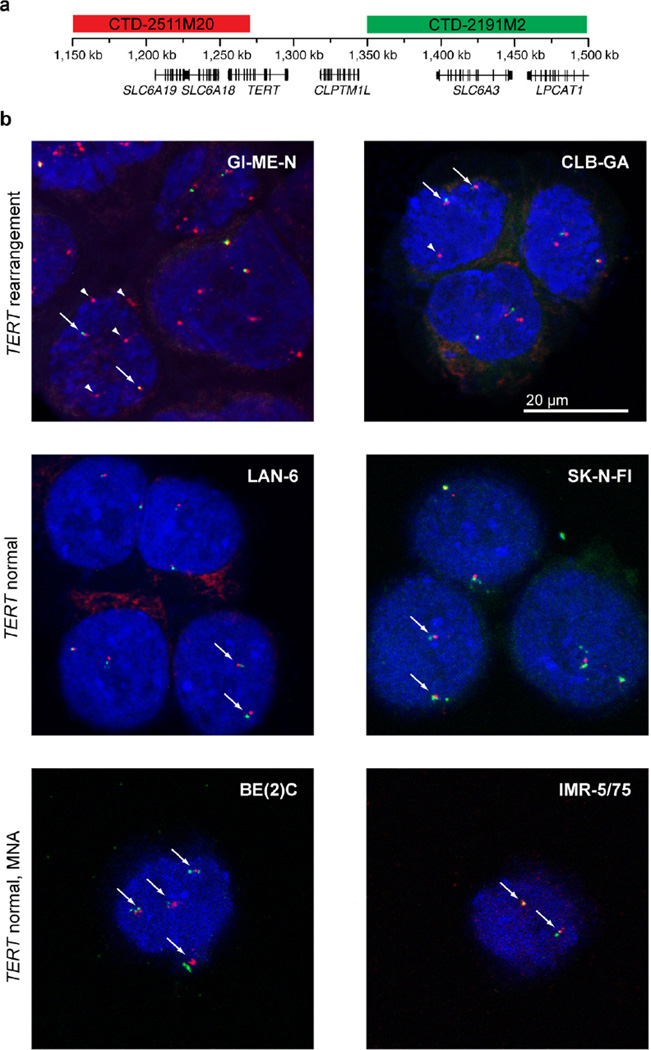
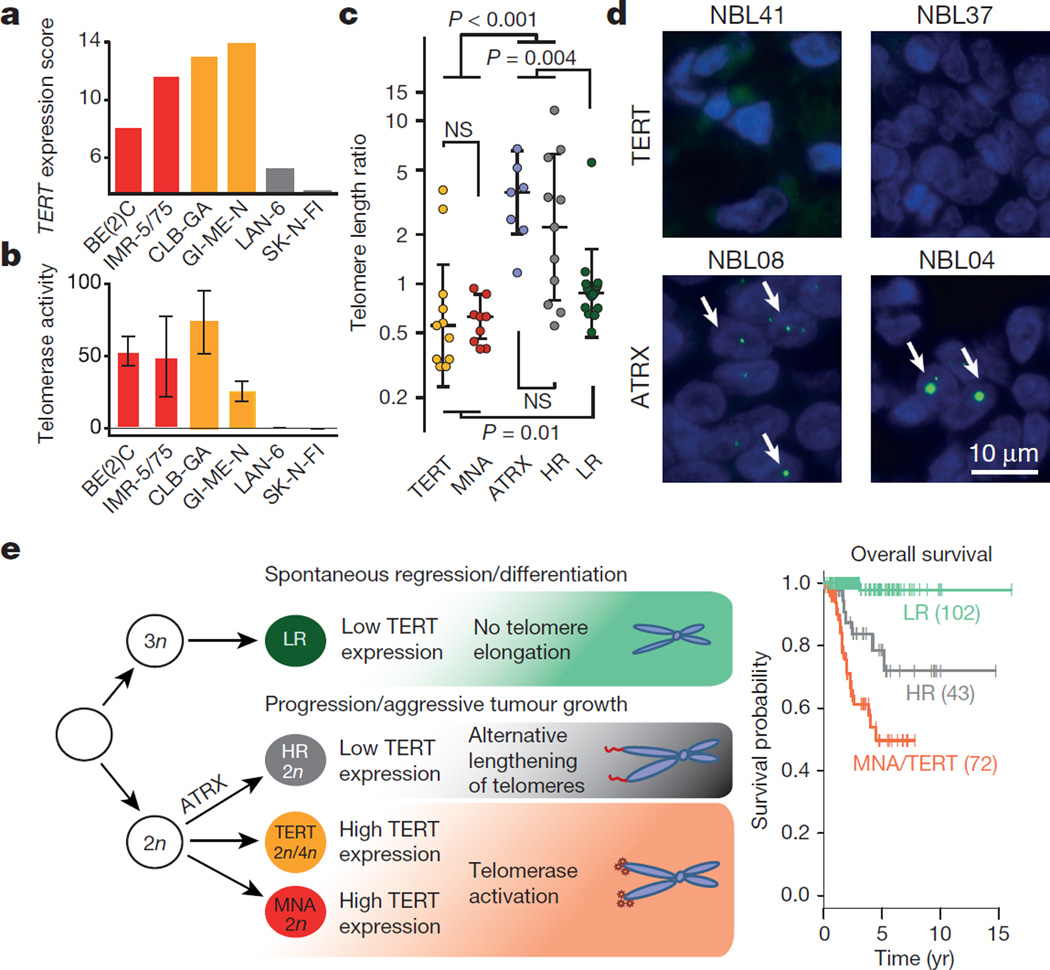
Neuroblastoma is a malignant paediatric tumour of the sympathetic nervous system. Roughly half of these tumours regress spontaneously or are cured by limited therapy. By contrast, high-risk neuroblastomas have an unfavourable clinical course despite intensive multimodal treatment, and their molecular basis has remained largely elusive. Here we have performed whole-genome sequencing of 56 neuroblastomas (high-risk, n = 39; low-risk, n = 17) and discovered recurrent genomic rearrangements affecting a chromosomal region at 5p15.33 proximal of the telomerase reverse transcriptase gene (TERT). These rearrangements occurred only in high-risk neuroblastomas (12/39, 31%) in a mutually exclusive fashion with MYCN amplifications and ATRX mutations, which are known genetic events in this tumour type. In an extended case series (n = 217), TERT rearrangements defined a subgroup of high-risk tumours with particularly poor outcome. Despite a large structural diversity of these rearrangements, they all induced massive transcriptional upregulation of TERT. In the remaining high-risk tumours, TERT expression was also elevated in MYCN-amplified tumours, whereas alternative lengthening of telomeres was present in neuroblastomas without TERT or MYCN alterations, suggesting that telomere lengthening represents a central mechanism defining this subtype. The 5p15.33 rearrangements juxtapose the TERT coding sequence to strong enhancer elements, resulting in massive chromatin remodelling and DNA methylation of the affected region. Supporting a functional role of TERT, neuroblastoma cell lines bearing rearrangements or amplified MYCN exhibited both upregulated TERT expression and enzymatic telomerase activity. In summary, our findings show that remodelling of the genomic context abrogates transcriptional silencing of TERT in high-risk neuroblastoma and places telomerase activation in the centre of transformation in a large fraction of these tumours.


Figures

Extended Data Figure 1
Extended Data Figure 1. Validation of rearrangements of the TERT locus by dideoxy-sequencing
Sequencing chromatograms of the breakpoint regions of 5p15.33 rearrangements along with their genomic coordinates (hg19), and the breakpoint-spanning nucleotide sequences. The sequence mapping to the TERT locus is indicated in yellow, the rearrangement partner is indicated in grey; nucleotides inserted at the breakpoint region are indicated in white.
Extended Data Figure 2
Extended Data Figure 2. Schematic representation of chromothripsis in four primary neuroblastomas
a, Circos plots showing chromothripsis of chromosome 5 in the tumours NBL39 and NBL37. b, Circos plots showing chromothripsis of chromosomes 17 and 20 in the tumours NBL21 and NBL08, respectively. Regions showing loss of heterozygosity (LOH) are indicated by black segments.
Extended Data Figure 3
Extended Data Figure 3. TERT rearrangements are associated with poor event-free survival of patients, and with TERT upregulation independent of the breakpoint distance from the TERT transcriptional start site
a, Kaplan–Meier estimates for event-free survival of neuroblastoma patient groups defined by TERT rearrangements (TERT), MYCN amplification (MNA), high-risk disease without these alterations (HR), and low-risk or intermediate-risk disease (nonHR). Patients with tumours bearing both a TERT rearrangement and MYCN amplification (n = 5) were excluded. Event-free survival at 5 years: 0.17 ± 0.09 (TERT) versus 0.38 ± 0.09 (MNA) versus 0.43 ± 0.09 (HR) versus 0.83 ± 0.05 (nonHR). b, Multivariable Cox regression analysis of the potential prognostic factors stage, MYCN status, and TERT status for event-free survival in patients aged >18 months (n = 125). c, Validation of TERT expression levels by microarrays in the four neuroblastoma subgroups indicated above. Sample numbers are given at the bottom. **P < 0.01, ***P < 0.001. d, Fold-change of median TERT expression levels in TERT-rearranged and MYCN-amplified tumours compared with low-risk (LR) neuroblastomas as measured by transcriptome sequencing. e, Evidence for monoallelic expression of TERT in five tumours bearing TERT rearrangements. The presence of a heterozygous single nucleotide polymorphism and its allelic fraction measured by whole-genome sequencing (WGS) is shown on the left of each panel; monoallelic expression as established by transcriptome sequencing (RNA-seq) is indicated on the right. The genomic position of the single nucleotide polymorphism is indicated at the top, the number of reads available for the analysis is shown at the bottom. f, TERT expression measured by transcriptome sequencing in relation to the distance of the rearrangement breakpoint from the TERT transcriptional start site (TSS). TERT expression levels and breakpoint distances from the TERT transcriptional start site were not correlated (r = 0, P = 0.97; Spearman’s rank correlation test).
Extended Data Figure 4
Extended Data Figure 4. TERT rearrangements are maintained in relapsed neuroblastoma
a, Agarose gel electrophoresis of PCR products representing individual TERT rearrangements in four tumours at initial diagnosis (I), and at relapse (R). The non-template controls are indicated by C. b, TERT expression measured by microarrays in relapsed TERT-rearranged tumours (n = 3) compared with TERT-rearranged tumours biopsied at initial diagnosis (n = 10). c, Sequencing chromatograms of the breakpoint regions for the relapse cases.
Extended Data Figure 5
Extended Data Figure 5. Regional effects of TERT rearrangements on gene expression patterns
a, Expression levels of genes around TERT measured by transcriptome sequencing are shown for tumours with TERT rearrangements (TERT, yellow), tumours with MYCN amplifications (MNA, red), and tumours without these aberrations classified as either high-risk (HR, grey) or low-risk (LR, green). Five consecutive genes (TERT, bleyplaby, SLC6A18, SLC6A19, and rarjy) located distal of the breakpoint at chromosome 5p15.33, and three genes (suweeby, blorplaby, and CLPTM1L) located proximal of the breakpoint are shown. Genomic positions of the genes are indicated at the top, and sample sizes are indicated at the bottom. NS, not significant, *P < 0.05, **P < 0.01, ***P < 0.001. b, Averaged expression levels of genes measured by transcriptome sequencing are indicated for an ~500 kb region centring around TERT. Colour codes of neuroblastoma subgroups as indicated above. The breakpoint region is indicated in beige.
Extended Data Figure 6
Extended Data Figure 6. TERT mRNA levels are massively upregulated in TERT-rearranged and MYCN-amplified neuroblastomas
a, Differential gene expression between TERT-rearranged (n = 10) and low-risk (n = 17) neuroblastomas and b, between MYCN-amplified (MNA, n = 92) and low-risk tumours (n = 238) measured by transcriptome sequencing. Negative log(P values) are plotted against log2(fold changes) of the genes expressed in the respective subgroups. Genes of interest are indicated at the bottom. log2(fold changes) correspond to the log difference of established gene expression scores. P values were established using Student’s t-tests and applying a Benjamini and Hochberg false discovery rate multiple testing correction. c, Analysis of differential gene expression of a MYCN-amplified neuroblastoma cell line (IMR-5/75) before and after shRNA-mediated knockdown of MYCN using transcriptome sequencing. The number of genes (frequency) up- or downregulated upon MYCN knockdown is plotted against the fold change of regulation. TERT is the most strongly downregulated gene upon shRNA-mediated MYCN knockdown. Only differentially expressed genes (t-test, false discovery rate controlled with P < 0.01) are shown. The insert shows reduced MYCN protein levels after induction of a MYCN-specific shRNA in IMR-5/75 cells as well as β-actin protein levels as control analysed by immunoblotting.
Extended Data Figure 7
Extended Data Figure 7. Detection of TERT rearrangements in neuroblastoma cell lines
a, Schematic representation of binding sites of probes used for FISH at the TERT locus. b, FISH analysis of neuroblastoma cell lines with 5p15.33 rearrangements and without these rearrangements; MNA, MYCN-amplified. Arrows indicate the unaltered status of chromosome 5p15.33 (red signals in close proximity to green signals); arrowheads indicate a rearrangement of 5p15.33 (red signals without adjacent green signals).
Extended Data Figure 8
Extended Data Figure 8. Patterns of H3K27me3 histone modification and DNA methylation at the TERT locus
a, Survey of the histone mark H3K27me3 in neuroblastomas harbouring TERT rearrangements (cell line GI-ME-N and primary tumour NBL36) and a neuroblastoma cell line lacking these alterations (SK-N-FI). b, DNA methylation patterns of CpG sites at the TERT locus in TERT-rearranged (TERT, n = 6) and MYCN-amplified (MNA, n = 9) primary neuroblastomas, as well as tumours lacking these alterations (others, n = 24) using HumanMethylation450 microrrays. Samples are ordered from top to bottom. CpG sites are indicated relative to their position to the TERT locus. Average methylation levels of each CpG site in the three subgroups are shown at the top. Similar to the highlighted CpG site cg11625005 upstream of the TERT transcriptional start site (Fig. 3d), CpG sites scattered over the TERT gene body were methylated significantly higher in TERT-rearranged and MYCN-amplified cases than in tumours without these alterations (P < 0.001 each).
Extended Data Figure 9
Extended Data Figure 9. ALT activity in neuroblastoma cell lines lacking TERT rearrangements and MYCN amplifications
a, Detection of extrachromosomal telomeric repeat DNA by C-circle assays with genomic AluI/MboI digested DNA from the indicated neuroblastoma cell lines. The ALT-positive control cell line, U2OS, is at the left. b, Detection of ALT-associated PML bodies in the indicated cell lines. Telomeric TTAGGG FISH (green) and immunofluorescence for PML (red) were combined and DNA was counterstained with DAPI (blue). c, Telomere restriction-fragment analysis of telomeric DNA from LAN-6, SK-N-FI, and the ALT-positive control U2OS. Telomeric DNA was detected by Southern blot with a [32P]dATP end-labelled (CCCTAA)4 oligonucleotide.
Figure 1
Figure 1. Genomic rearrangements are clustered at chromosome 5p15.33 in high-risk neuroblastoma
a, Distribution of genomic rearrangements occurring within regions of 100 kb in 56 primary neuroblastomas. Rearrangements clustering in more than three tumours are highlighted in red. b, Detail of genomic translocations occurring at chromosome 5p15.33 (n = 12) and their corresponding rearrangement partner (right). Levels of genomic copy numbers are colour-coded. c, Prevalence of MYCN amplification, TERT rearrangements, genomic alterations of ATRX and ALK, and chromothripsis in 56 primary neuroblastomas. Samples are ordered from left to the right. The number of somatic mutations per tumour and the clinical risk group assessment are given at the top. Tumour ploidy, telomere length ratio (both estimated from sequencing data), age of patient at diagnosis, and tumour stage are displayed at the bottom. S, stage 4S tumours.
Figure 2
Figure 2. Genomic TERT rearrangements are associated with poor patient outcome and high TERT mRNA expression
a, Prevalence of TERT rearrangements in 217 primary neuroblastomas. TERT rearrangements were identified by whole-genome or targeted sequencing and break-apart FISH, exemplarily shown in the lower panel (red, TERT; green, CLPTM1L). b, Overall survival of neuroblastoma patient groups defined by TERT rearrangements (TERT), MYCN amplification (MNA), high-risk disease without these alterations (HR), and low-risk or intermediate-risk disease (non-HR). Patients with tumours bearing both a TERT rearrangement and MYCN amplification (n = 5) were excluded. Overall survival at 5 years: 0.41 ± 0.16 (TERT) versus 0.54 ± 0.10 (MNA) versus 0.79 ± 0.08 (HR) versus 0.98 ± 0.02 (LR). c,Multivariable Cox regression analysis of the potential prognostic factors stage, MYCN status, and TERT status for overall survival in patients aged >18 months (n = 125). d, Distribution of TERT mRNA levels derived from transcriptome sequencing of the groups defined above: tumours with TERT rearrangements (yellow, n = 10), MYCN amplifications (red, n = 9), high-risk tumours without the aforementioned aberrations (grey, n = 18), among which ATRX-mutated cases are highlighted by blue circles (n = 7), and low-risk tumours (green, n = 17). Error bars, median expression and s.d. e, Comparison of TERT expression in those tumour subgroups defined by TERT copy numbers (bottom: left, two copies; middle, three or four copies; right, more than four copies). TERT expression levels in relation to TERT copy numbers in TERT rearranged cases (top). f, Relative average gene expression levels at the TERT locus. Subgroups of tumours with TERT rearrangements (yellow), MYCN amplification (red), high-risk tumours without the aforementioned aberrations (grey), and low-risk tumours (green) are compared with average expression in a large cohort of neuroblastoma samples (n = 498).
Figure 3
Figure 3. Translocation of active enhancers drive TERT expression in TERT-rearranged neuroblastomas
a, Normalized read counts of H3K27ac and H3K4me1 histone marks derived from ChIP-seq at the TERT rearrangement region in three neuroblastomas. Significant peaks of H3K27ac read counts are displayed by black bars. Enhancer elements identified by stitched peak calls within 12.5 kb regions are shown in pale red. The enhancer element showing highest peak signals within a 0.5 Mb region upstream of the rearrangement breakpoint is highlighted in dark red. b, Enhancer elements were ranked according to cumulated read counts over the stitched peak calls. The strongest element identified within the rearranged region of the respective sample is depicted by red circles. Orange circles indicate the strongest enhancer elements in genomic regions affected by rearrangements in other TERT-rearranged tumours (n = 10; only non-inverted rearrangements are shown). c, Survey of the five histone marks H3K4me3, H3K4me1, H3K27ac, H3K36me3, and H3K9me3 in neuroblastomas harbouring TERT rearrangements (cell line GI-ME-N and primary tumour NBL36; TERT), and neuroblastomas lacking TERT and MYCN alterations (cell line SK-N-FI and primary tumour NBL06; HR). d, DNA methylation of the CpG site cg11625005 proximal to the TERT core promoter in TERT-rearranged (TERT, n = 6) and MYCN-amplified cases (MNA, n = 9) as well as tumours without these alterations (high-risk neuroblastoma, n = 6; low-risk neuroblastoma, n = 18). Error bars, median methylation and s.d.
Figure 4
Figure 4. Telomerase activity is associated with TERT rearrangements and MYCN amplification, while ALT occurs in high-risk neuroblastoma lacking these alterations
a, b, TERT expression levels as determined by transcriptome sequencing (a) and telomerase activity (b) as determined by telomeric repeat amplification assay in neuroblastoma cell lines bearing TERT rearrangements (GI-ME-N and CLB-GA), MYCN amplification (SK-N-BE(2)C and IMR-5/75), and cell lines without these alterations (LAN-6 and SK-N-FI). c, Distribution of telomere length ratios between the tumours and matched normals (computed from whole-genome sequencing) in primary neuroblastoma subgroups defined by TERT, MYCN, and ATRX alterations and risk group (HR, high-risk without the aforementioned alterations; LR, low-risk). d, Telomere FISH analyses of two TERT-rearranged (NBL41, NBL37) and two ATRX-mutated (NBL08, NBL04) primary tumours. e, A revised model for neuroblastoma pathogenesis based on recurrent genomic alterations, the presence or absence of telomere maintenance pathways, and clinical courses of the disease (modified after ref. 24). In this model, high-risk tumours are distinguished from low-risk tumours by active mechanisms of telomere lengthening. The most aggressive neuroblastomas are defined by telomerase activation as a result of either TERT rearrangement (TERT) or MYCN amplification (MNA). In addition, near-diploid (2n) or near-tetraploid (4n) karyotypes are preferentially observed in high-risk tumours, while near-triploid karyotypes are mostly found in low-risk tumours. Overall survival of patient subgroups at 5 years: 0.51 ± 0.08 (MNA/TERT) versus 0.79 ± 0.08 (high-risk tumours) versus 0.98 ± 0.02 (low-risk tumours).

References

    1. Maris JM, Hogarty MD, Bagatell R, Cohn SL. Neuroblastoma. Lancet. 2007;369:2106–2120. - PubMed
    1. Molenaar JJ, et al. Sequencing of neuroblastoma identifies chromothripsis and defects in neuritogenesis genes. Nature. 2012;483:589–593. - PubMed
    1. Pugh TJ, et al. The genetic landscape of high-risk neuroblastoma. Nature Genet. 2013;45:279–284. - PMC - PubMed
    1. Sausen M, et al. Integrated genomic analyses identify ARID1A and ARID1B alterations in the child hood cancer neuroblastoma. Nature Genet. 2013;45:12–17. - PMC - PubMed
    1. Cheung NK, et al. Association of age at diagnosis and genetic mutations in patients with neuroblastoma. J. Am. Med. Assoc. 2012;307:1062–1071. - PMC - PubMed

Publication types

MeSH terms