. 2015 Oct 22;526(7574):525-30.
doi: 10.1038/nature15395. Epub 2015 Oct 14.

Mutations driving CLL and their evolution in progression and relapse

Affiliations

Mutations driving CLL and their evolution in progression and relapse

Dan A Landau et al. Nature. .

Abstract

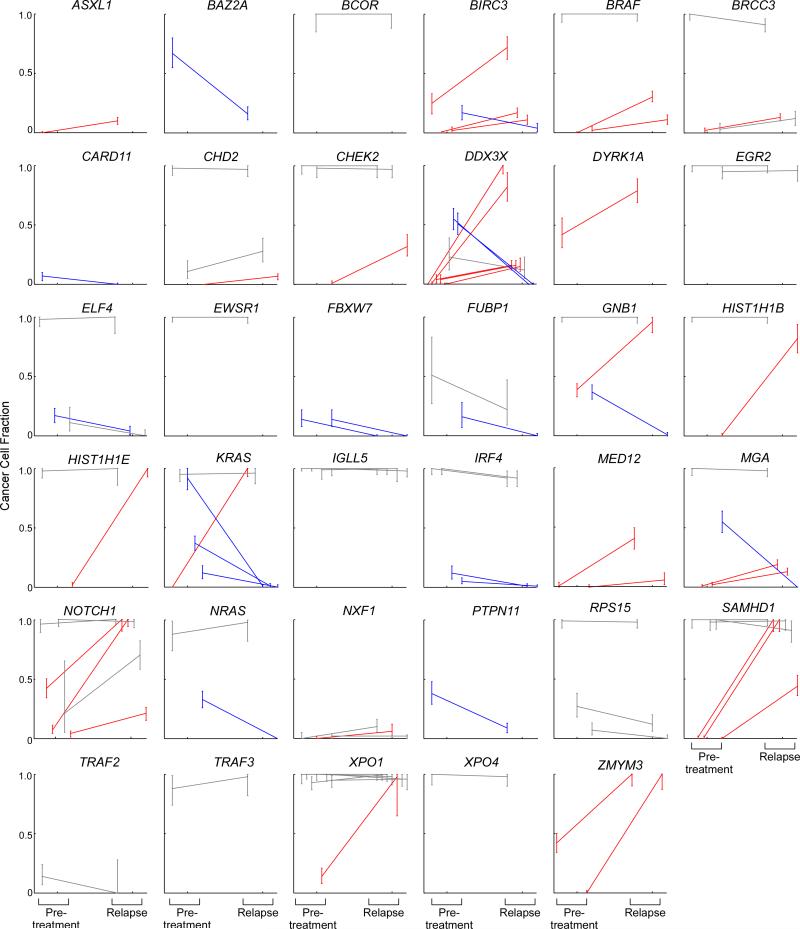
Which genetic alterations drive tumorigenesis and how they evolve over the course of disease and therapy are central questions in cancer biology. Here we identify 44 recurrently mutated genes and 11 recurrent somatic copy number variations through whole-exome sequencing of 538 chronic lymphocytic leukaemia (CLL) and matched germline DNA samples, 278 of which were collected in a prospective clinical trial. These include previously unrecognized putative cancer drivers (RPS15, IKZF3), and collectively identify RNA processing and export, MYC activity, and MAPK signalling as central pathways involved in CLL. Clonality analysis of this large data set further enabled reconstruction of temporal relationships between driver events. Direct comparison between matched pre-treatment and relapse samples from 59 patients demonstrated highly frequent clonal evolution. Thus, large sequencing data sets of clinically informative samples enable the discovery of novel genes associated with cancer, the network of relationships between the driver events, and their impact on disease relapse and clinical outcome.


Figures

Extended Data Figure 1
Extended Data Figure 1. Candidate CLL cancer genes discovered in the combined cohort of 538 primary CLL samples
Significantly mutated genes identified in 538 primary CLL. Top panel: the rate of coding mutations (mutations per megabase) per sample. Center panel: Detection of individual gene found to be mutated (sSNVs or sINDELs) in each of the 538 patient samples (columns), color-coded by type of mutation. Only one mutation per gene is shown if multiple mutations from the same gene were found in a sample. Right panel: Q-values (red: Q<0.1; purple dashed: Q<0.05) and Hugo Symbol gene identification. New candidate CLL genes are marked with asterisks (*) Left panel: The percentages of samples affected with mutations (sSNVs and sINDELs) in each gene. Bottom panel: plots showing allelic fractions and the spectrum of mutations (sSNVs and sINDELs) for each sample.
Extended Data Figure 2
Extended Data Figure 2. Cellular networks and processes affected by putative CLL drivers
Putative CLL cancer genes cluster in pathways that are central to CLL biology such as Notch signaling, inflammatory response and B cell receptor signaling. In addition, proteins that participate in central cellular processes such as DNA damage repair, chromatin modification and mRNA processing, export and translation are also recurrently affected. Boxed in yellow—new CLL subpathways highlighted by the current driver discovery effort. Red circles- putative driver genes previously identified ; purple circles- newly identified in the current study.
Extended Data Figure 3
Extended Data Figure 3. RNAseq expression data for candidate CLL genes and targeted candidate driver validation
A. Matched RNAseq and WES data were available for 156 CLLs (103 CLLs previously reported in Landau et al. and 53 CLLs from the ICGC studies). From the WES of these 156 cases, we identified 318 driver mutations (sSNVs and sINDELs). For each site, we quantified the number of alternate reads corresponding to the somatic mutation in matched RNAseq data. We subsequently counted the number of instances in which a mutation was detected (‘detected’) and compared it to the number of instances in which mutation detection had >90% power based on the allelic fraction in the WES and the read depth in the RNAseq data (‘powered’). Overall, we detected 78.1% of putative CLL gene mutations at sites that had >90% power for detection in RNAseq data B. Targeted orthogonal validation (Access Array System, Fluidigm) was performed for 71 mutations (sSNVs and sINDELs) in putative CLL genes, affecting 47 CLLs from the CLL8 cohort (selected based on sample availability). With a mean depth of coverage of 7472X, 65 of the 71 mutations (91.55%) validated, with a higher variant allele fraction compared with normal sample DNA (binomial P <0.01).
Extended Data Figure 4
Extended Data Figure 4. Gene mutation maps for candidate CLL genes
Individual gene mutation maps are shown for all newly identified candidate CLL cancer genes not included in Fig. 2. The plots show mutation subtype (e.g., missense, nonsense etc) and position along the gene.
Extended Data Figure 5
Extended Data Figure 5. CLL copy number profiles
Copy number profile across 538 CLLs detected from WES data from primary samples (see Methods).
Extended Data Figure 6
Extended Data Figure 6. Annotation of drivers based on clinical characteristics and co-occurrence patterns
A. Putative drivers affecting greater than 10 patients were assessed for enrichment in IGHV mutated vs. unmutated CLL subtype (Fisher's exact test, magenta line denotes P = 0.05). B. Putative drivers affecting greater than 10 patients were assessed for enrichment in samples that received therapy prior to sampling (Fisher's exact test). Putative drivers affecting greater than 10 patients were tested for co-occurrence. Significantly high (C) or low (D) co-occurrences are shown (Q<0.1, Fisher's exact test with BH FDR, after accounting for prior therapy and IGHV mutation status, see Methods).
Extended Data Figure 7
Extended Data Figure 7. Mutation spectrum analysis, clonal vs. subclonal sSNVs
The spectrum of mutation is shown for the clonal and subclonal subsets of coding somatic sSNVs across WES of 538 samples. The rate is calculated by dividing the number of trinucleotides with the specified sSNVs by the covered territory containing the specified trinucleotide. Both clonal and subclonal sSNVs were similarly dominated by C>T transitions at C*pG sites. Thus, this mutational process that was previously associated with aging, not only predates oncogenic transformation (since clonal mutations will be highly enriched in mutations that precede the malignant transformation), but also is the dominant mechanism of malignant diversification after transformation in CLL.
Extended Data Figure 8
Extended Data Figure 8. The CLL driver landscape in the CLL8 cohort
Somatic mutation information shown across the 55 candidate CLL cancer genes and recurrent sCNVs (rows) for 278 CLL samples collected from patients enrolled on the CLL8 clinical trial primary that underwent WES (columns). Recurrent sCNA labels are listed in blue, and candidate CLL cancer genes are listed in bold if previously identified in Landau et al., and with an asterisk (*) if newly identified in the current study.
Extended Data Figure 9
Extended Data Figure 9. CLL8 patient cohort clinical outcome (from 278 patients) information by CLL cancer gene
Kaplan-Meier analysis (with logrank P values) for putative drivers not associated with significant impact on progression free survival (PFS) or overall survival (OS) in the cohort of 278 patients that were treated as part of the CLL8 trial. For candidate CLL genes tested here for the first time regarding impact on outcome, a Bonferroni P value is also shown.
Extended Data Figure 10
Extended Data Figure 10. Comparison of pre-treatment and relapse cancer cell fraction (CCF) for non-silent mutations in candidate CLL genes across 59 CLLs
For each CLL gene mutated across the 59 CLLs that were sampled longitudinally, the modal CCF is compared between the pre-treatment and relapse samples. CCF increases (red), decreases (blue) or stable (grey) over time are shown (in addition to CLL genes shown in Figure 6). A significant change in CCF over time (red or blue) was determined if the 95%CI of the CCF in the pre-treatment and relapse samples did not overlap.
Figure 1
Figure 1. The landscape of putative driver gene mutations and recurrent somatic copy number variations in CLL
Somatic mutation information is shown across the 55 putative driver genes and recurrent sCNVs (rows) for 538 primary patient samples (from CLL8 [green], Spanish ICGC [red], DFCI/Broad [blue]) that underwent WES (columns). Blue labels- recurrent sCNVs; Bold labels- putative CLL cancer genes previously identified in Landau et al.); asterisked labels- additional cancer genes identified in this study. Samples were annotated for IGHV status (black-mutated; white-unmutated; red-unknown), and for exposure to therapy prior to sampling (black-prior therapy; white – no prior therapy; red-unknown prior treatment status).
Figure 2
Figure 2. Selected novel putative driver gene maps
Individual gene mutation maps for select putative drivers, showing mutation subtype (e.g., missense), position and evidence of mutational hotspots, based on COSMIC database information (remaining gene maps shown in Extended Data Fig. 4).
Figure 3
Figure 3. Inferred evolutionary history of CLL
A. The proportion in which a recurrent driver is found as clonal or subclonal across the 538 samples is provided (top), along with the individual cancer cell fraction (CCF) values for each sample affected by a driver (tested for each driver with a Fisher's exact test, comparing to the cumulative proportions of clonal and subclonal drivers excluding the driver evaluated). Median CCF values are shown (bottom, bars represent the median and IQR for each driver). B. Temporally direct edges are drawn when two drivers are found in the same sample, one in clonal and the other in subclonal frequency. These edges are used to infer the temporal sequences in CLL evolution, leading from early, through intermediate to late drivers. Note that only driver pairs with at least 5 connecting edges were tested for statistical significance and only drivers connected by at least one statistically significant edge are displayed (see Methods, and Supplementary Tables 6 & 7).
Figure 4
Figure 4. Associations of CLL drivers with clinical outcome
A. Kaplan-Meier analysis (with logrank P values) for putative drivers with associated impact on progression free survival (PFS) or overall survival (OS) in the cohort of 278 patients that were treated as part of the CLL8 trial. For candidate CLL genes tested here for the first time regarding impact on outcome, a Bonferroni Q value is also shown. B. Presence of a subclonal driver is associated with shorter PFS, in both the FC and FCR arms, and a trend towards shorter OS.
Figure 5
Figure 5. Matched pre-treatment and relapse samples reveal patterns of clonal evolution in relation to therapy
A. The number and proportion of the patterns of clonal evolution of CLLs studied at pre-treatment and at relapse. B. Selected plots of 2D clustering of pre-treatment and relapse cancer cell fraction (CCF) demonstrating clonal stability of tri(12) (CLL case: GCLL115), concordant increase in CCFs of TP53 and del(17p) (GCLL27), clonal shifts in ATM sSNVs in a sample with clonally stable monoallelic deletion of ATM (GCLL307). Red coloring was added when greater than half of the CCF probability indicated >0.1 increase in CCF at relapse. C. Clonal evolution of CLL drivers. Left panel – for each driver with at least 4 instances detected across the 59 CLLs, the proportion of instances where the CCF increased (red), decreased (blue) or remained stable (grey) over time is shown (see Methods for details of the statistical analysis). The driver events were distributed to three main groups: predominately stable events (top); predominately increasing CCF (middle), and all other patterns (bottom). Right panel - Comparison (modal CCF with 95%CI) between pre-treatment and relapse samples for select CLL drivers (see Extended Data Fig. 10 for the remaining driver events from the cohort of 59 CLLs).

Comment in

References

    1. Quesada V, et al. Exome sequencing identifies recurrent mutations of the splicing factor SF3B1 gene in chronic lymphocytic leukemia. Nat Genet. 2012;44:47–52. doi:10.1038/ng.1032. - PubMed
    1. Puente XS, et al. Whole-genome sequencing identifies recurrent mutations in chronic lymphocytic leukaemia. Nature. 2011;475:101–105. doi:10.1038/nature10113. - PMC - PubMed
    1. Landau DA, et al. Evolution and impact of subclonal mutations in chronic lymphocytic leukemia. Cell. 2013;152:714–726. doi:10.1016/j.cell.2013.01.019. - PMC - PubMed
    1. Schuh A, et al. Monitoring chronic lymphocytic leukemia progression by whole genome sequencing reveals heterogeneous clonal evolution patterns. Blood. 2012;120:4191–4196. doi:10.1182/blood-2012-05-433540. - PubMed
    1. Lawrence MS, et al. Discovery and saturation analysis of cancer genes across 21 tumour types. Nature. 2014;505:495–501. doi:10.1038/nature12912. - PMC - PubMed

Additional bibliography for Extended Data Figures

    1. Alexandrov LB, et al. Signatures of mutational processes in human cancer. Nature. 2013;500:415–421. doi:10.1038/nature12477. - PMC - PubMed
    1. Vogelstein B, et al. Cancer genome landscapes. Science. 2013;339:1546–1558. doi:10.1126/science.1235122. - PMC - PubMed

Publication types

MeSH terms

Associated data