

Improving accuracy of genomic prediction by genetic architecture based priors in a Bayesian model
- PMID: 26466667
- PMCID: PMC4606514
- DOI: 10.1186/s12863-015-0278-9
Improving accuracy of genomic prediction by genetic architecture based priors in a Bayesian model
Abstract
Background: In recent years, with the development of high-throughput sequencing technology and the commercial availability of genotyping bead chips, more attention is being directed towards the utilization of abundant genetic markers in animal and plant breeding programs, human disease risk prediction and personal medicine. Several useful approaches to accomplish genomic prediction have been developed and used widely, but still have room for improvement to gain more accuracy. In this study, an improved Bayesian approach, termed BayesBπ, which differs from the original BayesB in priors assigning, is proposed. An effective method for calculating the locus-specific π by converting p-values from association between SNPs and traits' phenotypes is given and systemically validated using a German Holstein dairy cattle population. Furthermore, the new method is applied to a loblolly pine (Pinus taeda) dataset.
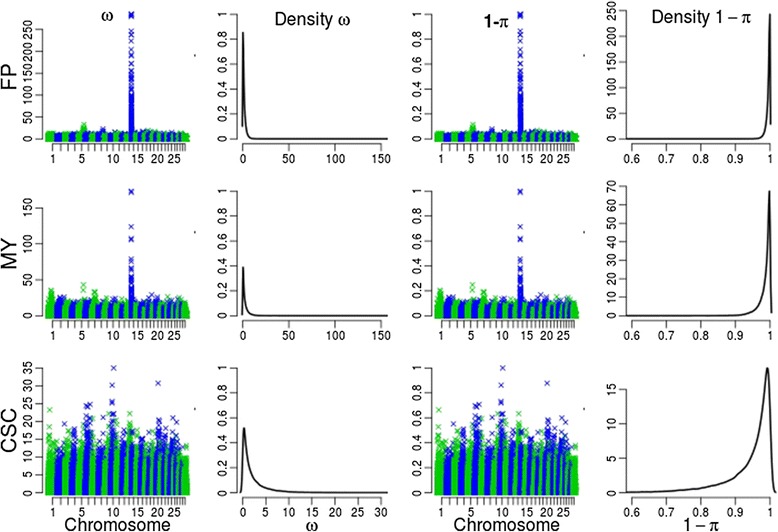
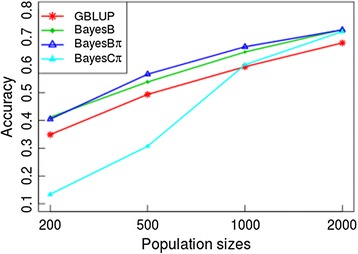
Results: Compared with the original BayesB, BayesBπ can improve the accuracy of genomic prediction up to 7.62% for milk fat percentage, a trait which shows a large effect of quantitative trait loci (QTL). For milk yield, which is controlled by small to moderate effect genes, the accuracy of genomic prediction can be improved up to 4.94%. For somatic cell score, of which no large effect QTL has been reported, GBLUP performs better than Bayesian methods. BayesBπ outperforms BayesCπ in 10 out of 12 scenarios in the dairy cattle population, especially in small to moderate population sizes where accuracy of BayesCπ are dramatically low. Results of the loblolly pine dataset show that BayesBπ outperforms BayesB in 14 out of 17 traits and BayesCπ in 8 out of 17 traits, respectively.
Conclusions: For traits controlled by large effect genes, BayesBπ can improve the accuracy of genomic prediction and unbiasedness of BayesB in moderate size populations. Knowledge of traits' genetic architectures can be integrated into practices of genomic prediction by assigning locus-specific priors to markers, which will help Bayesian approaches perform better in variable selection and marker effects shrinkage.
Figures
References
Publication types
MeSH terms
LinkOut - more resources
Full Text Sources
Other Literature Sources
Research Materials
Miscellaneous
