. 2016 May;14(5):1195-206.
doi: 10.1111/pbi.12485. Epub 2015 Oct 15.

High-density SNP genotyping array for hexaploid wheat and its secondary and tertiary gene pool

Affiliations

High-density SNP genotyping array for hexaploid wheat and its secondary and tertiary gene pool

Mark O Winfield et al. Plant Biotechnol J. 2016 May.

Abstract

In wheat, a lack of genetic diversity between breeding lines has been recognized as a significant block to future yield increases. Species belonging to bread wheat's secondary and tertiary gene pools harbour a much greater level of genetic variability, and are an important source of genes to broaden its genetic base. Introgression of novel genes from progenitors and related species has been widely employed to improve the agronomic characteristics of hexaploid wheat, but this approach has been hampered by a lack of markers that can be used to track introduced chromosome segments. Here, we describe the identification of a large number of single nucleotide polymorphisms that can be used to genotype hexaploid wheat and to identify and track introgressions from a variety of sources. We have validated these markers using an ultra-high-density Axiom(®) genotyping array to characterize a range of diploid, tetraploid and hexaploid wheat accessions and wheat relatives. To facilitate the use of these, both the markers and the associated sequence and genotype information have been made available through an interactive web site.

Keywords: genotyping array; next-generation sequencing; secondary and tertiary gene pools; single nucleotide polymorphism; wheat; wheat progenitors.


Figures

Figure 1
Figure 1
Single nucleotide polymorphisms (SNP) probe distribution across the hexaploid genome. Distribution of SNP‐probes per IWGSC contigs compared to contig length. The number of SNP‐probes per IWGSC was determined using ‘Exonerate’. For each SNPs per contig grouping the mean (red line) or median (green line) size of the contigs in base pairs (bp) was determined by standard means as was the linear regression (dotted line) of the mean contig length.
Figure 2
Figure 2
Examples of the six probe calling categories: (a) Poly High Resolution; (b) No Minor Hom; (c), Off‐Target Variants (OTV); (d) Mono High Resolution; (e) Call Rate Below Threshold; and (f) Other.
Figure 3
Figure 3
Number of probes categorised as polymorphic and high quality for each of the different comparisons. Box colours highlight the number of polymorphisms within and between groups; green represents low numbers and red high numbers.
Figure 4
Figure 4
(a) Principal coordinate plot (multidimensional scaling) of all 167 lines (14 D genome, 8 AB genome tetraploids, 10 wild relatives, 108 ABD genome hexaploids and 27 Watkins lines) against 546 299 SNP‐markers. The wild relatives are: 1. Ae. caudata (Ae. markgrafii; C genome), 2. Ae. mutica (syn. Amblyopyrum muticum; T genome), 3. Ae. speltoides (closest living relative to the B genome progenitor), 4. S. cereale (R genome), 5. Th. bessarabicum (J genome), 6. Th. elongatum (E genome), 7. Th. intermedium (JJ sS), 8. Th. ponticum (JJJJ sJs genome), 9. T. timopheevii (GA genome), 10. T. urartu (syn. T. monococcum ssp. aegilopoides; A genome progenitor). The genomes, ploidy and synonyms of these species are given in Table S1. (b) PCO plot of the putative lines belonging to the D genome progenitor, Ae. tauschii. Two distinct clusters are formed; these essentially reflect subspecies (Ae. tauschii ssp. strangulata or Ae. tauschii ssp. tauschii) and geographical location of collection. The strangulata lines, which are indicated by a blue star, all come from northern Iran. (c) PCO plot of the T. turgidum accessions. The first coordinate separates the T. turgidum ssp. dicoccoides line (red dot) from all the other lines that belong to subspecies durum. (d) PCO plot of the hexaploid accessions; blue = winter wheats, green = spring wheats, red = Watkins collection. The numbered lines are those that carry the 1BS/1RS translocation: 1 = Bacanora, 2 = Bobwhite, 3 = Brompton, 4 = Gatsby, 5 = Humber, 6 = Kielder, 7 = Lynx, 8 = Relay, 9 = Rialto, 10 = Savannah. Please note that the accessions Lynx and Savannah (7 and 10, respectively) collocate on the PCO plot.
Figure 5
Figure 5
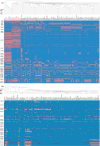
Heatmaps of genotype scores of 104 hexaploid varieties for loci mapped to chromosome (a) 1B and (b) 7DL. The genotypes are organised horizontically by a dendrogram produced using hierarchical cluster analysis and vertically by centimorgan position along the chromosome according to the Synthetic × Opata genetic map. Genotype scores have been coded for each locus as: 1 = least common genotype score; 2 = second most common genotype score and 3 = most common genotype score, and have been coloured according to the legend shown. (a) The heatmap of chromosome 1B shows the distinct haplotypes between those lines carrying the 1RS/1BS substitution (accession names highlighted in red; 0–133 cM) and those lines that do not. This figure also displays the lines belonging to Cadenza derived accessions (accession names highlighted in blue) which have a distinct haplotype on 1B (97.8–198 cM). (b) The heatmap of 7DL highlights accessions carrying Ae. ventricosa introgressions (accession names highlighted in red, 456.8–556.8 cM; accession names highlighted in blue, 551.7–556.8 cM).

References

    1. Akhunov, E. , Nicolet, C. and Dvorak, J. (2009) Single nucleotide polymorphism genotyping in polyploidy wheat with the Illumina GoldenGate assay. Theor. Appl. Genet. 119, 507–517. - PMC - PubMed
    1. Akhunov, E.D. , Akhunova, A.R. , Anderson, O.D. , Anderson, J.A. , Blake, N. , Clegg, M.T. , Coleman‐Derr, D. et al. (2010) Nucleotide diversity maps reveal variation in diversity among wheat genomes and chromosomes. BMC Genom. 11, 702–723. - PMC - PubMed
    1. Allen, A.M. , Barker, G.L. , Berry, S.T. , Coghill, J.A. , Gwilliam, R. , Kirby, S. , Robinson, P. et al. (2011) Transcript‐specific, single‐nucleotide polymorphism discovery and linkage analysis in hexaploid bread wheat (Triticum aestivum L.). Plant Biotechnol. J. 9, 1086–1099. - PubMed
    1. Allen, A.M. , Barker, G.L. , Wilkinson, P. , Burridge, A. , Winfield, M. , Coghill, J. , Uauy, C. et al. (2013) Discovery and development of exome‐based, codominant single nucleotide polymorphism markers in hexaploid wheat (Triticum aestivum L.). Plant Biotechnol. J. 11, 279–295. - PubMed
    1. Burt, C. and Nicholson, P. (2011) Exploiting co‐linearity among grass species to map the Aegilops ventricosa‐derived Pch1 eyespot resistance in wheat and establish its relationship to Pch2 . Theor. Appl. Genet. 123, 1387–1400. - PubMed

Publication types

Substances