. 2016 Jan 1;115(1):255-70.
doi: 10.1152/jn.00530.2015. Epub 2015 Oct 14.

Information processing in the hemisphere of the cerebellar cortex for control of wrist movement

Affiliations

Information processing in the hemisphere of the cerebellar cortex for control of wrist movement

Saeka Tomatsu et al. J Neurophysiol. .

Abstract

A region of cerebellar lobules V and VI makes strong loop connections with the primary motor (M1) and premotor (PM) cortical areas and is assumed to play essential roles in limb motor control. To examine its functional role, we compared the activities of its input, intermediate, and output elements, i.e., mossy fibers (MFs), Golgi cells (GoCs), and Purkinje cells (PCs), in three monkeys performing wrist movements in two different forearm postures. The results revealed distinct steps of information processing. First, MF activities displayed temporal and directional properties that were remarkably similar to those of M1/PM neurons, suggesting that MFs relay near copies of outputs from these motor areas. Second, all GoCs had a stereotyped pattern of activity independent of movement direction or forearm posture. Instead, GoC activity resembled an average of all MF activities. Therefore, inhibitory GoCs appear to provide a filtering function that passes only prominently modulated MF inputs to granule cells. Third, PCs displayed highly complex spatiotemporal patterns of activity, with coordinate frames distinct from those of MF inputs and directional tuning that changed abruptly before movement onset. The complexity of PC activities may reflect rapidly changing properties of the peripheral motor apparatus during movement. Overall, the cerebellar cortex appears to transform a representation of outputs from M1/PM into different movement representations in a posture-dependent manner and could work as part of a forward model that predicts the state of the peripheral motor apparatus.

Keywords: Golgi cell; Purkinje cell; cerebellar cortex; monkey; mossy fiber; motor control.


Figures

Fig. 1.
Fig. 1.
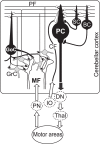
Basic neuron circuitry of the cerebro-cerebellar loop. The region of the cerebellar cortex where we recorded neuron activities has strong loop connections with cortical motor areas. White terminals represent excitatory synapses, and black terminals represent inhibitory synapses. BC, basket cell; CF, climbing fiber; DN, dentate nucleus; GoC, Golgi cell; GrC, granule cell; IO, inferior olive; MF, mossy fiber; PC, Purkinje cell; PF, parallel fiber; PN, pontine nucleus; SC, stellate cell; Thal, thalamus.
Fig. 2.
Fig. 2.
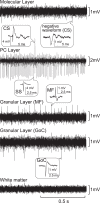
Identification of the different layers of the cerebellar cortex based on characteristic patterns of extracellular field potentials and single-cell activities. Typical field potential recordings for each layer of the cerebellar cortex are shown in order from surface to depth. Typical examples of single-unit activities are shown with higher time resolutions in the balloons. CS, complex spike; SS, simple spike.
Fig. 3.
Fig. 3.
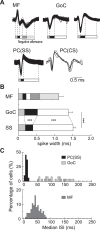
Characteristics of spikes and interspike intervals (ISIs) for MFs, GoCs, and PCs. A: typical examples of spikes for different types of neurons. We identified timings of onset, offset, and peaks of negative and positive potential changes of the spikes. We then calculated intervals between adjacent events to quantify the characteristic waveforms of the neurons. For instance, typical spikes of an MF were divided into 5 periods. In contrast, typical spikes of a GoC or SSs of a PC were generally divided into 3 periods with different durations. B: average intervals for each period. Durations of the second and third periods were significantly different between GoCs and SSs of PCs (***P < 0.01). C: distribution of median ISI of the 3 types of cerebellar neurons in the resting state. 25 PCs, 25 GoCs, and 73 MFs were used. They were selected because they were recorded in the same track and/or in a nearby track using the same electrode and allowed comparison of data recorded with similar experimental conditions.
Fig. 4.
Fig. 4.
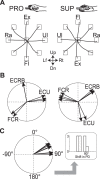
Movement trajectories of the wrist and preferred directions of wrist prime movers in 2 forearm postures, fully pronated (PRO) and fully supinated (SUP) (see top insets). A: averaged movement trajectories to 8 peripheral targets for monkey S. The target locations required 20° changes in the angle of the wrist joint. Each trace represents an average of 10 trials. Up, up; Rt, right; Dn, down; Lf, left; Ex, extension; Fl, flexion; Ra, radial deviation; Ul, ulnar deviation. B: preferred direction (PD) of 3 prime movers of the wrist joint for monkey S. ECRB, extensor carpi radialis brevis; ECU, extensor carpi ulnaris; FCR, flexor carpi radialis. C: change in PDs of the muscles when posture was rotated from PRO (normalized to 0) to SUP, i.e., a subtraction between the 2 diagrams in B. The right inset shows the same data plotted as a histogram (bin width = 10°) and illustrates the method of deriving the histograms in Fig. 10.
Fig. 5.
Fig. 5.
Distribution of task-related MFs, GoCs, and PCs in the cerebellar cortex. A: dorsal view of the right cerebellar hemisphere of monkey W. The open star indicates the center of the recording chamber. The gray dot indicates the location of a PC that was identified by the electrolytic lesion shown in B. PF, primary fissure; IV-VI, lobules IV-VI; R, rostral; L, lateral. B: coronal section of the cerebellum of monkey W at the level of the transverse gray line with the gray dot in A. The gray dots in A and B indicate the location of an electrolytic lesion marking a PC. The dashed line indicates a recording track. AIP, anterior interpositus nucleus; PIP, posterior interpositus nucleus; h, hilum; D, dorsal. C: distribution of task-related MFs, GoCs, and PCs for the 3 animals. Open circles indicate track locations of recorded MFs, inverse rectangles indicate track locations of recorded GoCs, and open diamonds indicate track locations of recorded PCs. For monkey W, the location of the PF (indicated by the black line) was confirmed with histology. For monkeys M and S, the gray lines indicate estimated locations of the PF. The intersection of the 2 dashed lines indicates the center of the recording chamber in each animal.
Fig. 6.
Fig. 6.
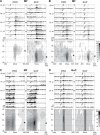
Raster plots, histograms, and contour plots of typical examples of activity of 3 sample MFs (A–C) and 1 GoC (D) in 2 postures (PRO and SUP). The abscissae represent time (in ms) relative to movement onset (Move). The ordinates represent movement direction. In PRO, Up, Rt, Dn, and Lf correspond to ex, ul, fl, and ra, respectively. In SUP, Up, Rt, Dn, and Lf correspond to fl, ra, ex, and ul, respectively (see also Fig. 4A). Inverted open triangles in the rasters indicate the timing of the “GO” cue in each trial. Bin width of histograms is 10 ms for MFs and 20 ms for the GoC. Each tick mark on the ordinate of the histograms represents 50 Hz; thus 2 ticks represent 100 Hz. The contour plots show the same data as that in the histograms presented here. The scale of each contour plot is normalized to the maximum firing rate of each neuron (= 100%) during the task period. The scale for activity of the GoC is coarser than that for MFs and PCs attributable to the much lower maximum firing rates of GoCs (<30 Hz). The arrows beside each contour plot indicate the PD in a time window that includes neural activity related to movement onset (A, B, D = −100 to 100 ms relative to movement onset; C = −200 to 0 ms relative to movement onset). Black arrows indicate statistically significant PDs, and white arrows indicate nonsignificant PDs defined by a bootstrapping method (see materials and methods). Respective PDs with statistical significance: A: −181.8° PRO, −98.4° SUP; B: −160.4° PRO, −178.5° SUP; C: −139.3° PRO, −144.4° SUP. Here, 0° represents the rightward direction. A positive value indicates an upward bias, and a negative value indicates a downward bias.
Fig. 7.
Fig. 7.
A total of 2 samples of SS activity of PCs. A and B: raster plots, histograms, and contour plots of typical examples of activity of PCs in 2 postures (PRO and SUP). The same format is used as for MFs in Fig. 6. Inverted filled triangles above histograms indicate significant suppression compared with spontaneous activity. Each tick mark on the ordinate of the histograms represents 100 Hz; thus, 2 ticks represent 200 Hz. Note the high spontaneous SS activities in PCs. The time windows for calculation of PDs were as follows: A and E: −100 to 0 ms relative to movement onset; B and G: −100 to 100 ms relative to movement onset. A significant PD (black arrow beside contour plot) was obtained only in B PRO, 99.7°. C: start and finish time of activity suppression in the sample cell presented in A, PRO. Note that these times changed with movement direction. The finish time for the up+rt direction was 265 ms relative to movement onset and is off scale. D: distribution of the earliest start time and the latest finish time of suppressive modulation observed in PCs (n = 25 for PRO, 20 for SUP) that exhibited suppressive modulation in >5 directions. The 2 dark gray bars indicate start times for the 2 postures (darker for PRO than SUP), and the 2 light gray bars indicate finish times. The leftmost bar includes PCs with suppression times earlier than −300 ms, and the rightmost bar includes PCs with suppression times later than 300 ms relative to movement onset. E and F: mean activity for 100 ms before movement onset (E) and in more precise time windows (F) for the neuron shown in A. Movement direction is indicated on the abscissae. Mean firing rate for each direction is indicated on the ordinate. Note that the ordinate scales differ for different graphs. The thick, smooth gray lines show significant cosine tuning, and the dashed vertical lines indicate the estimated PD. G and H: mean activity for 100 ms before to 100 ms after movement onset (G) and in more precise time windows (H) for the neuron shown in B. Note that the graphs in H show time periods before and after movement onset only for SUP. The lines in H have the same meaning as in F.
Fig. 8.
Fig. 8.
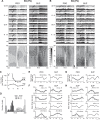
Cell-type specific properties of activities of MFs, GoCs, and PCs. A: distribution of modulation onsets relative to movement onset; n = 54 MFs, 25 GoCs, 42 PCs (SS). B: percentage of each neuron type with significant directionality in both forearm postures. Directionality was evaluated in 25-ms bins during the time window of ±300 ms relative to movement onset; n = 54 MFs, 25 GoCs, 42 PCs (SS). Asterisks below the abscissa indicate a significant difference (P < 0.05) in X2-test among the 3 neuron types (MFs, GoCs, PCs). Normal triangles above the GoC line indicate a significant difference (P < 0.05) in X2-test between MFs and GoCs. Inverted triangles above the GoC line indicate a significant difference (P < 0.05) in X2-test between SSs and GoCs. Section signs (§) indicate a significant difference (P < 0.05) in X2-test between MFs and PCs.
Fig. 9.
Fig. 9.
Temporal characteristics of PDs for MFs and PCs. A: coefficient of circular correlation (CCC) between PD in a reference time window (gray vertical column marked ref. period, −25 to 0 ms relative to movement onset) and remaining test windows for MFs and SSs of PCs. The ordinate is the value of CCC. Open circles indicate significant CCCs (P < 0.05), and dots indicate insignificant CCCs. We combined results from the 2 postures for this figure because PRO and SUP had similar results (not shown). Small letters a–f indicate the 6 time windows shown in B. B: comparison of PDs between the reference and test time windows for MFs (top) and PCs (bottom). The 6 scatter plots (labeled a–f) show PDs in the 6 peri-movement time windows indicated in A. Bin width = π/8. For this plot only, the values of PD were assigned to the nearest movement direction. We counted cells in each of the 64 grid points (8 directions in reference period × 8 directions in test period). The area of each circle indicates the percentage of cells with the same PDs in both the reference and test periods. Note that a random distribution of PDs would yield about 1.6% (1/64) at each grid point, or about 1 cell.
Fig. 10.
Fig. 10.
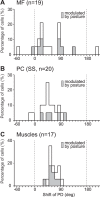
Distribution of shifts in PD from PRO to SUP for MFs (A), PCs (B), and task-related muscles (C) in a time window of −25 to 0 ms relative to movement onset. Shaded bars represent neurons or EMGs showing “gain modulation” (i.e., a change in the maximum of mean activity of >30% with a change of forearm posture). Bin width = 10°. Note that 180° is the same as −180°.
Fig. 11.
Fig. 11.
Comparison of summed activity of all recorded MFs with activity of a typical GoC for the 2 forearm postures (PRO and SUP). A: contour plots of the summed activity of all MFs (n = 54). B: contour plots of activity of a typical GoC (same as Fig. 6D). The change in appearance from Fig. 6D is due to a shorter time axis, which increased the minimum firing rate.
Fig. 12.
Fig. 12.
Comparison of normalized, directionally aligned activities of 3 neuron types. A: contour plots of mean normalized activity for each type of neuron; n = 54 MFs, 25 GoCs, 42 PCs (SS). White rectangles indicate the 25-ms time window immediately before movement onset. B: directional modulation in the 25-ms time window highlighted by the white rectangles in A. Thin black lines show the mean values of the normalized firing rate in each of the 8 movement directions. Thick gray lines show the best fit cosine, calculated as in Kakei et al. (1999). Vertical dashed lines indicate the PD of each cosine curve, plotted relative to the direction of highest activity. PD was shifted by 5.2° in MFs, 7.8° in GoCs, 8.0° in PCs (SS). Horizontal dashed lines indicate the mean normalized firing rate in the first time bin (−300 to −275 ms relative to Move) of all 8 directions as a baseline. Baseline was at 0.20 (SD 0.03) for MFs, 0.25 (SD 0.03) for GoCs, 0.46 (SD 0.02) for PCs (SS). All figures were made using data in PRO, but we obtained nearly the same results in SUP (not shown).

Similar articles

Cited by

References

    1. Ambrosi G, Flace P, Lorusso L, Girolamo F, Rizzi A, Bosco L, Errede M, Virgintino D, Roncali L, Benagiano V. Non-traditional large neurons in the granular layer of the cerebellar cortex. Eur J Histochem 51, Suppl 1: 59–64, 2007. - PubMed
    1. Baker J, Gibson A, Glickstein M, Stein J. Visual cells in the pontine nuclei of the cat. J Physiol 255: 415–433, 1976. - PMC - PubMed
    1. Barmack NH, Yakhnitsa V. Functions of interneurons in mouse cerebellum. J Neurosci 28: 1140–1152, 2008. - PMC - PubMed
    1. Bourbonnais D, Krieger C, Smith AM. Cerebellar cortical activity during stretch of antagonist muscles. Can J Physiol Pharmacol 64: 1202–1213, 1986. - PubMed
    1. Brayanov JB, Press DZ, Smith MA. Motor memory is encoded as a gain-field combination of intrinsic and extrinsic action representations. J Neurosci 32: 14951–14965, 2012. - PMC - PubMed

Publication types

LinkOut - more resources