

Hypothalamic POMC Deficiency Improves Glucose Tolerance Despite Insulin Resistance by Increasing Glycosuria
- PMID: 26467632
- PMCID: PMC4764146
- DOI: 10.2337/db15-0804
Hypothalamic POMC Deficiency Improves Glucose Tolerance Despite Insulin Resistance by Increasing Glycosuria
Abstract
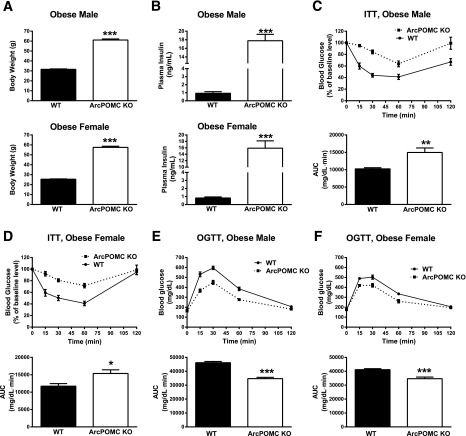
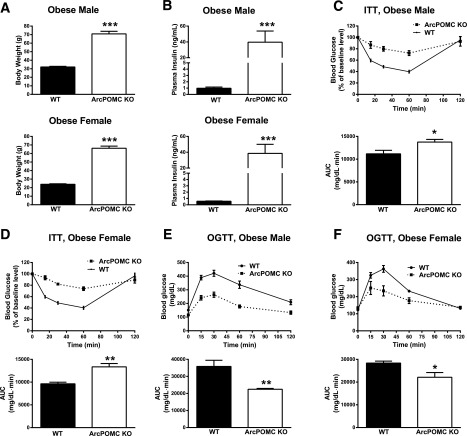
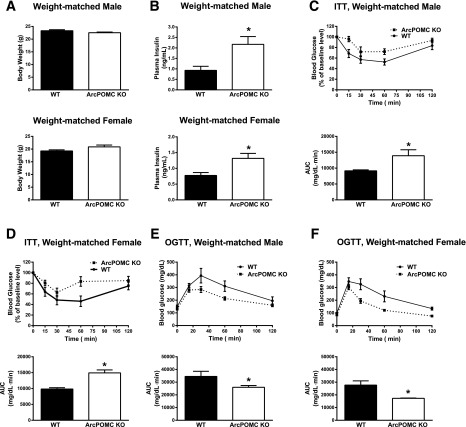
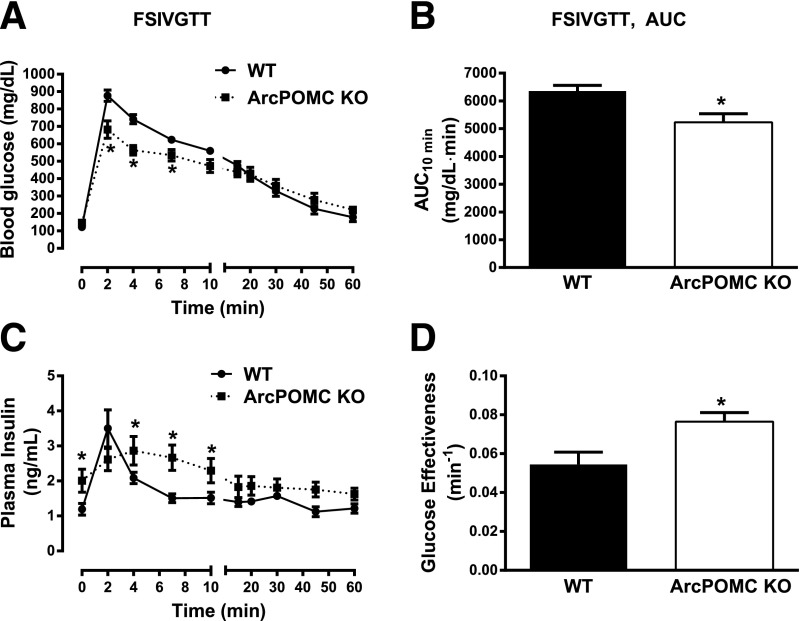
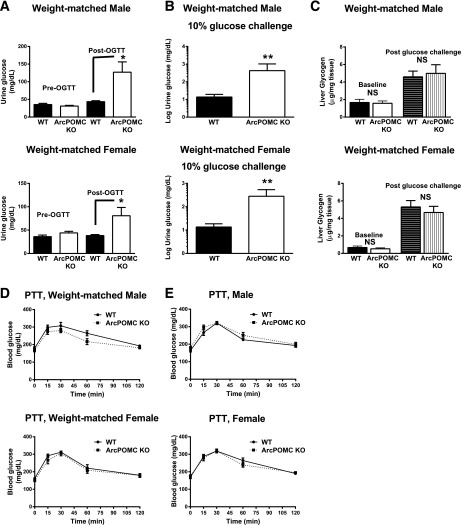
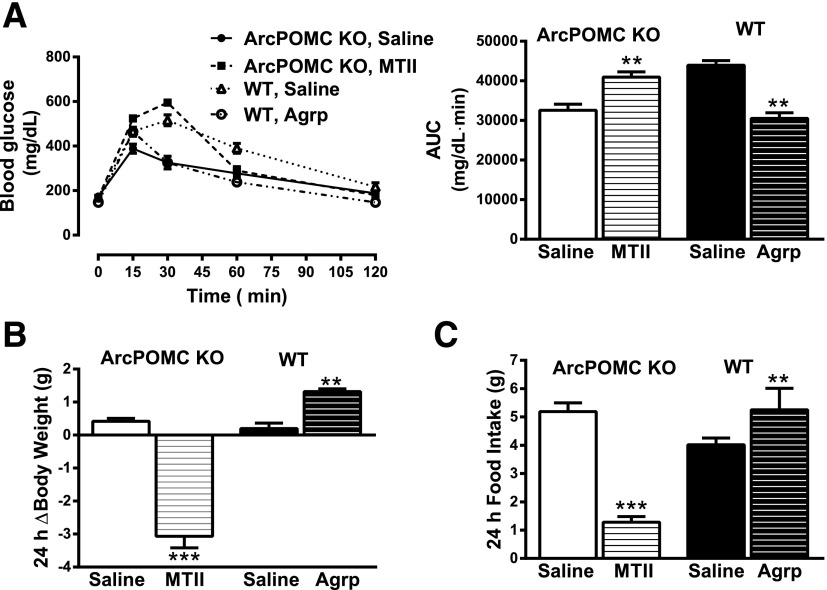
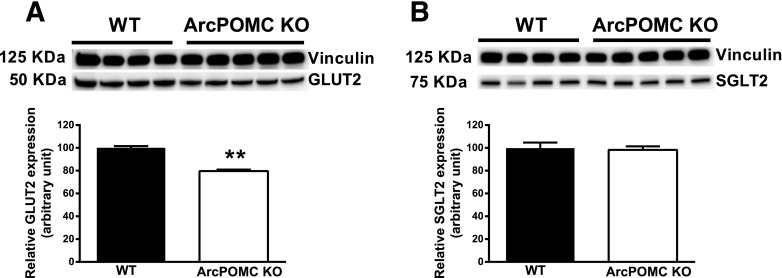
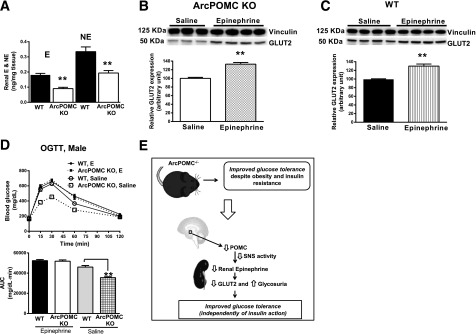
Hypothalamic proopiomelanocortin (POMC) is essential for the physiological regulation of energy balance; however, its role in glucose homeostasis remains less clear. We show that hypothalamic arcuate nucleus (Arc)POMC-deficient mice, which develop severe obesity and insulin resistance, unexpectedly exhibit improved glucose tolerance and remain protected from hyperglycemia. To explain these paradoxical phenotypes, we hypothesized that an insulin-independent pathway is responsible for the enhanced glucose tolerance. Indeed, the mutant mice demonstrated increased glucose effectiveness and exaggerated glycosuria relative to wild-type littermate controls at comparable blood glucose concentrations. Central administration of the melanocortin receptor agonist melanotan II in mutant mice reversed alterations in glucose tolerance and glycosuria, whereas, conversely, administration of the antagonist Agouti-related peptide (Agrp) to wild-type mice enhanced glucose tolerance. The glycosuria of ArcPOMC-deficient mice was due to decreased levels of renal GLUT 2 (rGLUT2) but not sodium-glucose cotransporter 2 and was associated with reduced renal catecholamine content. Epinephrine treatment abolished the genotype differences in glucose tolerance and rGLUT2 levels, suggesting that reduced renal sympathetic nervous system (SNS) activity is the underlying mechanism for the observed glycosuria and improved glucose tolerance in ArcPOMC-deficient mice. Therefore, the ArcPOMC-SNS-rGLUT2 axis is potentially an insulin-independent therapeutic target to control diabetes.
© 2016 by the American Diabetes Association. Readers may use this article as long as the work is properly cited, the use is educational and not for profit, and the work is not altered.
Figures
Comment in
-
The Hypothalamic Melanocortin Pathway and the Regulation of Glucose Handling in the Kidney: A Sympathetic Look at Brain-Kidney Connection.Diabetes. 2016 Mar;65(3):548-50. doi: 10.2337/dbi15-0033. Diabetes. 2016. PMID: 26908905 No abstract available.
References
-
- Lam TK, Gutierrez-Juarez R, Pocai A, Rossetti L. Regulation of blood glucose by hypothalamic pyruvate metabolism. Science 2005;309:943–947 - PubMed
-
- Gelling RW, Morton GJ, Morrison CD, et al. . Insulin action in the brain contributes to glucose lowering during insulin treatment of diabetes. Cell Metab 2006;3:67–73 - PubMed
-
- Obici S, Zhang BB, Karkanias G, Rossetti L. Hypothalamic insulin signaling is required for inhibition of glucose production. Nat Med 2002;8:1376–1382 - PubMed
-
- Coppari R, Ichinose M, Lee CE, et al. . The hypothalamic arcuate nucleus: a key site for mediating leptin’s effects on glucose homeostasis and locomotor activity. Cell Metab 2005;1:63–72 - PubMed
Publication types
MeSH terms
Substances
Grants and funding
- R01 DK066604/DK/NIDDK NIH HHS/United States
- R01-DK-066604/DK/NIDDK NIH HHS/United States
- R25 DK088752/DK/NIDDK NIH HHS/United States
- R01-DK-068400/DK/NIDDK NIH HHS/United States
- T32 NS076401/NS/NINDS NIH HHS/United States
- T32-NS-076401/NS/NINDS NIH HHS/United States
- P30-DK-089503/DK/NIDDK NIH HHS/United States
- R25-DK-088752/DK/NIDDK NIH HHS/United States
- R01 DK068400/DK/NIDDK NIH HHS/United States
- P30 DK020572/DK/NIDDK NIH HHS/United States
- U2C DK110768/DK/NIDDK NIH HHS/United States
- P30-DK-020572/DK/NIDDK NIH HHS/United States
- P30 DK089503/DK/NIDDK NIH HHS/United States
LinkOut - more resources
Full Text Sources
Other Literature Sources
Medical
Molecular Biology Databases
Miscellaneous
