. 2016 Jan;21(1):758-768.
doi: 10.2119/molmed.2015.00221. Epub 2015 Oct 13.

Overexpression of Cystathionine γ-Lyase Suppresses Detrimental Effects of Spinocerebellar Ataxia Type 3

Affiliations

Overexpression of Cystathionine γ-Lyase Suppresses Detrimental Effects of Spinocerebellar Ataxia Type 3

Pauline M Snijder et al. Mol Med. 2016 Jan.

Abstract

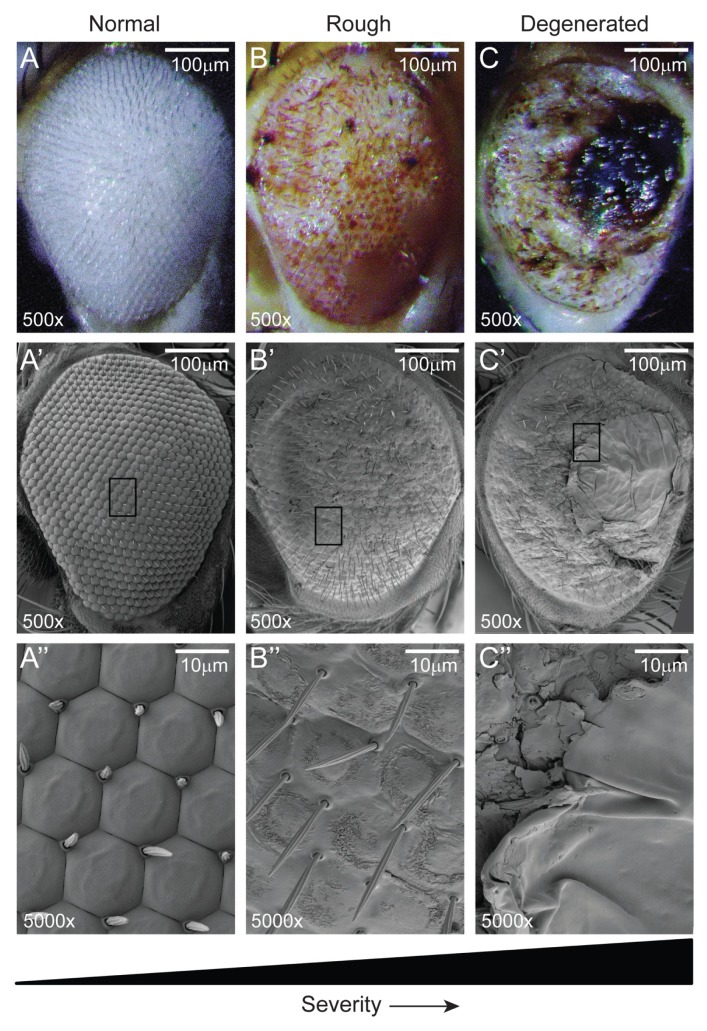
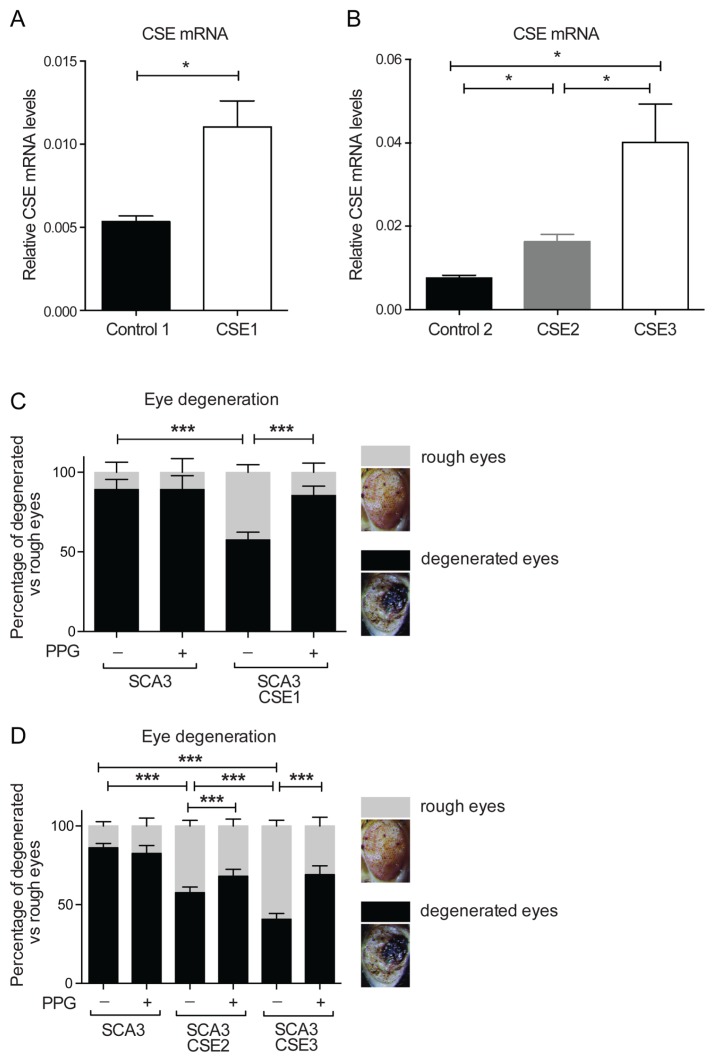
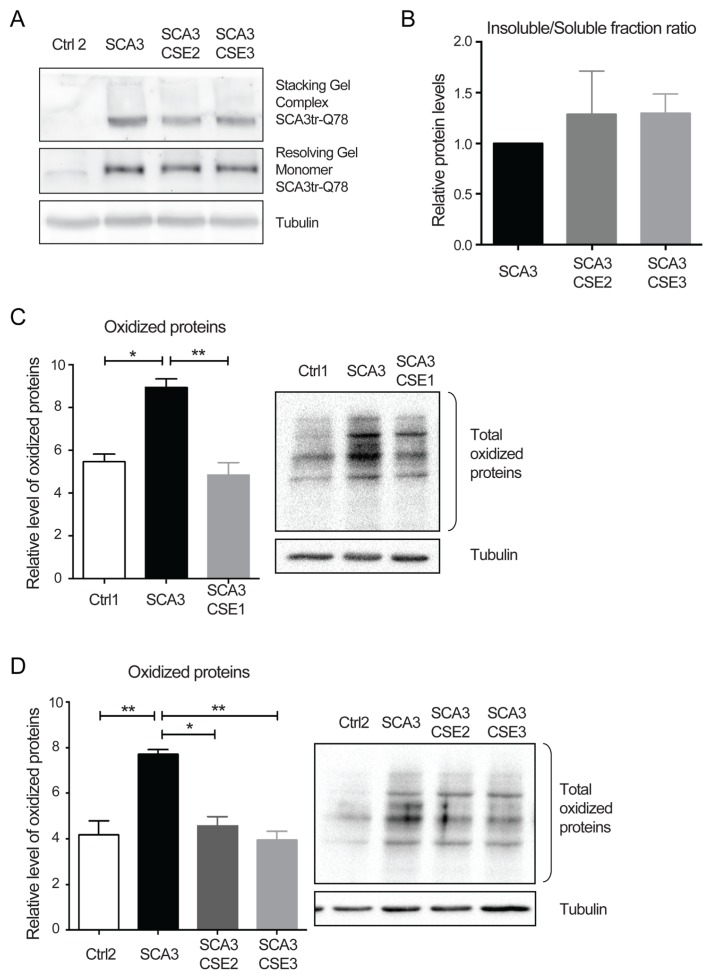
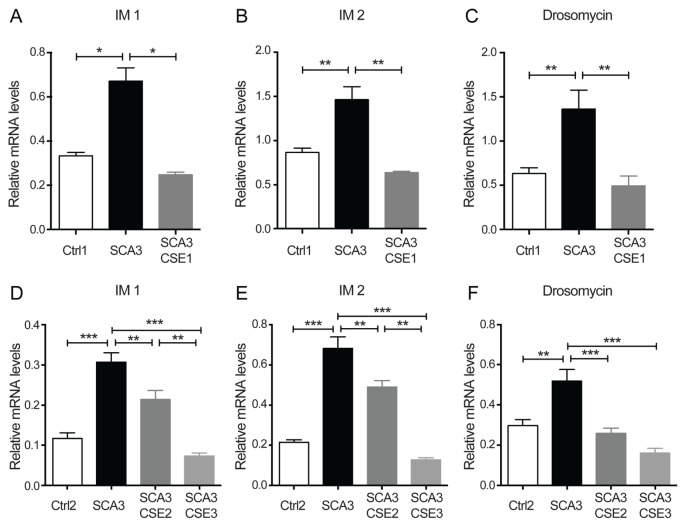
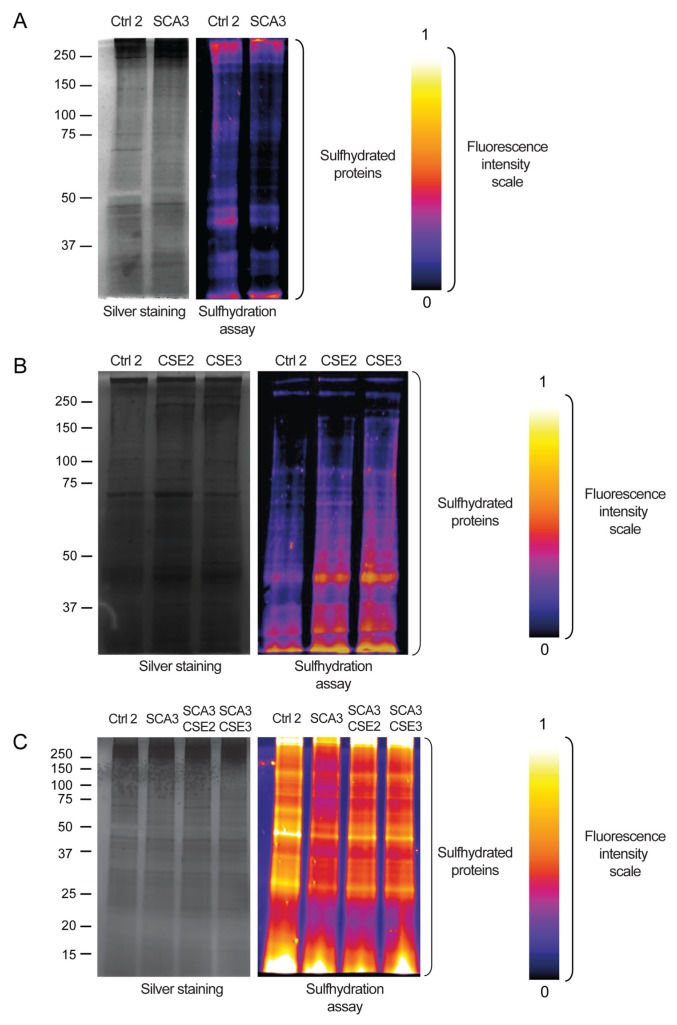
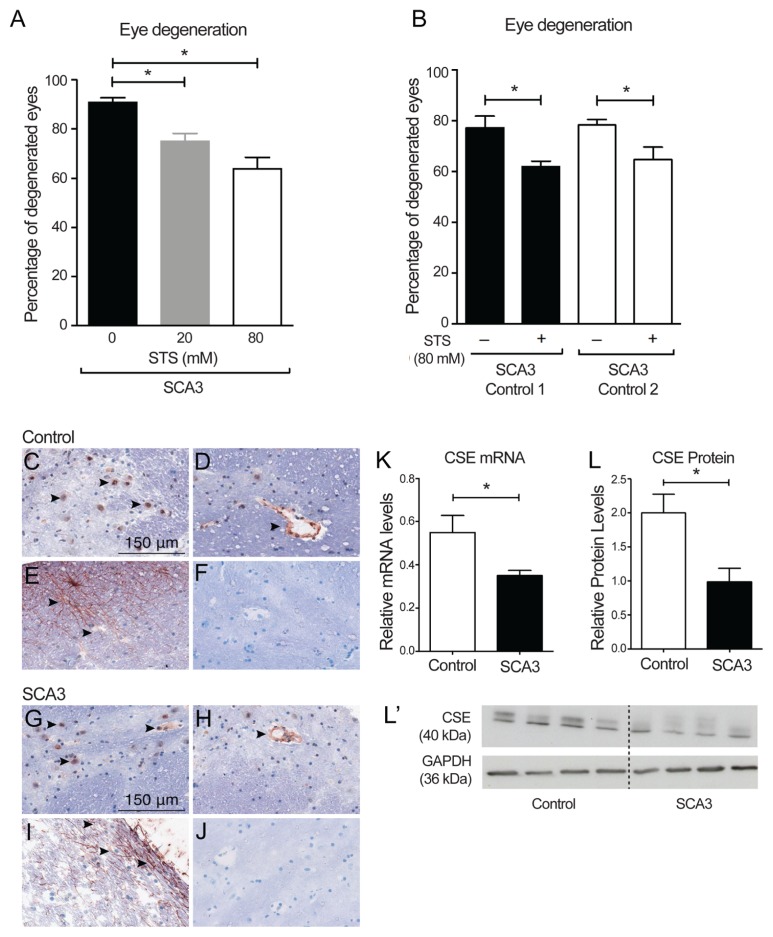
Spinocerebellar ataxia type 3 (SCA3) is a polyglutamine (polyQ) disorder caused by a CAG repeat expansion in the ataxin-3 (ATXN3) gene resulting in toxic protein aggregation. Inflammation and oxidative stress are considered secondary factors contributing to the progression of this neurodegenerative disease. There is no cure that halts or reverses the progressive neurodegeneration of SCA3. Here we show that overexpression of cystathionine γ-lyase, a central enzyme in cysteine metabolism, is protective in a Drosophila model for SCA3. SCA3 flies show eye degeneration, increased oxidative stress, insoluble protein aggregates, reduced levels of protein persulfidation and increased activation of the innate immune response. Overexpression of Drosophila cystathionine γ-lyase restores protein persulfidation, decreases oxidative stress, dampens the immune response and improves SCA3-associated tissue degeneration. Levels of insoluble protein aggregates are not altered; therefore, the data implicate a modifying role of cystathionine γ-lyase in ameliorating the downstream consequence of protein aggregation leading to protection against SCA3-induced tissue degeneration. The cystathionine γ-lyase expression is decreased in affected brain tissue of SCA3 patients, suggesting that enhancers of cystathionine γ-lyase expression or activity are attractive candidates for future therapies.


Figures

Figure 1
Figure 1
Synthesis of Cy3-CN from a commercial Cy3-NHS ester. TEA, triethylamine; DMF, dimethylformamide.
Figure 2
Figure 2
Increased tissue degeneration is present in neurodegenerative patches within the rough eye background of SCA3 flies. Eyes of SCA3 and control flies were visualized in detail using light end electron microscopy. Representative light microscopy pictures (A, B, C) with correlative scanning electron microscopy pictures (A′, A, ″ B′, B, ″ C′, C″) of eye phenotypes are shown. (A, A′, A″) Normal control eye phenotype (B, B′, B″) SCA3-overexpressing eye with a phenotype classified as rough. (C, C′, C″) SCA3-overexpressing eye with a phenotype classified as degenerated; black patches show less preservation of tissue integrity.
Figure 3
Figure 3
CSE overexpression suppresses the SCA3 phenotype. (A, B) CSE overexpression was determined by using qRT-PCR in CSE (CSE1; CSE2; CSE3) overexpressing transgenic fly lines compared with their isogenic controls (control 1 and control 2). CSE was expressed ubiquitously by using an actin-GAL4 driver. In both genetic backgrounds, CSE mRNA levels were increased in the CSE-overexpressing lines compared with their isogenic controls. *p < 0.05, error bars indicate standard error of the mean (SEM). (C, D) SCA3 flies with and without overexpression of CSE (three independent lines) were analyzed. In all three transgenic lines in the SCA3 background, CSE overexpression resulted in a decrease of the degree of eye degeneration compared with isogenic SCA3-expressing lines. Inhibition of CSE by 2 mmol/L PPG diminished this effect. The presence of degenerative patches (black area) was determined by using light microscopy. For quantification, the number of rough and degenerated eyes in at least three independent experiments (n = 100–300 per experiment) was counted. ***p < 0.001, error bars indicate SEM. Black area represents the percentage of rough eyes containing neurodegenerative patches. Grey area represents percentage of rough eyes without neurodegenerative patches.
Figure 4
Figure 4
SCA3tr-Q78 protein expression and aggregation is not altered, and oxidative stress is reduced in the presence of CSE overexpression. (A) Western blot analysis of extracts of heads of SCA3-overexpressing flies was used to determine levels of protein aggregation. The samples were analyzed for the amount of soluble SCA3tr-78 protein (present in resolving gel) and levels of SCA3tr-78 protein aggregation (present in stacking gel) by using an anti-HA antibody. α-Tubulin was used as a loading control. In the SCA3 flies, both soluble monomer (in the resolving gel) and aggregated protein (in the stacking gel) fractions were detected. CSE overexpression did not significantly alter the solubility of the SCA3 protein. (B) Quantification of the ratio between the relative intensity of the protein band in the stacking gel and SCA3tr-78 monomer band in the resolving gel. There was no significant change in the protein solubility upon the overexpression of CSE in a SCA3 background (n = 5). (C, D) OxyBlot analysis of extracts derived from fly heads was used to examine levels of oxidized proteins. SCA3 flies had higher total levels of oxidized proteins compared with wild-type flies. CSE overexpression in the SCA3 background showed a reduction of oxidized proteins. Three independent CSE-overexpressing lines were used and compared with their isogenic controls. For quantification, optical density of oxidized proteins was normalized to tubulin; levels of oxidized proteins in CSE-overexpressing SCA3 fly samples were comparable to levels in control fly heads. *p < 0.05, **p < 0.01, error bars indicate SEM.
Figure 5
Figure 5
Overexpression of CSE prevents SCA3-related immune induction. mRNA levels of various immune response genes (IM1, IM2, Drosomycin) were determined by qRT-PCR in control flies, in SCA3 flies (2 genetic backgrounds) and in SCA3 flies overexpressing CSE in the same isogenetic background. In SCA3-expressing flies, all investigated immune players were upregulated compared with control flies of the same genetic background. In CSE-expressing flies in various SCA3 backgrounds, immune response gene expression was lower compared with the isogenetic SCA3 backgrounds. *p < 0.05, **p < 0.01 and ***p < 0.001, error bars indicate SEM. IM 1, immune-induced molecule 1; IM 2, immune-induced molecule 2.
Figure 6
Figure 6
Protein persulfidation is decreased in SCA3 flies and restored by overexpression of CSE. (A) Persulfidation levels in the SCA3 fly heads are decreased compared with control flies. Protein persulfidation was determined using the tag-switch assay with direct fluorescence labeling and in-gel fluorescence detection. The gels were artificially colorized in ImageJ for better visualization of the changes in the signal intensity. Fluorescence intensity scale is provided at the right. Silver-stained gels were shown to demonstrate equal protein loading of the samples. Note that because of the sensitivity of the methods, not all bands visualized by silver staining will be detected by the fluorescence detection of protein persulfidation and vice versa. Fluorescence intensity scale is provided; signal in the white-yellow range of colors indicates relatively high levels of protein persulfidation; signal in the black-blue range indicates relatively low levels of protein persulfidation. Extracts of control flies and SCA3 flies were loaded. (B) CSE overexpression in wild-type flies elevates levels of persulfidation. Protein persulfidation was determined using the tag-switch assay with direct fluorescence labeling and in-gel fluorescence detection. Extracts of flies overexpressing CSE showed an increase of protein persulfidation compared with the control flies. (C) Protein persulfidation levels in the SCA3 fly heads are decreased compared with control flies, and CSE overexpression in the SCA3 background resulted in the partial restoration of persulfidation levels.
Figure 7
Figure 7
Treatment with STS suppresses SCA3-associated degeneration in Drosophila, and CSE levels are decreased in brains of SCA3 patients. (A, B) Effect of the H2S donor sodium thiosulfate was determined on the degenerative eye phenotype by using light microscopy. The number of rough and degenerated eyes was counted in three independent experiments (n = 100–300 per experiment). (A) Increasing concentrations of STS resulted in a reduced percentage of degenerated rough eyes of SCA3-expressing flies in the control1 background. (B) Addition of 80 mmol/L STS to the food of SCA3-expressing lines in two genetic backgrounds partly rescued the SCA3-induced eye degenerative phenotype. *p < 0.05, error bars indicate SEM. (C–J) Immunohistochemistry by using an anti-human CSE antibody revealed that in control human pontine tissue (C–F) and in pontine tissue of SCA3 patients (sample 5, Supplementary Table S1) (representative images are shown in G–J), CSE is localized in neurons of the pontine nuclei (C, G), the vasculature (D, H) and astrocytes (E, I). Black arrows indicate the mentioned structures. No differences in staining pattern were observed between control and SCA3 brain tissue. Omission of the primary antibody resulted in absence of staining; representative images are shown (F, J). Scale bar indicates 150 μm in all images. (K) CSE mRNA levels were determined by using qRT-PCR (control, n = 7; SCA3, n = 6). (L,L′) CSE protein levels were determined using Western blot analysis. Control samples correspond with control: 2, 3, 4, 6, respectively (Supplementary Table S1); SCA3 samples correspond with SCA3: 2, 3, 4, 5, respectively (Supplementary Table S1). *p < 0.05, error bars indicate SEM.

References

    1. Zoghbi HY, Orr HT. Glutamine repeats and neurodegeneration. Annu Rev Neurosci. 2000;23:217–47. - PubMed
    1. Hageman J, et al. A DNAJB chaperone subfamily with HDAC-dependent activities suppresses toxic protein aggregation. Mol Cell. 2010;37:355–69. - PubMed
    1. Dueñas AM, Goold R, Giunti P. Molecular pathogenesis of spinocerebellar ataxias. Brain. 2006;129:1357–70. - PubMed
    1. Frake RA, Ricketts T, Menzies FM, Rubinsztein DC. Autophagy and neurodegeneration. J Clin Invest. 2015;125:65–74. - PMC - PubMed
    1. Lee S, Lim H, Masliah E, Lee H. Protein aggregate spreading in neurodegenerative diseases: problems and perspectives. Neurosci Res. 2011;70:339–48. - PMC - PubMed

LinkOut - more resources