. 2015 Oct 14;35(41):13927-42.
doi: 10.1523/JNEUROSCI.0477-15.2015.

Near-Critical Dynamics in Stimulus-Evoked Activity of the Human Brain and Its Relation to Spontaneous Resting-State Activity

Affiliations

Near-Critical Dynamics in Stimulus-Evoked Activity of the Human Brain and Its Relation to Spontaneous Resting-State Activity

Oshrit Arviv et al. J Neurosci. .

Abstract

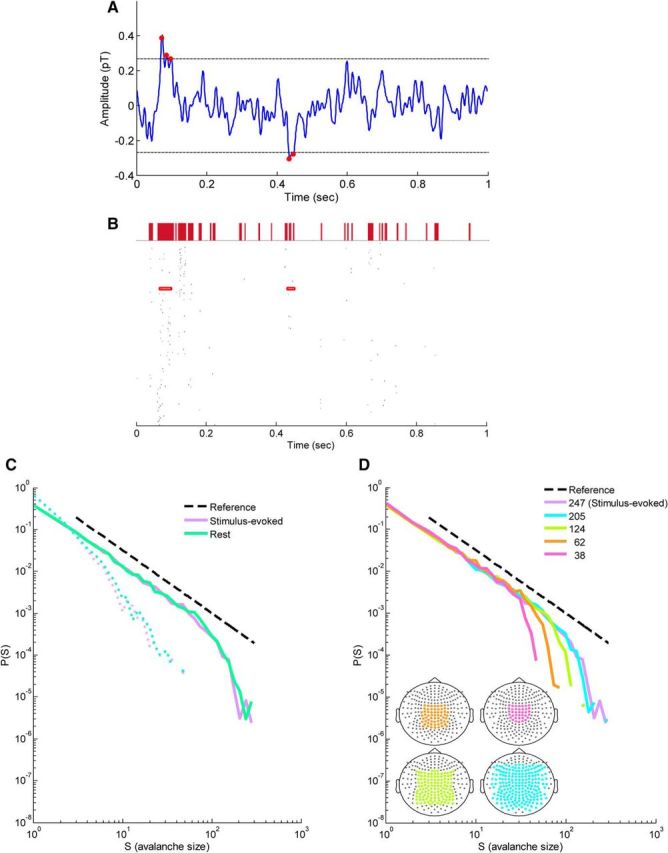
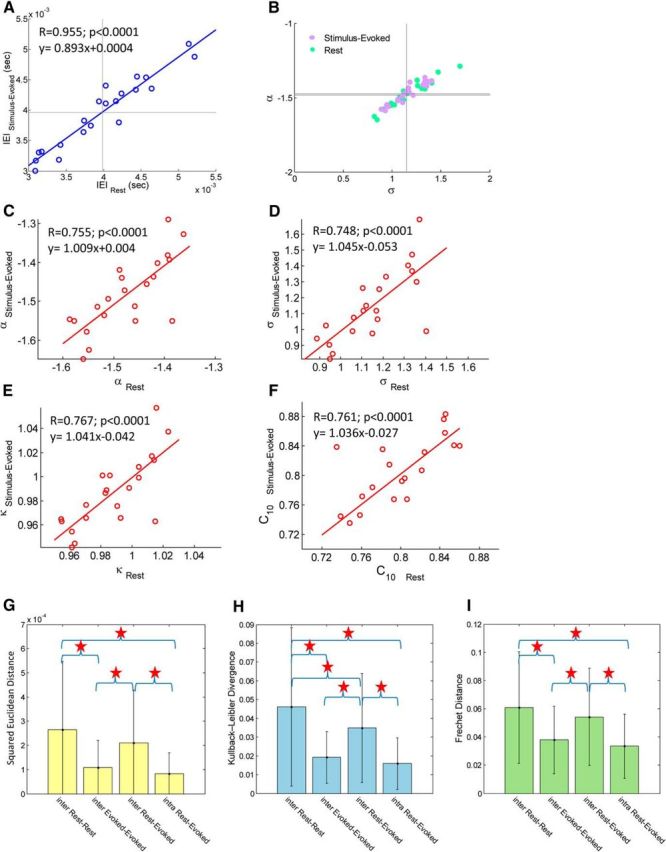
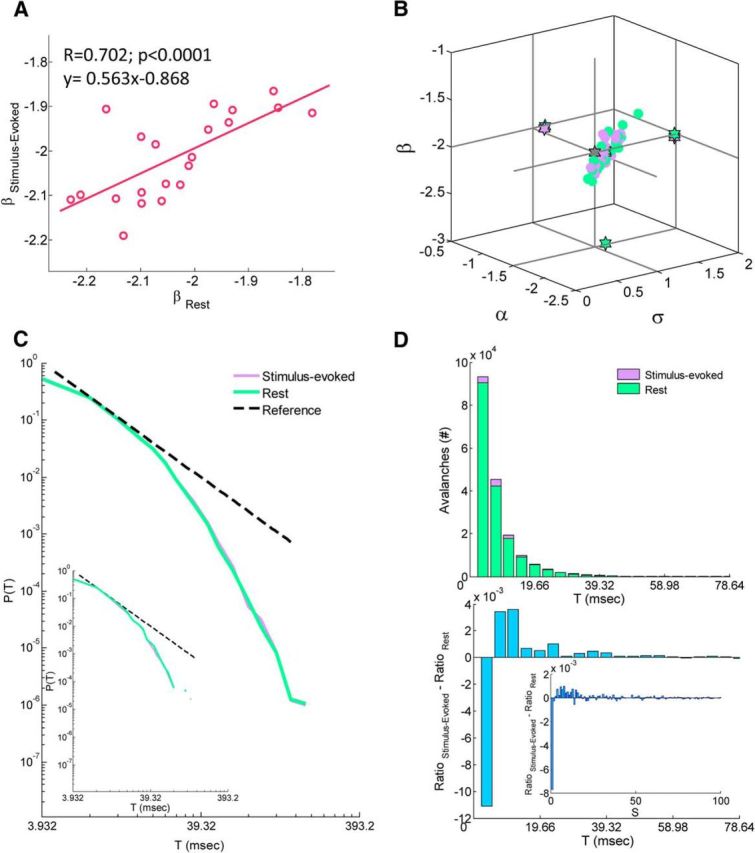
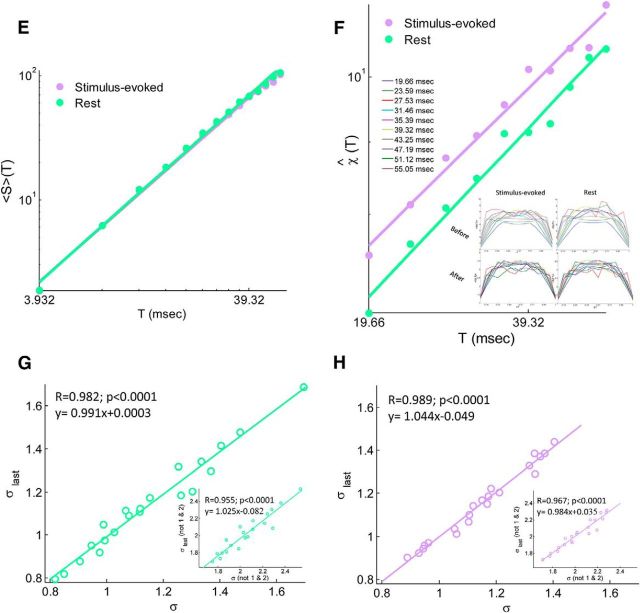
In recent years, numerous studies have found that the brain at resting state displays many features characteristic of a critical state. Here we examine whether stimulus-evoked activity can also be regarded as critical. Additionally, we investigate the relation between resting-state activity and stimulus-evoked activity from the perspective of criticality. We found that cortical activity measured by magnetoencephalography (MEG) is near critical and organizes as neuronal avalanches at both resting-state and stimulus-evoked activities. Moreover, a significantly high intrasubject similarity between avalanche size and duration distributions at both cognitive states was found, suggesting that the distributions capture specific features of the individual brain dynamics. When comparing different subjects, a higher intersubject consistency was found for stimulus-evoked activity than for resting state. This was expressed by the distance between avalanche size and duration distributions of different participants and was supported by the spatial spreading of the avalanches involved. During the course of stimulus-evoked activity, time locked to the stimulus onset, we demonstrate fluctuations in the gain of the neuronal system and thus short timescale deviations from the critical state. Nonetheless, the overall near-critical state in stimulus-evoked activity is retained over longer timescales, in close proximity and with a high correlation to spontaneous (not time-locked) resting-state activity. Spatially, the observed fluctuations in gain manifest through anticorrelative activations of brain sites involved, suggesting a switch between task-negative (default mode) and task-positive networks and assigning the changes in excitation-inhibition balance to nodes within these networks. Overall, this study offers a novel outlook on evoked activity through the framework of criticality.

Significance statement: The organization of stimulus-evoked activity and ongoing cortical activity is a topic of high importance. The article addresses several general questions. What is the spatiotemporal organization of stimulus-evoked cortical activity in healthy human subjects? Are there deviations from excitation-inhibition balance during stimulus-evoked activity? What is the relationship between stimulus-evoked activity and ongoing resting-state activity? Using magnetoencephalography (MEG), we demonstrate that stimulus-evoked activity in humans follows a critical branching process that produces neuronal avalanches. Additionally, we investigate the spatiotemporal relationship between resting-state activity and stimulus-evoked activity from the perspective of critical dynamics. These analyses reveal new aspects of this complex relationship and offer novel insights into the interplay between excitation and inhibition that were not observed previously using conventional approaches.

Keywords: ERF; ERP; MEG; criticality; face processing; neuronal avalanches.


Figures

Figure 1.
Figure 1.
Identification of cascades formed by discrete MEG events and the expected cascade size distributions at stimulus-evoked and resting-state activity in a single subject. A, Continuous MEG signal from a single sensor during stimulus-evoked activity. The most extreme point (red dot) in each excursion beyond a threshold of ±3 SDs (dashed horizontal lines) was identified as a discrete event in the signal. B, Raster of events on all sensors (n = 247) in a 1 s segment of recording (single stimulus-evoked trial from a single subject). Events from the single sensor that are marked by red dots in A are enclosed by red rectangles. A cascade of events was defined as a series of time bins in which at least one event occurred across the sensor array, ending with a silent time bin. Here, the time bin width was 3.93 ms, four times the sampling time step (0.983 ms; 1017.25 Hz). The size of each cascade is defined as the number of events involved in the cascade. Above the raster plot, the cascades defined using this procedure are marked by filled red rectangles with base length corresponding to the duration of the cascade. C, Cascade size distributions from a single subject for stimulus-evoked and rest data (solid violet and green line, respectively; dashed violet and green lines correspond to phase-shuffled data). Dashed black line represents a power law with an exponent of −32. Cascade size distributions follow power laws, as expected for neuronal avalanches. D, Cascade size distributions of stimulus-evoked for subsamples of the sensor array. Line color indicates the number of sensors in the analysis: pink, 38; orange, 62; lime, 124; cyan, 205; and violet, 247. Bottom left insets, Diagrams of the sensor array with colored subsamples.
Figure 2.
Figure 2.
Correlations of neuronal avalanche parameters and similarity of avalanche size distribution: intersubject and intrasubject comparisons for stimulus-evoked activity versus rest. A, Correlation of IEIs between stimulus-evoked and resting state. Each point represents a single subject, and solid vertical and horizontal lines denote mean across subjects of the perpendicular axis (〈IEI〉 = 3.96 ± 0.59 ms and 3.98 ± 0.63 ms for stimulus-evoked and rest, respectively). B, Phase plots of the power-law exponent α versus the branching parameter σ. Each violet point represents a single subject at stimulus-evoked, and each green point represents a single subject at rest. Solid vertical and horizontal lines denote mean across subjects of the perpendicular axis (〈α〉 = −1.47 ± 0.07 and −1.48 ± 0.09; 〈σ〉 = 1.15 ± 0.16 and 1.15 ± 0.22 for stimulus-evoked and rest, respectively). C–F, Correlation of the power-law exponent α (C), branching parameter σ (D), κ (E), and the tail of the CDF, C10 (F) between stimulus-evoked and resting state in each subject. High consistency in all these parameters was found in each subject. G–I, Similarity of avalanche size distributions using squared Euclidean distance (G), Kullback–Leibler divergence (H), and Frechet distance (I). Similarity between intersubject stimulus-evoked activities and between intrasubject stimulus-evoked to resting state was greater than similarity between intersubject resting states.
Figure 3.
Figure 3.
Temporal organization of neuronal avalanches. A, Correlation of the power-law exponent β of the duration distribution between stimulus-evoked and resting state. Each point represents a single subject. B, A three-dimensional phase plot of the power-law exponents β and α versus the branching parameter σ for both stimulus-evoked and rest. Stars indicate across subjects mean and two-dimensional projections of the mean. Each violet and green point corresponds to a single subject at stimulus-evoked and rest, respectively. C, A grand (across subjects) cascade duration distributions for stimulus-evoked and rest data (solid violet and green line, respectively). Dashed black line represents a power law with an exponent of −2. Inset, From a single subject. Cascade duration distributions follow power laws, as expected for neuronal avalanches. D, Top, Histogram of number of avalanches from discrete durations for both stimulus-evoked and rest. Each bar represent a bin of duration Δt = 3.932 ms. The histogram was cut at 20 × Δt = 78.64 ms for better visualization (longest avalanche collected 56 × Δt = 220.19 ms). Bottom, A difference between stimulus-evoked and rest normalized duration histograms (i.e., after division by the corresponding sum of all avalanches collected at each cognitive state separately; inset, same for size histograms, histograms were cut at an avalanche size of 100 for better visualization). Although there are more avalanches collected during stimulus-evoked than in rest (>5.42%), the avalanches collected during stimulus-evoked tend to be lengthier (and larger) than in rest. E, F, Avalanche shape collapse analysis. E, The mean avalanche size for each duration 〈S〉(T) as a function of duration, T in log–log scales. The extracted power-law exponent b + 1 is equal to 1.48 and 1.50 for stimulus-evoked and rest, respectively. F, The estimated scaling function χ̂(T) [which collapses the temporal profile for each duration, S(t, T) to the universal shape F(t/T)] as a function of duration T. The extracted power-law exponent b is equal to 0.37 and 0.40 for stimulus-evoked and rest, respectively. Insets, Mean avalanche shape for each duration, before and after collapse, for both stimulus-evoked (left) and rest (right). G, H, A correlation between σlast, a new estimate based on calculating the ratio between the last two bins of each avalanche in the reverse direction, and σ, which relies on the first two bins, for both stimulus-evoked and rest. We found that these two estimates are highly correlated and provide similar estimates (σlast = 1.15 ± 0.17 and 1.14 ± 0.23 for stimulus-evoked and rest, respectively), reflecting a symmetry between avalanche initiation and termination. Insets, Excluding avalanches of size 1 and 2, for which the definitions of σ and σlast are identical, still preserves a high correlation between the two estimates.
Figure 3.
Figure 3.
Temporal organization of neuronal avalanches. A, Correlation of the power-law exponent β of the duration distribution between stimulus-evoked and resting state. Each point represents a single subject. B, A three-dimensional phase plot of the power-law exponents β and α versus the branching parameter σ for both stimulus-evoked and rest. Stars indicate across subjects mean and two-dimensional projections of the mean. Each violet and green point corresponds to a single subject at stimulus-evoked and rest, respectively. C, A grand (across subjects) cascade duration distributions for stimulus-evoked and rest data (solid violet and green line, respectively). Dashed black line represents a power law with an exponent of −2. Inset, From a single subject. Cascade duration distributions follow power laws, as expected for neuronal avalanches. D, Top, Histogram of number of avalanches from discrete durations for both stimulus-evoked and rest. Each bar represent a bin of duration Δt = 3.932 ms. The histogram was cut at 20 × Δt = 78.64 ms for better visualization (longest avalanche collected 56 × Δt = 220.19 ms). Bottom, A difference between stimulus-evoked and rest normalized duration histograms (i.e., after division by the corresponding sum of all avalanches collected at each cognitive state separately; inset, same for size histograms, histograms were cut at an avalanche size of 100 for better visualization). Although there are more avalanches collected during stimulus-evoked than in rest (>5.42%), the avalanches collected during stimulus-evoked tend to be lengthier (and larger) than in rest. E, F, Avalanche shape collapse analysis. E, The mean avalanche size for each duration 〈S〉(T) as a function of duration, T in log–log scales. The extracted power-law exponent b + 1 is equal to 1.48 and 1.50 for stimulus-evoked and rest, respectively. F, The estimated scaling function χ̂(T) [which collapses the temporal profile for each duration, S(t, T) to the universal shape F(t/T)] as a function of duration T. The extracted power-law exponent b is equal to 0.37 and 0.40 for stimulus-evoked and rest, respectively. Insets, Mean avalanche shape for each duration, before and after collapse, for both stimulus-evoked (left) and rest (right). G, H, A correlation between σlast, a new estimate based on calculating the ratio between the last two bins of each avalanche in the reverse direction, and σ, which relies on the first two bins, for both stimulus-evoked and rest. We found that these two estimates are highly correlated and provide similar estimates (σlast = 1.15 ± 0.17 and 1.14 ± 0.23 for stimulus-evoked and rest, respectively), reflecting a symmetry between avalanche initiation and termination. Insets, Excluding avalanches of size 1 and 2, for which the definitions of σ and σlast are identical, still preserves a high correlation between the two estimates.
Figure 4.
Figure 4.
Grand all-subjects stimulus-evoked response. A, Grand raster of events on all sensors (n = 247) in the first 500 ms after stimulus onset. The grand raster was obtained by summing all event rasters from all stimulus-evoked trials that were recorded from all subjects. Sensors in the raster were sorted according to ascending event rate (i.e., sensors with highest rate are at the bottom) associated with the time interval that was determined by the first crossings of summed event rates over sensors + 2 SDs of peristimulus baseline (accordingly, time interval found was 72–145 ms). On the left of the raster plot are maps of sensor locations (marked by green dots) that are associated with the corresponding rows (grouped in by a curly bracket) of the grand raster plot (n1 = 101; n2 = 103; n3 = 43, respectively). B, Event rate topography, i.e., within the indicated time interval, is plotted. Sensors corresponding to maps in A (left) are marked by asterisks on top of this topography. C, Grand stimulus-evoked ERF, obtained by averaging across subjects and trials. Each curve represents a sensor. Absolute value of ERF (main panel), ERF (top right inset), and mean over sensors absolute ERF (bottom right inset) are portrayed. The M100 and M170 ERF components are clearly visible, whereas no clear separation is visible for later components. D, Topographic plots of the ERF components in the time intervals corresponding to the M100 and M170. Note the similarity between the topography of the conventional ERF and the one associated with event rates.
Figure 5.
Figure 5.
Temporal and spatial unfolding of grand stimulus-evoked and rest responses. A, B, Main panels, Grand raster for the combined fixation-evoked and stimulus-evoked time interval (−1300 until 1000 ms; A) and for resting state (0–1000 ms epochs; B), respectively. Stimulus-evoked data were analyzed using two alternatives of time-locking schemes [(1) time was locked to fixation onset (x-axis starts from 0) and stimulus onset; (2) time was locked to stimulus onset alone (x-axis starts from −1.3)] and resulted in almost identical profiles. Deviation between profiles was only limited to the leftmost range of the x-axis because of jitter in fixation length and accordingly the timing of anticipated evoked response to fixation cue. Grand raster plots were obtained by summing all event rasters from all relevant epochs from all subjects. Sensors in raster were arranged as in Figure 3A. A, B, Top panels, PSTH of event rate obtained by sample-wise summing of all events from all sensors and dividing by time. Sliding window of 10 samples was used for smoothing. The vertical lines at time of 0 s at both the grand raster and PSTH of combined fixation-evoked and stimulus-evoked mark a brake in continuity of datasets as a result of the random jitter in stimulus onset. Grand raster plots and PSTH of stimulus-evoked activity clearly show an evoked response with a preparatory and post-activation responses, whereas a more plateau-like response is demonstrated for resting state. A, B, Right panels, Event rates per sensor were calculated by summing all events from all samples and dividing by time. Event rate plots reveal a nearly complementary spatial distribution across sensors for the 1 s stimulus-evoked (A, red) versus 1 s resting state (B, green), whereas a more uniform spatial distribution is demonstrated for the combined fixation-evoked and stimulus-evoked time interval. C, Comparing grand raster for the combined fixation-evoked (time marked with *) and stimulus-evoked time interval to the conventional ERF perspective (absolute root mean squared, subtracted by the mean of all signals and divided by their SD) (−1300 until 1000 ms) demonstrates that preparatory and post-activation responses have no counterpart ERFs.
Figure 6.
Figure 6.
Temporal unfolding of the branching parameter σ of stimulus-evoked and rest responses. A, The evolution across time of the branching parameter σ from the combined fixation-evoked and stimulus-evoked time interval (−1300 until 1000 ms). Data were analyzed according to two alternative time-locking schemes (for details, see legend of Figure 5A) and resting state (B) (0–1000 ms epochs). The branching parameter unfolding was obtained by summing all momentary branching parameter (associated with the first time bin of each avalanche) from all relevant epochs (normalized by dividing by the number of all avalanche and multiplied by the number of time bins) from each subject. The displayed curves (violet in A and green in B) demonstrate the average across subjects, with the surrounding filled curves display the boundaries of ±SEM. Similarly, in both A and B, the constant blue line represents the average branching parameter across rest (mean ± SEM, 1.16 ± 0.11). The difference between the combined fixation-evoked and stimulus-evoked (A) as well as resting state (B) to the mean branching parameter across rest was found to be significant only for the combined fixation-evoked and stimulus-evoked for each consecutive 200 ms interval between −700 and 400 ms (marked by blue vertical lines; area marked by partly transparent rectangle; p < 0.05, Bonferroni's corrected for multiple comparisons). No other segments revealed a significance difference compared with the average branching parameter across rest.
Figure 7.
Figure 7.
Spatial distribution of avalanches in stimulus-evoked and resting-state activity. A, Topography of relative avalanche rate for time-locked stimulus-evoked response (time interval of interest, as revealed by PSTH; Fig. 5A). Relative avalanche rate per sensor and time interval was calculated by dividing the rate at which a specific sensor participated in avalanches during the specific time interval by the mean avalanche rate across all sensors and all time intervals. Thus, relative avalanche rate of 1 indicates that the rate of the participation of a particular sensor in avalanches as the average. Color bars of top row are set by minimum–maximum values of a specific plot, whereas for the bottom row, the color bar was fixed (0.45, 2.35). B, Topography of relative avalanche rate for the 1 s stimulus-evoked (right) versus 1 s resting state (left). C, Differences in probability (±SEM) for a sensor to participate in any avalanche that concur during 1 s stimulus-evoked versus 1 s resting state. Thus, a negative probability (left side of the bimodal histogram located on the bottom right inset, bluish sensors in topography, top left inset) indicate higher probability for the specific sensor to participate in avalanches that occurred during resting-state versus stimulus-evoked activity. A clear spatial contiguity of topography is visible (top left inset, sensors are organized according to ascending order of the probability differences).

References

    1. Beggs JM. The criticality hypothesis: how local cortical networks might optimize information processing. Philos Trans A Math Phys Eng Sci. 2008;366:329–343. doi: 10.1098/rsta.2007.2092. - DOI - PubMed
    1. Beggs JM, Plenz D. Neuronal avalanches in neocortical circuits. J Neurosci. 2003;23:11167–11177. - PMC - PubMed
    1. Beggs JM, Timme N. Being critical of criticality in the brain. Front Physiol. 2012;3:163. doi: 10.3389/fphys.2012.00163. - DOI - PMC - PubMed
    1. Calder A, Rhodes G, Johnson M, Haxby J. Oxford handbook of face perception. Oxford, UK: Oxford UP; 2011.
    1. Clauset A, Shalizi CR, Newman MEJ. Power-law distributions in empirical data. SIAM Rev. 2009;51:4. doi: 10.1137/070710111. - DOI

Publication types

LinkOut - more resources